
|
|||||
|
 | |
| |
| |
| |
| |
| |
|
Gene: CPN2 |
Gene summary for CPN2 |
| Gene information | Species | Human | Gene symbol | CPN2 | Gene ID | 1370 |
| Gene name | carboxypeptidase N subunit 2 | |
| Gene Alias | ACBP | |
| Cytomap | 3q29 | |
| Gene Type | protein-coding | GO ID | GO:0008150 | UniProtAcc | P22792 |
Top |
Malignant transformation analysis |
| Identification of the aberrant gene expression in precancerous and cancerous lesions by comparing the gene expression of stem-like cells in diseased tissues with normal stem cells |
| Entrez ID | Symbol | Replicates | Species | Organ | Tissue | Adj P-value | Log2FC | Malignancy |
| 1370 | CPN2 | HCC1_Meng | Human | Liver | HCC | 5.70e-42 | 1.47e-01 | 0.0246 |
| 1370 | CPN2 | HCC1 | Human | Liver | HCC | 4.38e-12 | 2.75e+00 | 0.5336 |
| 1370 | CPN2 | HCC2 | Human | Liver | HCC | 4.12e-24 | 3.16e+00 | 0.5341 |
| 1370 | CPN2 | S015 | Human | Liver | HCC | 4.71e-03 | 2.67e-01 | 0.2375 |
| 1370 | CPN2 | S027 | Human | Liver | HCC | 1.39e-14 | 7.09e-01 | 0.2446 |
| 1370 | CPN2 | S028 | Human | Liver | HCC | 3.35e-32 | 8.89e-01 | 0.2503 |
| 1370 | CPN2 | S029 | Human | Liver | HCC | 1.28e-24 | 8.81e-01 | 0.2581 |
| Page: 1 |
| Tissue | Expression Dynamics | Abbreviation |
| Liver | 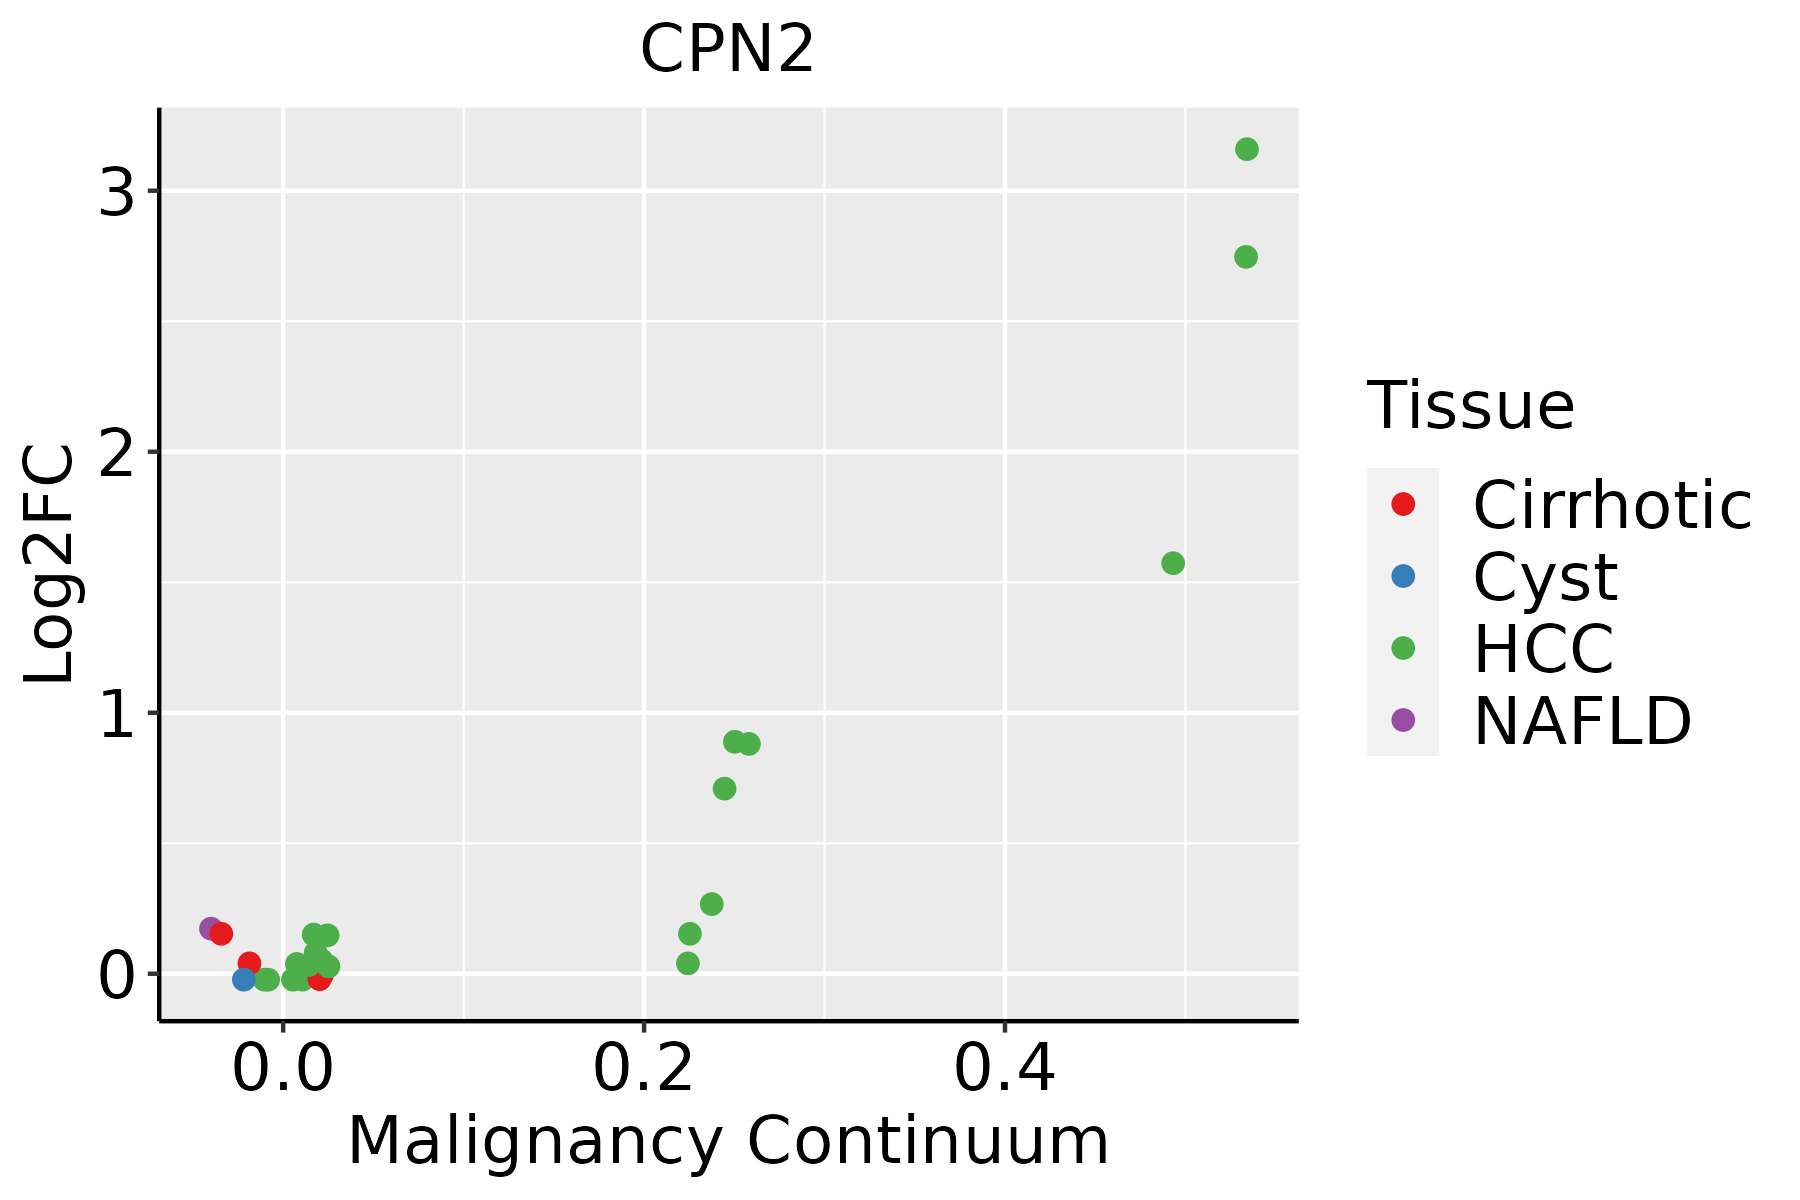 | HCC: Hepatocellular carcinoma |
| NAFLD: Non-alcoholic fatty liver disease |
| ∗log2FC in expression of this searched gene in stem-like cells from each diseased tissue sample relative to stem-like cells in normal samples in each tissue plotted against the malignancy continuum. Samples are colored based on if they are from different disease stage. |
Top |
Malignant transformation related pathway analysis |
| Find out the enriched GO biological processes and KEGG pathways involved in transition from healthy to precancer to cancer |
| Tissue | Disease Stage | Enriched GO biological Processes |
| Colorectum | AD |  |
| Colorectum | SER |  |
| Colorectum | MSS |  |
| Colorectum | MSI-H |  |
| Colorectum | FAP |  |
| ∗Top 15 enriched GO BP terms are showed in the bar plot of each disease state in each tissue. Each row represents a significant GO biological process which is colored according to the -log10(p.adjust). |
| Page: 1 2 3 4 5 6 7 8 9 |
| GO ID | Tissue | Disease Stage | Description | Gene Ratio | Bg Ratio | pvalue | p.adjust | Count |
| GO:003164722 | Liver | HCC | regulation of protein stability | 211/7958 | 298/18723 | 2.29e-23 | 5.01e-21 | 211 |
| GO:005082122 | Liver | HCC | protein stabilization | 139/7958 | 191/18723 | 1.61e-17 | 1.71e-15 | 139 |
| Page: 1 |
| Pathway ID | Tissue | Disease Stage | Description | Gene Ratio | Bg Ratio | pvalue | p.adjust | qvalue | Count |
| Page: 1 |
Top |
Cell-cell communication analysis |
| Identification of potential cell-cell interactions between two cell types and their ligand-receptor pairs for different disease states |
| Ligand | Receptor | LRpair | Pathway | Tissue | Disease Stage |
| Page: 1 |
Top |
Single-cell gene regulatory network inference analysis |
| Find out the significant the regulons (TFs) and the target genes of each regulon across cell types for different disease states |
| TF | Cell Type | Tissue | Disease Stage | Target Gene | RSS | Regulon Activity |
| ∗The dot plots of a searched regulon are shown for all cell subpopulations in each disease state of each tissue based on the regulon specific score inferred using pySCENIC and by calculating the average expression. |
| Page: 1 |
Top |
Somatic mutation of malignant transformation related genes |
| Annotation of somatic variants for genes involved in malignant transformation |
| Hugo Symbol | Variant Class | Variant Classification | dbSNP RS | HGVSc | HGVSp | HGVSp Short | SWISSPROT | BIOTYPE | SIFT | PolyPhen | Tumor Sample Barcode | Tissue | Histology | Sex | Age | Stage | Therapy Types | Drugs | Outcome |
| CPN2 | SNV | Missense_Mutation | c.593T>A | p.Leu198Gln | p.L198Q | P22792 | protein_coding | deleterious(0) | probably_damaging(0.989) | TCGA-AN-A0AR-01 | Breast | breast invasive carcinoma | Female | <65 | I/II | Unknown | Unknown | SD | |
| CPN2 | SNV | Missense_Mutation | c.822G>T | p.Trp274Cys | p.W274C | P22792 | protein_coding | deleterious(0.01) | benign(0.051) | TCGA-C8-A26Y-01 | Breast | breast invasive carcinoma | Female | >=65 | I/II | Unknown | Unknown | SD | |
| CPN2 | SNV | Missense_Mutation | novel | c.1496G>A | p.Cys499Tyr | p.C499Y | P22792 | protein_coding | deleterious(0) | probably_damaging(0.981) | TCGA-E2-A1B1-01 | Breast | breast invasive carcinoma | Female | <65 | I/II | Other, specify in notesbiphosphonate | zoledronic | SD |
| CPN2 | insertion | Frame_Shift_Ins | novel | c.1372_1373insATAGAGAAAAAAA | p.Trp458TyrfsTer42 | p.W458Yfs*42 | P22792 | protein_coding | TCGA-A7-A0CJ-01 | Breast | breast invasive carcinoma | Female | <65 | I/II | Chemotherapy | cytoxan | SD | ||
| CPN2 | SNV | Missense_Mutation | c.1351N>A | p.His451Asn | p.H451N | P22792 | protein_coding | tolerated(0.15) | benign(0.007) | TCGA-4J-AA1J-01 | Cervix | cervical & endocervical cancer | Female | <65 | I/II | Unknown | Unknown | SD | |
| CPN2 | SNV | Missense_Mutation | c.1380N>G | p.Asp460Glu | p.D460E | P22792 | protein_coding | tolerated(1) | benign(0.001) | TCGA-JX-A3Q0-01 | Cervix | cervical & endocervical cancer | Female | <65 | III/IV | Unknown | Unknown | SD | |
| CPN2 | SNV | Missense_Mutation | c.341N>T | p.Thr114Ile | p.T114I | P22792 | protein_coding | tolerated(0.11) | benign(0.001) | TCGA-AA-3663-01 | Colorectum | colon adenocarcinoma | Male | <65 | I/II | Unknown | Unknown | SD | |
| CPN2 | SNV | Missense_Mutation | c.698N>A | p.Pro233His | p.P233H | P22792 | protein_coding | deleterious(0.02) | benign(0.152) | TCGA-AA-3947-01 | Colorectum | colon adenocarcinoma | Female | <65 | I/II | Unknown | Unknown | SD | |
| CPN2 | SNV | Missense_Mutation | novel | c.505N>G | p.Thr169Ala | p.T169A | P22792 | protein_coding | tolerated(0.3) | benign(0.003) | TCGA-AZ-4315-01 | Colorectum | colon adenocarcinoma | Male | <65 | I/II | Unknown | Unknown | SD |
| CPN2 | SNV | Missense_Mutation | c.784G>A | p.Ala262Thr | p.A262T | P22792 | protein_coding | tolerated(0.25) | benign(0.009) | TCGA-CK-4951-01 | Colorectum | colon adenocarcinoma | Female | >=65 | I/II | Unknown | Unknown | PD |
| Page: 1 2 3 4 5 6 |
Top |
Related drugs of malignant transformation related genes |
| Identification of chemicals and drugs interact with genes involved in malignant transfromation |
| (DGIdb 4.0) |
| Entrez ID | Symbol | Category | Interaction Types | Drug Claim Name | Drug Name | PMIDs |
| Page: 1 |

Copyright 2023-Present -The University of Texas Health Science Center at Houston |