
|
|||||
|
 | |
| |
| |
| |
| |
| |
|
Gene: CPM |
Gene summary for CPM |
| Gene information | Species | Human | Gene symbol | CPM | Gene ID | 1368 |
| Gene name | carboxypeptidase M | |
| Gene Alias | CPM | |
| Cytomap | 12q15 | |
| Gene Type | protein-coding | GO ID | GO:0006508 | UniProtAcc | P14384 |
Top |
Malignant transformation analysis |
| Identification of the aberrant gene expression in precancerous and cancerous lesions by comparing the gene expression of stem-like cells in diseased tissues with normal stem cells |
| Entrez ID | Symbol | Replicates | Species | Organ | Tissue | Adj P-value | Log2FC | Malignancy |
| 1368 | CPM | HTA11_3410_2000001011 | Human | Colorectum | AD | 2.04e-04 | -4.37e-01 | 0.0155 |
| 1368 | CPM | HTA11_347_2000001011 | Human | Colorectum | AD | 1.96e-26 | 9.67e-01 | -0.1954 |
| 1368 | CPM | HTA11_411_2000001011 | Human | Colorectum | SER | 1.15e-04 | 8.93e-01 | -0.2602 |
| 1368 | CPM | HTA11_696_2000001011 | Human | Colorectum | AD | 9.46e-05 | 4.78e-01 | -0.1464 |
| 1368 | CPM | HTA11_866_3004761011 | Human | Colorectum | AD | 2.01e-03 | -4.24e-01 | 0.096 |
| 1368 | CPM | HTA11_7696_3000711011 | Human | Colorectum | AD | 3.47e-06 | -4.07e-01 | 0.0674 |
| 1368 | CPM | HTA11_99999970781_79442 | Human | Colorectum | MSS | 1.61e-09 | -4.90e-01 | 0.294 |
| 1368 | CPM | HTA11_99999965104_69814 | Human | Colorectum | MSS | 1.74e-02 | -4.97e-01 | 0.281 |
| 1368 | CPM | HTA11_99999971662_82457 | Human | Colorectum | MSS | 1.26e-06 | -4.16e-01 | 0.3859 |
| 1368 | CPM | HTA11_99999973899_84307 | Human | Colorectum | MSS | 1.83e-04 | -5.79e-01 | 0.2585 |
| 1368 | CPM | HTA11_99999974143_84620 | Human | Colorectum | MSS | 2.55e-16 | -5.47e-01 | 0.3005 |
| 1368 | CPM | F007 | Human | Colorectum | FAP | 2.57e-06 | -4.94e-01 | 0.1176 |
| 1368 | CPM | A002-C-010 | Human | Colorectum | FAP | 3.63e-08 | -4.18e-01 | 0.242 |
| 1368 | CPM | A001-C-207 | Human | Colorectum | FAP | 1.43e-05 | -4.53e-01 | 0.1278 |
| 1368 | CPM | A015-C-203 | Human | Colorectum | FAP | 3.12e-15 | -4.47e-01 | -0.1294 |
| 1368 | CPM | A015-C-204 | Human | Colorectum | FAP | 1.59e-05 | -4.35e-01 | -0.0228 |
| 1368 | CPM | A002-C-201 | Human | Colorectum | FAP | 6.92e-12 | -4.86e-01 | 0.0324 |
| 1368 | CPM | A002-C-203 | Human | Colorectum | FAP | 1.92e-14 | -4.70e-01 | 0.2786 |
| 1368 | CPM | A001-C-119 | Human | Colorectum | FAP | 1.89e-08 | -5.44e-01 | -0.1557 |
| 1368 | CPM | A001-C-108 | Human | Colorectum | FAP | 8.17e-18 | -5.50e-01 | -0.0272 |
| Page: 1 2 3 4 5 |
| Tissue | Expression Dynamics | Abbreviation |
| Colorectum (GSE201348) | 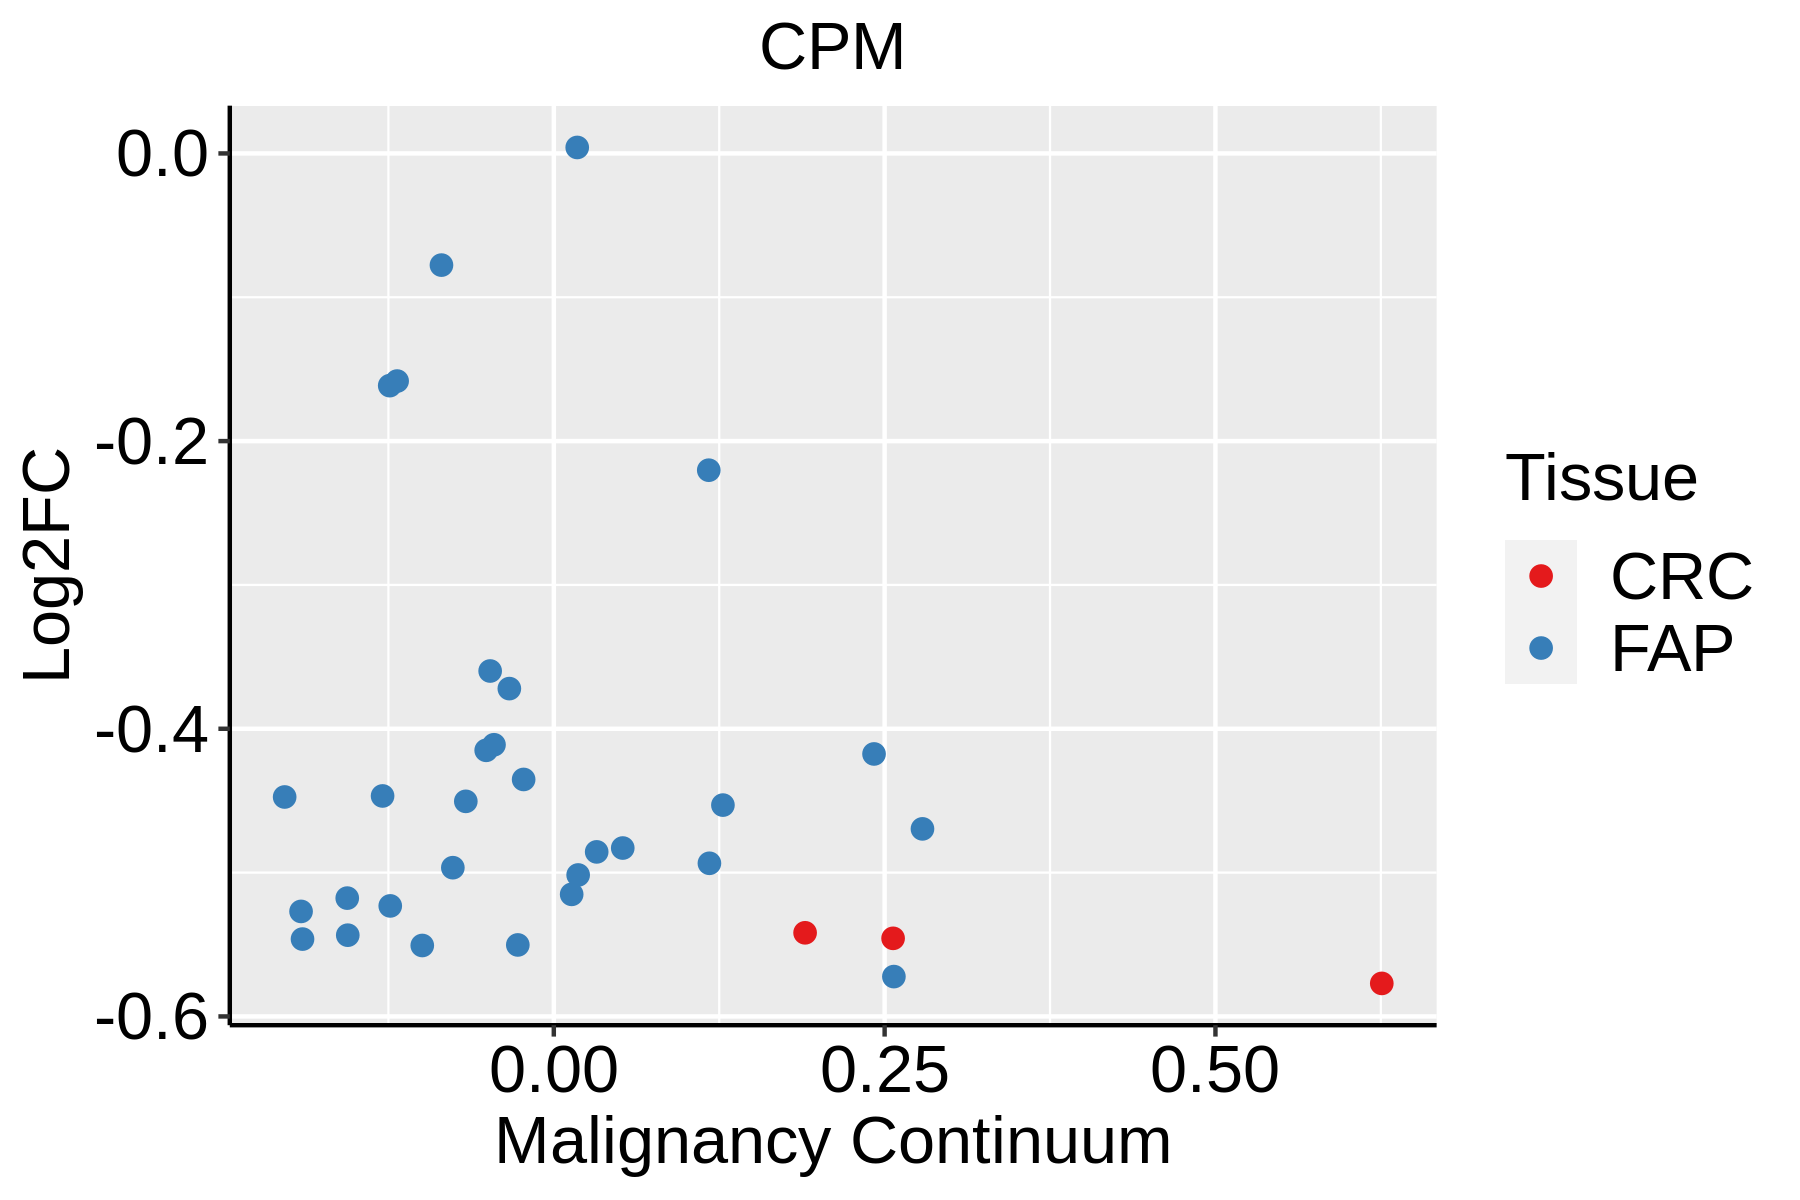 | FAP: Familial adenomatous polyposis |
| CRC: Colorectal cancer | ||
| Colorectum (HTA11) |  | AD: Adenomas |
| SER: Sessile serrated lesions | ||
| MSI-H: Microsatellite-high colorectal cancer | ||
| MSS: Microsatellite stable colorectal cancer | ||
| Endometrium |  | AEH: Atypical endometrial hyperplasia |
| EEC: Endometrioid Cancer | ||
| Esophagus | 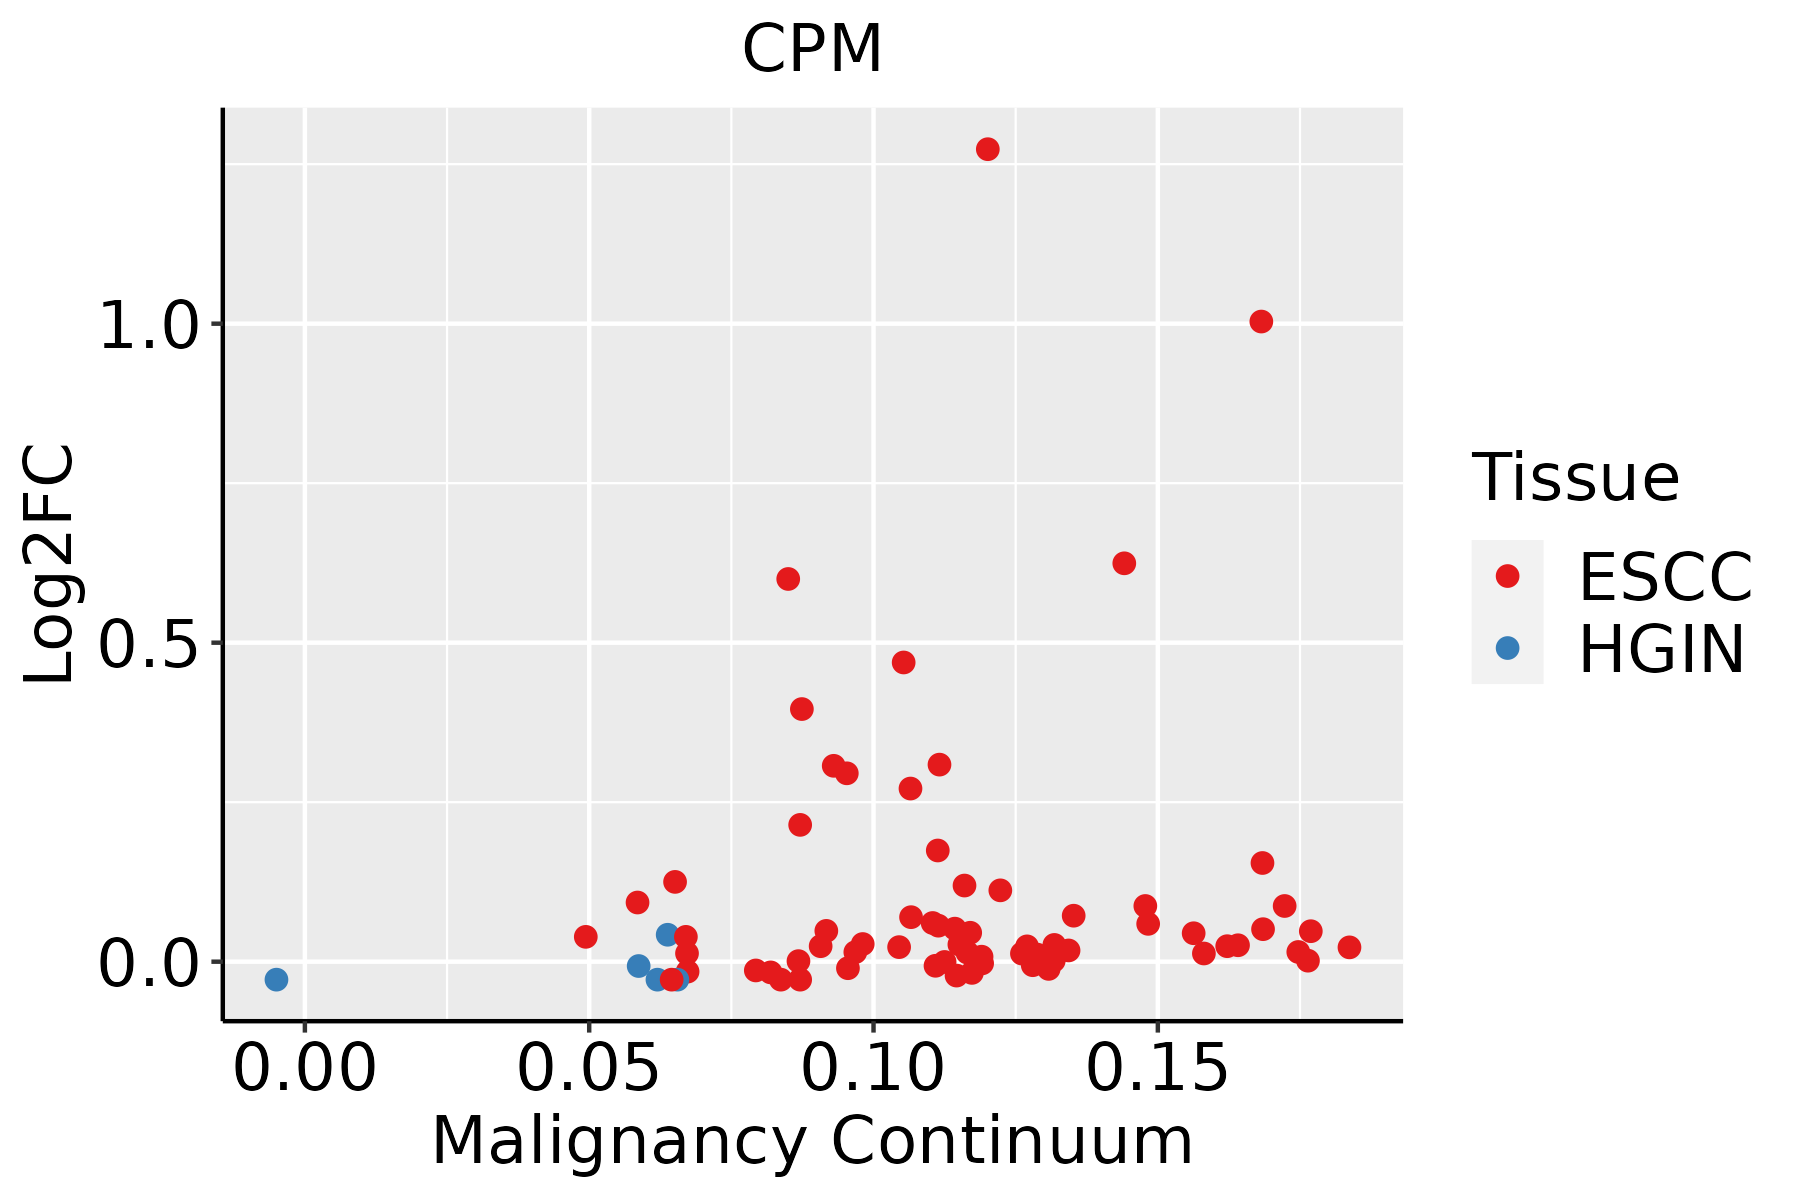 | ESCC: Esophageal squamous cell carcinoma |
| HGIN: High-grade intraepithelial neoplasias | ||
| LGIN: Low-grade intraepithelial neoplasias | ||
| Liver | 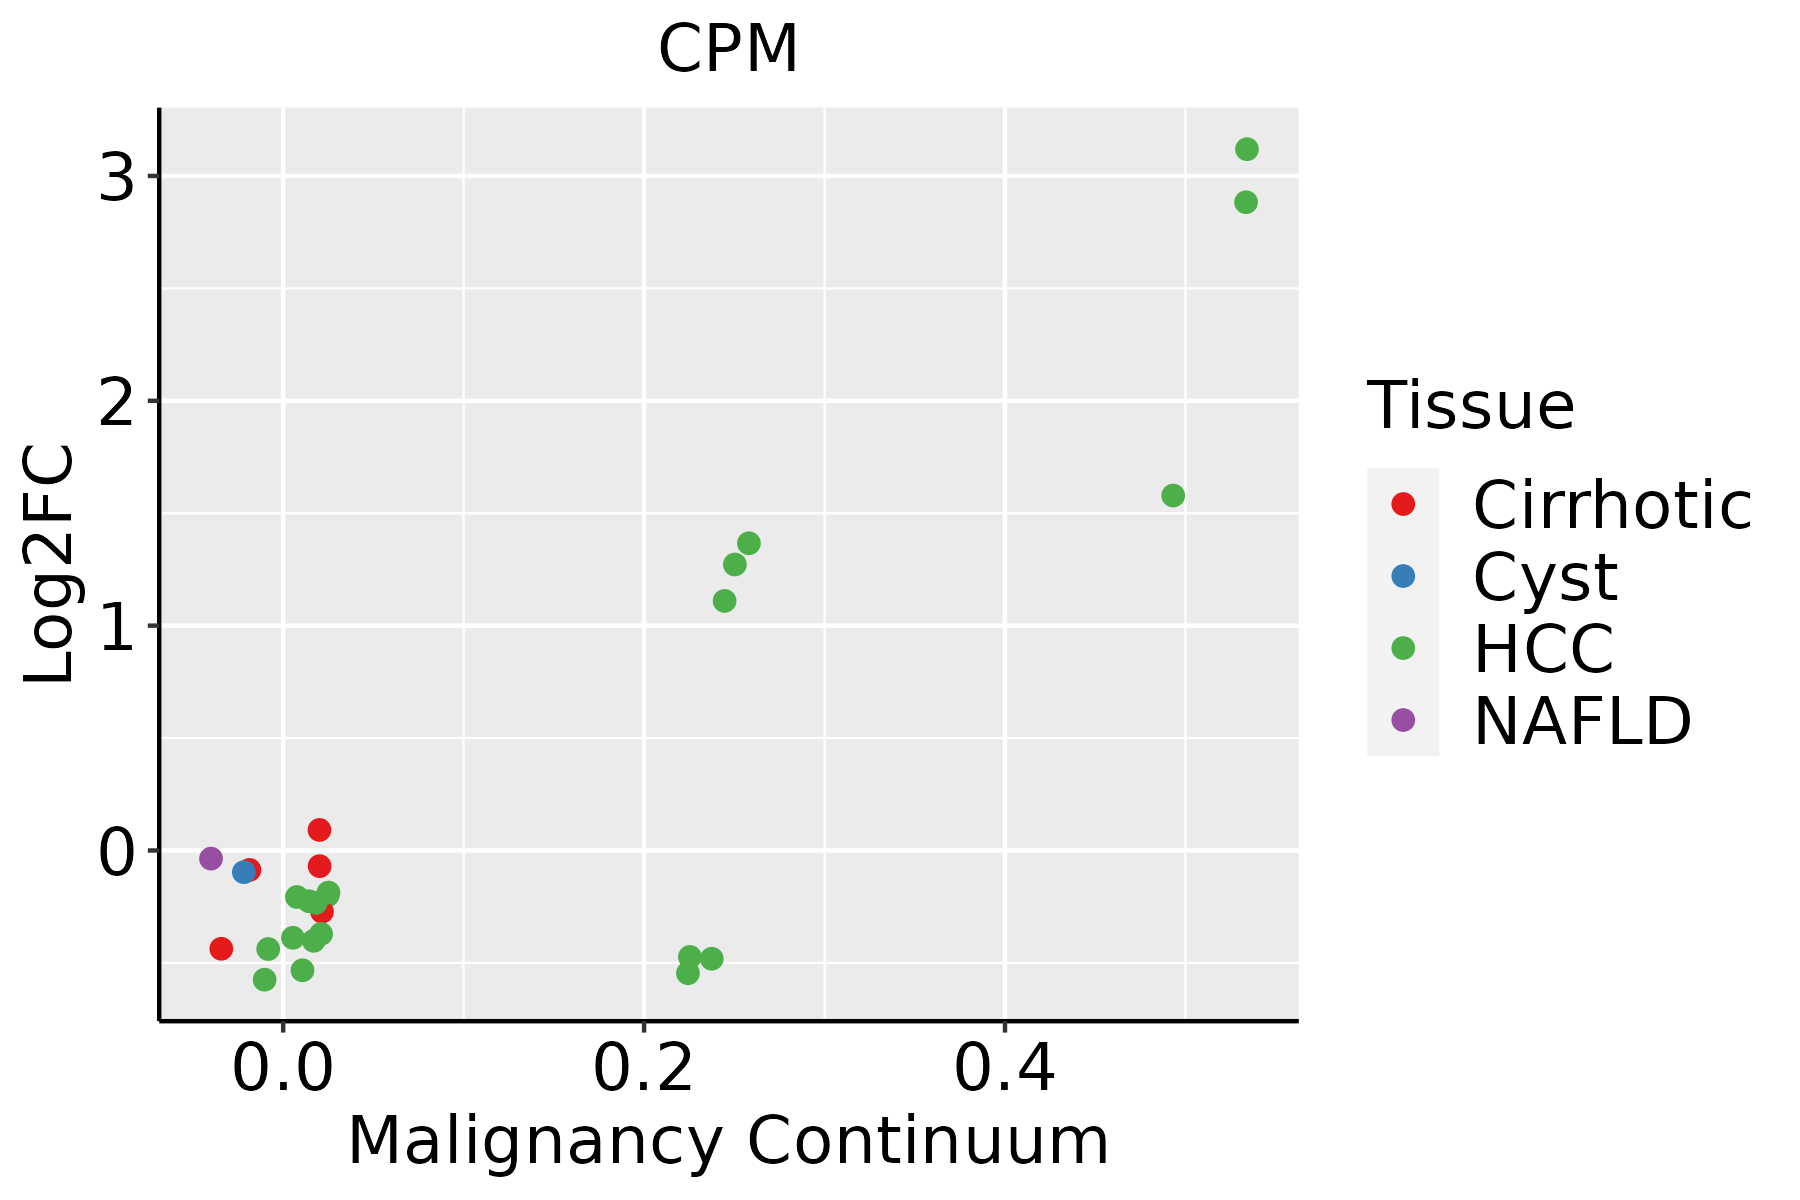 | HCC: Hepatocellular carcinoma |
| NAFLD: Non-alcoholic fatty liver disease | ||
| Lung | 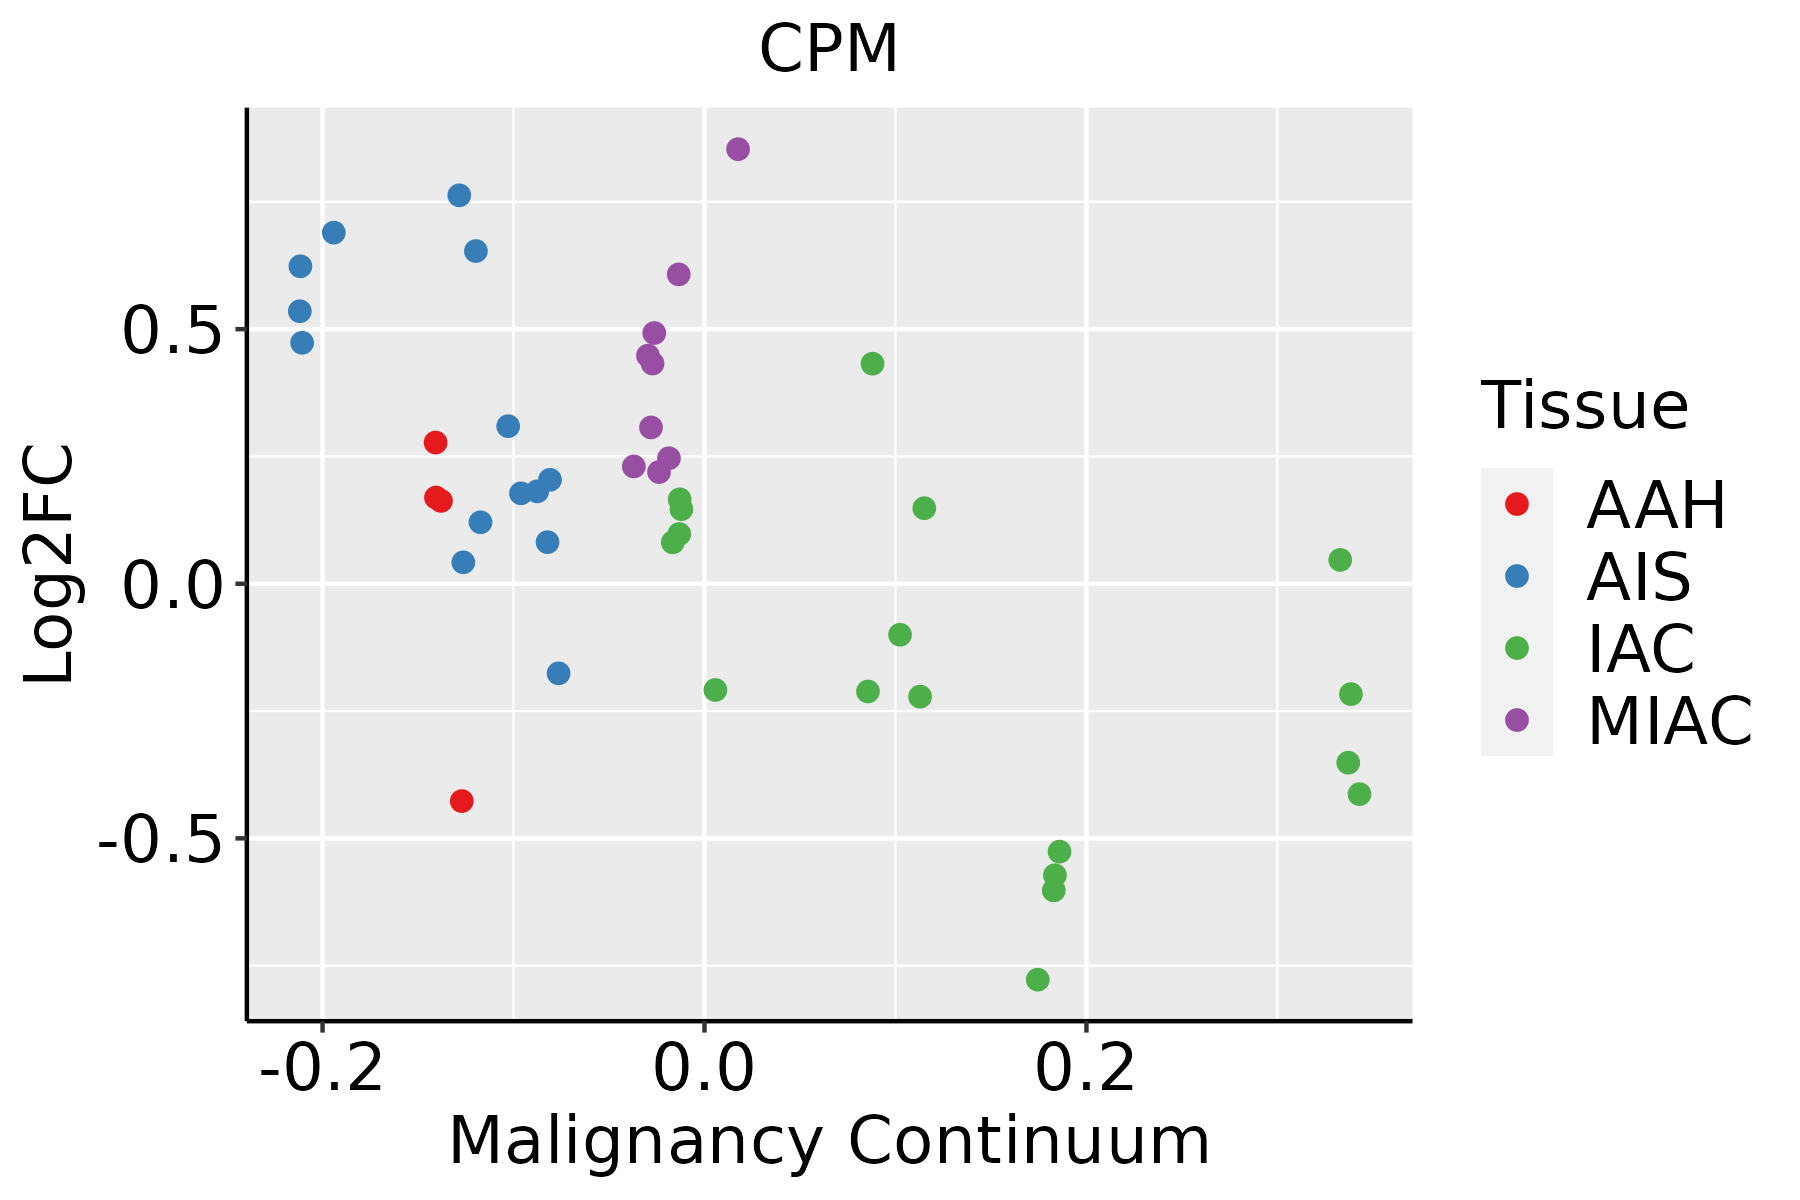 | AAH: Atypical adenomatous hyperplasia |
| AIS: Adenocarcinoma in situ | ||
| IAC: Invasive lung adenocarcinoma | ||
| MIA: Minimally invasive adenocarcinoma |
| ∗log2FC in expression of this searched gene in stem-like cells from each diseased tissue sample relative to stem-like cells in normal samples in each tissue plotted against the malignancy continuum. Samples are colored based on if they are from different disease stage. |
Top |
Malignant transformation related pathway analysis |
| Find out the enriched GO biological processes and KEGG pathways involved in transition from healthy to precancer to cancer |
| Tissue | Disease Stage | Enriched GO biological Processes |
| Colorectum | AD |  |
| Colorectum | SER |  |
| Colorectum | MSS |  |
| Colorectum | MSI-H |  |
| Colorectum | FAP |  |
| ∗Top 15 enriched GO BP terms are showed in the bar plot of each disease state in each tissue. Each row represents a significant GO biological process which is colored according to the -log10(p.adjust). |
| Page: 1 2 3 4 5 6 7 8 9 |
| GO ID | Tissue | Disease Stage | Description | Gene Ratio | Bg Ratio | pvalue | p.adjust | Count |
| GO:0051604 | Colorectum | AD | protein maturation | 85/3918 | 294/18723 | 6.73e-04 | 6.91e-03 | 85 |
| GO:0016485 | Colorectum | AD | protein processing | 63/3918 | 225/18723 | 6.77e-03 | 4.19e-02 | 63 |
| GO:00516041 | Colorectum | SER | protein maturation | 73/2897 | 294/18723 | 1.82e-05 | 5.38e-04 | 73 |
| GO:00164851 | Colorectum | SER | protein processing | 55/2897 | 225/18723 | 2.84e-04 | 4.67e-03 | 55 |
| GO:00516042 | Colorectum | MSS | protein maturation | 75/3467 | 294/18723 | 1.70e-03 | 1.53e-02 | 75 |
| GO:00164852 | Colorectum | MSS | protein processing | 57/3467 | 225/18723 | 6.60e-03 | 4.38e-02 | 57 |
| GO:00516044 | Colorectum | CRC | protein maturation | 47/2078 | 294/18723 | 6.52e-03 | 4.70e-02 | 47 |
| GO:005160418 | Esophagus | ESCC | protein maturation | 189/8552 | 294/18723 | 7.64e-11 | 2.39e-09 | 189 |
| GO:001648514 | Esophagus | ESCC | protein processing | 134/8552 | 225/18723 | 1.81e-05 | 1.60e-04 | 134 |
| GO:00516046 | Liver | Cirrhotic | protein maturation | 121/4634 | 294/18723 | 3.54e-10 | 1.68e-08 | 121 |
| GO:00164853 | Liver | Cirrhotic | protein processing | 85/4634 | 225/18723 | 9.01e-06 | 1.32e-04 | 85 |
| GO:005160412 | Liver | HCC | protein maturation | 171/7958 | 294/18723 | 3.80e-08 | 8.30e-07 | 171 |
| GO:001648511 | Liver | HCC | protein processing | 121/7958 | 225/18723 | 4.01e-04 | 2.71e-03 | 121 |
| Page: 1 |
| Pathway ID | Tissue | Disease Stage | Description | Gene Ratio | Bg Ratio | pvalue | p.adjust | qvalue | Count |
| Page: 1 |
Top |
Cell-cell communication analysis |
| Identification of potential cell-cell interactions between two cell types and their ligand-receptor pairs for different disease states |
| Ligand | Receptor | LRpair | Pathway | Tissue | Disease Stage |
| Page: 1 |
Top |
Single-cell gene regulatory network inference analysis |
| Find out the significant the regulons (TFs) and the target genes of each regulon across cell types for different disease states |
| TF | Cell Type | Tissue | Disease Stage | Target Gene | RSS | Regulon Activity |
| ∗The dot plots of a searched regulon are shown for all cell subpopulations in each disease state of each tissue based on the regulon specific score inferred using pySCENIC and by calculating the average expression. |
| Page: 1 |
Top |
Somatic mutation of malignant transformation related genes |
| Annotation of somatic variants for genes involved in malignant transformation |
| Hugo Symbol | Variant Class | Variant Classification | dbSNP RS | HGVSc | HGVSp | HGVSp Short | SWISSPROT | BIOTYPE | SIFT | PolyPhen | Tumor Sample Barcode | Tissue | Histology | Sex | Age | Stage | Therapy Types | Drugs | Outcome |
| CPM | SNV | Missense_Mutation | c.925N>G | p.Lys309Glu | p.K309E | P14384 | protein_coding | tolerated(0.23) | benign(0.015) | TCGA-BH-A0H9-01 | Breast | breast invasive carcinoma | Female | >=65 | I/II | Hormone Therapy | arimidex | SD | |
| CPM | SNV | Missense_Mutation | rs779537699 | c.774N>T | p.Trp258Cys | p.W258C | P14384 | protein_coding | deleterious(0) | probably_damaging(1) | TCGA-C8-A1HO-01 | Breast | breast invasive carcinoma | Female | <65 | III/IV | Chemotherapy | 5-fluorouracil | CR |
| CPM | SNV | Missense_Mutation | rs547105880 | c.301N>A | p.Val101Ile | p.V101I | P14384 | protein_coding | tolerated(0.09) | benign(0.214) | TCGA-E2-A15L-01 | Breast | breast invasive carcinoma | Female | >=65 | I/II | Hormone Therapy | arimidex | SD |
| CPM | deletion | Frame_Shift_Del | c.132delN | p.Leu45TyrfsTer8 | p.L45Yfs*8 | P14384 | protein_coding | TCGA-EW-A2FV-01 | Breast | breast invasive carcinoma | Female | <65 | III/IV | Chemotherapy | docetaxel | SD | |||
| CPM | SNV | Missense_Mutation | c.1010N>T | p.Arg337Ile | p.R337I | P14384 | protein_coding | tolerated(0.24) | probably_damaging(0.947) | TCGA-DS-A1OB-01 | Cervix | cervical & endocervical cancer | Female | <65 | I/II | Chemotherapy | carboplatin | PD | |
| CPM | SNV | Missense_Mutation | novel | c.4G>C | p.Asp2His | p.D2H | P14384 | protein_coding | deleterious_low_confidence(0) | probably_damaging(0.94) | TCGA-VS-A953-01 | Cervix | cervical & endocervical cancer | Female | <65 | I/II | Unknown | Unknown | PD |
| CPM | SNV | Missense_Mutation | c.821N>G | p.Gln274Arg | p.Q274R | P14384 | protein_coding | tolerated(0.06) | possibly_damaging(0.736) | TCGA-AA-3715-01 | Colorectum | colon adenocarcinoma | Male | >=65 | I/II | Unknown | Unknown | PD | |
| CPM | SNV | Missense_Mutation | rs538250941 | c.865N>T | p.Arg289Cys | p.R289C | P14384 | protein_coding | tolerated(0.17) | possibly_damaging(0.695) | TCGA-WS-AB45-01 | Colorectum | colon adenocarcinoma | Female | <65 | I/II | Unknown | Unknown | SD |
| CPM | SNV | Missense_Mutation | rs200496918 | c.461N>A | p.Arg154Gln | p.R154Q | P14384 | protein_coding | deleterious(0) | probably_damaging(0.985) | TCGA-AG-A002-01 | Colorectum | rectum adenocarcinoma | Male | <65 | I/II | Unknown | Unknown | SD |
| CPM | SNV | Missense_Mutation | c.1205C>A | p.Ser402Tyr | p.S402Y | P14384 | protein_coding | deleterious(0.02) | benign(0.086) | TCGA-EI-6917-01 | Colorectum | rectum adenocarcinoma | Male | <65 | III/IV | Chemotherapy | 5fluorouracil+oxaciplatina+l-folinian | SD |
| Page: 1 2 3 4 5 |
Top |
Related drugs of malignant transformation related genes |
| Identification of chemicals and drugs interact with genes involved in malignant transfromation |
| (DGIdb 4.0) |
| Entrez ID | Symbol | Category | Interaction Types | Drug Claim Name | Drug Name | PMIDs |
| 1368 | CPM | PROTEASE, DRUGGABLE GENOME, CELL SURFACE, ENZYME | inhibitor | 252166875 |
| Page: 1 |

Copyright 2023-Present -The University of Texas Health Science Center at Houston |