
|
|||||
|
 | |
| |
| |
| |
| |
| |
|
Gene: CPLX2 |
Gene summary for CPLX2 |
| Gene information | Species | Human | Gene symbol | CPLX2 | Gene ID | 10814 |
| Gene name | complexin 2 | |
| Gene Alias | 921-L | |
| Cytomap | 5q35.2 | |
| Gene Type | protein-coding | GO ID | GO:0001505 | UniProtAcc | Q6PUV4 |
Top |
Malignant transformation analysis |
| Identification of the aberrant gene expression in precancerous and cancerous lesions by comparing the gene expression of stem-like cells in diseased tissues with normal stem cells |
| Entrez ID | Symbol | Replicates | Species | Organ | Tissue | Adj P-value | Log2FC | Malignancy |
| 10814 | CPLX2 | HCC1 | Human | Liver | HCC | 9.85e-15 | 5.19e+00 | 0.5336 |
| 10814 | CPLX2 | HCC2 | Human | Liver | HCC | 2.51e-23 | 3.20e+00 | 0.5341 |
| 10814 | CPLX2 | S014 | Human | Liver | HCC | 9.97e-44 | 1.78e+00 | 0.2254 |
| 10814 | CPLX2 | S015 | Human | Liver | HCC | 3.28e-44 | 2.47e+00 | 0.2375 |
| 10814 | CPLX2 | S016 | Human | Liver | HCC | 1.55e-66 | 2.05e+00 | 0.2243 |
| Page: 1 |
| Tissue | Expression Dynamics | Abbreviation |
| Liver | 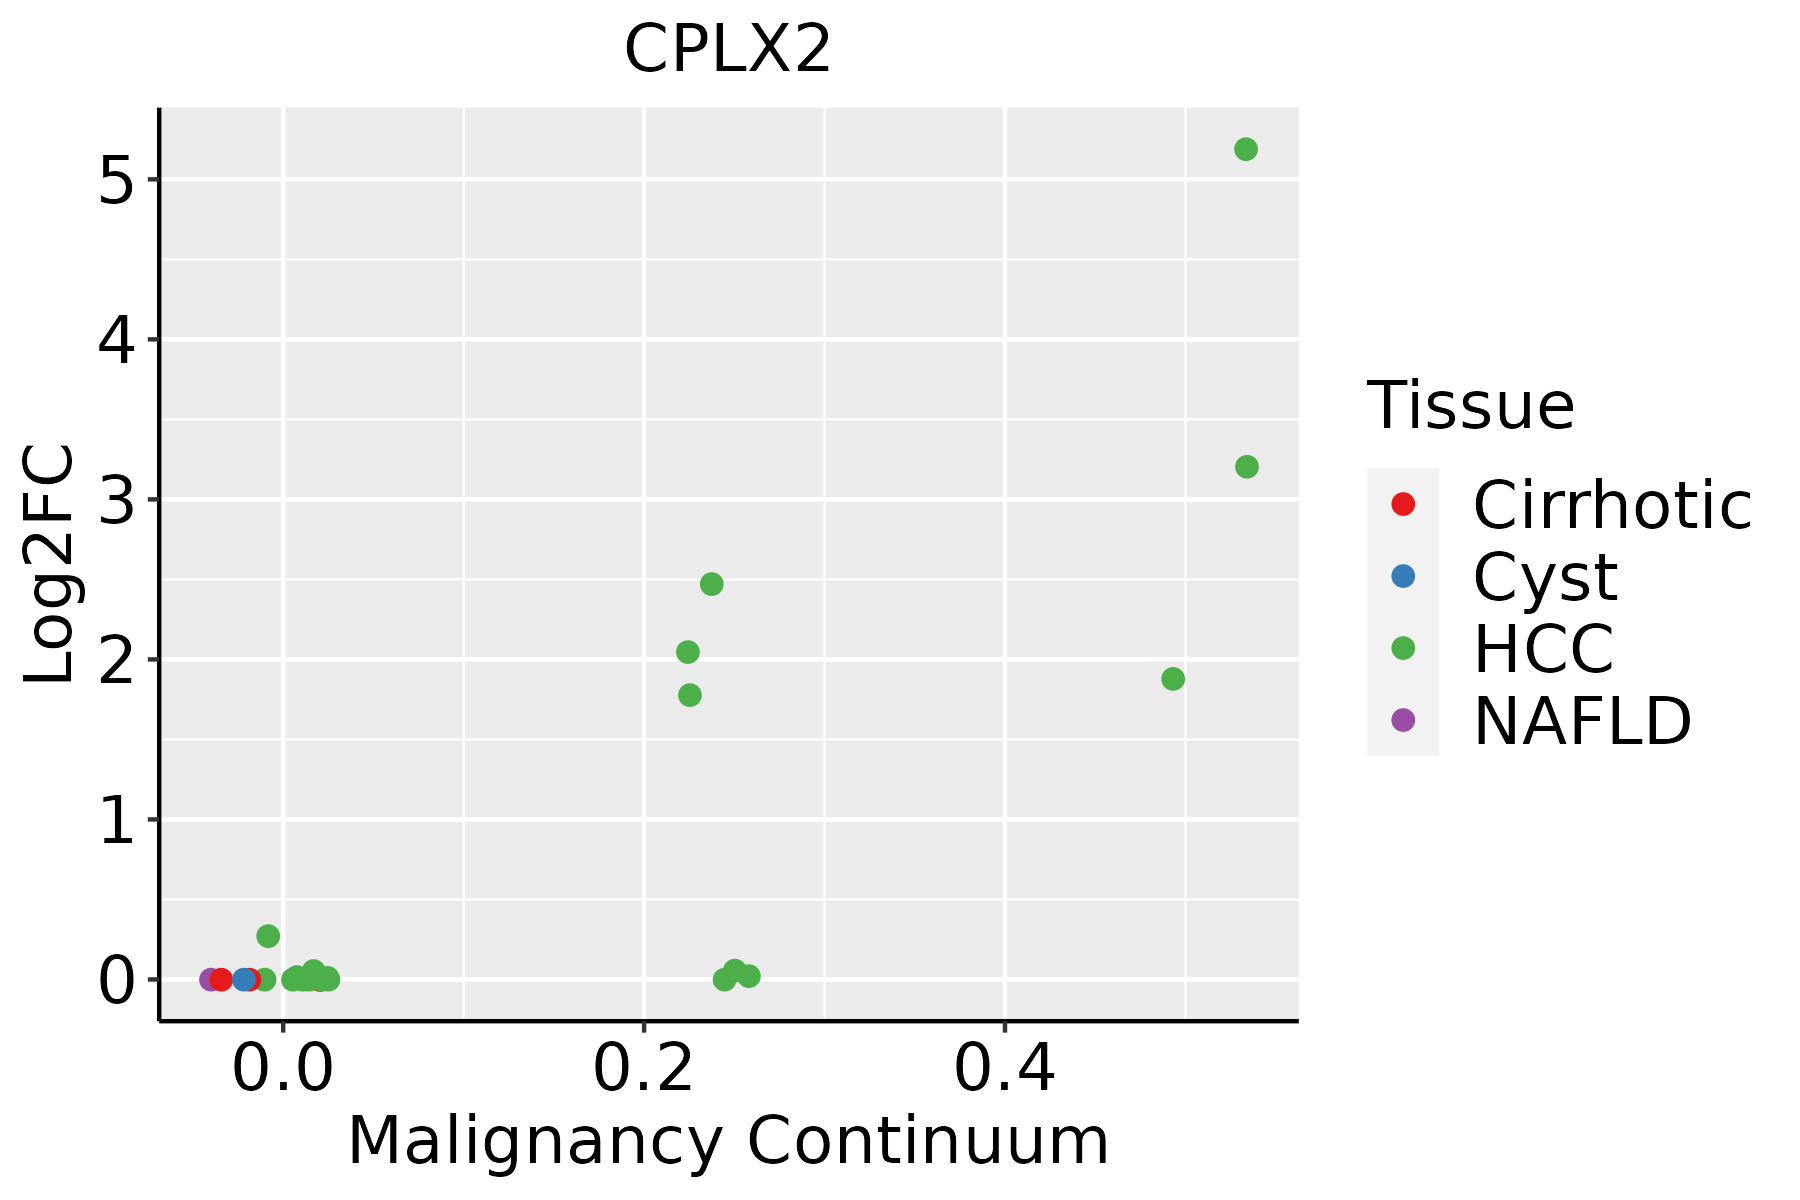 | HCC: Hepatocellular carcinoma |
| NAFLD: Non-alcoholic fatty liver disease |
| ∗log2FC in expression of this searched gene in stem-like cells from each diseased tissue sample relative to stem-like cells in normal samples in each tissue plotted against the malignancy continuum. Samples are colored based on if they are from different disease stage. |
Top |
Malignant transformation related pathway analysis |
| Find out the enriched GO biological processes and KEGG pathways involved in transition from healthy to precancer to cancer |
| Tissue | Disease Stage | Enriched GO biological Processes |
| Colorectum | AD |  |
| Colorectum | SER |  |
| Colorectum | MSS |  |
| Colorectum | MSI-H |  |
| Colorectum | FAP |  |
| ∗Top 15 enriched GO BP terms are showed in the bar plot of each disease state in each tissue. Each row represents a significant GO biological process which is colored according to the -log10(p.adjust). |
| Page: 1 2 3 4 5 6 7 8 9 |
| GO ID | Tissue | Disease Stage | Description | Gene Ratio | Bg Ratio | pvalue | p.adjust | Count |
| GO:001605021 | Liver | HCC | vesicle organization | 194/7958 | 300/18723 | 5.58e-15 | 3.97e-13 | 194 |
| GO:005165621 | Liver | HCC | establishment of organelle localization | 226/7958 | 390/18723 | 4.15e-10 | 1.34e-08 | 226 |
| GO:002240611 | Liver | HCC | membrane docking | 57/7958 | 86/18723 | 7.14e-06 | 8.47e-05 | 57 |
| GO:004828411 | Liver | HCC | organelle fusion | 84/7958 | 141/18723 | 3.13e-05 | 3.20e-04 | 84 |
| GO:014005611 | Liver | HCC | organelle localization by membrane tethering | 49/7958 | 77/18723 | 1.46e-04 | 1.18e-03 | 49 |
| GO:00901741 | Liver | HCC | organelle membrane fusion | 63/7958 | 110/18723 | 1.24e-03 | 6.85e-03 | 63 |
| GO:00069061 | Liver | HCC | vesicle fusion | 61/7958 | 106/18723 | 1.25e-03 | 6.90e-03 | 61 |
| GO:0061025 | Liver | HCC | membrane fusion | 88/7958 | 163/18723 | 1.98e-03 | 1.00e-02 | 88 |
| GO:0048278 | Liver | HCC | vesicle docking | 34/7958 | 59/18723 | 1.36e-02 | 4.84e-02 | 34 |
| Page: 1 |
| Pathway ID | Tissue | Disease Stage | Description | Gene Ratio | Bg Ratio | pvalue | p.adjust | qvalue | Count |
| Page: 1 |
Top |
Cell-cell communication analysis |
| Identification of potential cell-cell interactions between two cell types and their ligand-receptor pairs for different disease states |
| Ligand | Receptor | LRpair | Pathway | Tissue | Disease Stage |
| Page: 1 |
Top |
Single-cell gene regulatory network inference analysis |
| Find out the significant the regulons (TFs) and the target genes of each regulon across cell types for different disease states |
| TF | Cell Type | Tissue | Disease Stage | Target Gene | RSS | Regulon Activity |
| ∗The dot plots of a searched regulon are shown for all cell subpopulations in each disease state of each tissue based on the regulon specific score inferred using pySCENIC and by calculating the average expression. |
| Page: 1 |
Top |
Somatic mutation of malignant transformation related genes |
| Annotation of somatic variants for genes involved in malignant transformation |
| Hugo Symbol | Variant Class | Variant Classification | dbSNP RS | HGVSc | HGVSp | HGVSp Short | SWISSPROT | BIOTYPE | SIFT | PolyPhen | Tumor Sample Barcode | Tissue | Histology | Sex | Age | Stage | Therapy Types | Drugs | Outcome |
| CPLX2 | SNV | Missense_Mutation | novel | c.247A>G | p.Lys83Glu | p.K83E | Q6PUV4 | protein_coding | tolerated(0.79) | benign(0.061) | TCGA-2W-A8YY-01 | Cervix | cervical & endocervical cancer | Female | <65 | I/II | Chemotherapy | cisplatin | CR |
| CPLX2 | SNV | Missense_Mutation | c.158C>T | p.Ala53Val | p.A53V | Q6PUV4 | protein_coding | tolerated(0.15) | probably_damaging(0.984) | TCGA-AZ-6598-01 | Colorectum | colon adenocarcinoma | Female | >=65 | I/II | Unknown | Unknown | SD | |
| CPLX2 | insertion | In_Frame_Ins | novel | c.165_166insTCCTTT | p.Met55_Glu56insSerPhe | p.M55_E56insSF | Q6PUV4 | protein_coding | TCGA-AM-5820-01 | Colorectum | colon adenocarcinoma | Female | <65 | I/II | Unknown | Unknown | SD | ||
| CPLX2 | SNV | Missense_Mutation | novel | c.356N>T | p.Thr119Met | p.T119M | Q6PUV4 | protein_coding | deleterious_low_confidence(0) | possibly_damaging(0.871) | TCGA-A5-A0G2-01 | Endometrium | uterine corpus endometrioid carcinoma | Female | <65 | III/IV | Unknown | Unknown | SD |
| CPLX2 | SNV | Missense_Mutation | novel | c.251N>T | p.Ala84Val | p.A84V | Q6PUV4 | protein_coding | deleterious(0.04) | benign(0.183) | TCGA-AJ-A2QO-01 | Endometrium | uterine corpus endometrioid carcinoma | Female | >=65 | I/II | Unknown | Unknown | SD |
| CPLX2 | SNV | Missense_Mutation | rs757770941 | c.316G>A | p.Gly106Arg | p.G106R | Q6PUV4 | protein_coding | deleterious(0) | benign(0.022) | TCGA-B5-A3FA-01 | Endometrium | uterine corpus endometrioid carcinoma | Female | >=65 | I/II | Unknown | Unknown | SD |
| CPLX2 | SNV | Missense_Mutation | rs772923966 | c.271N>A | p.Glu91Lys | p.E91K | Q6PUV4 | protein_coding | deleterious(0.01) | probably_damaging(0.974) | TCGA-BK-A6W3-01 | Endometrium | uterine corpus endometrioid carcinoma | Female | <65 | I/II | Unknown | Unknown | SD |
| CPLX2 | SNV | Missense_Mutation | c.286N>G | p.Arg96Gly | p.R96G | Q6PUV4 | protein_coding | tolerated(0.17) | probably_damaging(0.982) | TCGA-05-4410-01 | Lung | lung adenocarcinoma | Male | <65 | I/II | Unknown | Unknown | SD | |
| CPLX2 | SNV | Missense_Mutation | novel | c.161G>C | p.Arg54Pro | p.R54P | Q6PUV4 | protein_coding | deleterious(0) | possibly_damaging(0.447) | TCGA-44-5644-01 | Lung | lung adenocarcinoma | Female | <65 | I/II | Unknown | Unknown | SD |
| CPLX2 | SNV | Missense_Mutation | c.262C>A | p.Gln88Lys | p.Q88K | Q6PUV4 | protein_coding | tolerated(0.68) | benign(0.049) | TCGA-75-5126-01 | Lung | lung adenocarcinoma | Female | Unknown | III/IV | Unknown | Unknown | SD |
| Page: 1 2 |
Top |
Related drugs of malignant transformation related genes |
| Identification of chemicals and drugs interact with genes involved in malignant transfromation |
| (DGIdb 4.0) |
| Entrez ID | Symbol | Category | Interaction Types | Drug Claim Name | Drug Name | PMIDs |
| Page: 1 |

Copyright 2023-Present -The University of Texas Health Science Center at Houston |