
|
|||||
|
 | |
| |
| |
| |
| |
| |
|
Gene: CPED1 |
Gene summary for CPED1 |
| Gene information | Species | Human | Gene symbol | CPED1 | Gene ID | 79974 |
| Gene name | cadherin like and PC-esterase domain containing 1 | |
| Gene Alias | C7orf58 | |
| Cytomap | 7q31.31 | |
| Gene Type | protein-coding | GO ID | GO:0005575 | UniProtAcc | A4D0V7 |
Top |
Malignant transformation analysis |
| Identification of the aberrant gene expression in precancerous and cancerous lesions by comparing the gene expression of stem-like cells in diseased tissues with normal stem cells |
| Entrez ID | Symbol | Replicates | Species | Organ | Tissue | Adj P-value | Log2FC | Malignancy |
| 79974 | CPED1 | NAFLD1 | Human | Liver | NAFLD | 6.82e-09 | 1.05e+00 | -0.04 |
| 79974 | CPED1 | S41 | Human | Liver | Cirrhotic | 1.29e-06 | 7.24e-01 | -0.0343 |
| 79974 | CPED1 | HCC1_Meng | Human | Liver | HCC | 5.12e-11 | -3.00e-01 | 0.0246 |
| 79974 | CPED1 | HCC2_Meng | Human | Liver | HCC | 8.63e-08 | -3.00e-01 | 0.0107 |
| 79974 | CPED1 | cirrhotic1 | Human | Liver | Cirrhotic | 3.91e-06 | -2.76e-01 | 0.0202 |
| 79974 | CPED1 | cirrhotic2 | Human | Liver | Cirrhotic | 5.29e-05 | -2.71e-01 | 0.0201 |
| 79974 | CPED1 | HCC5 | Human | Liver | HCC | 3.97e-02 | -1.01e-02 | 0.4932 |
| 79974 | CPED1 | Pt13.a | Human | Liver | HCC | 7.34e-07 | -2.89e-01 | 0.021 |
| 79974 | CPED1 | Pt13.b | Human | Liver | HCC | 3.30e-02 | -2.65e-01 | 0.0251 |
| 79974 | CPED1 | Pt14.d | Human | Liver | HCC | 2.64e-04 | -2.24e-01 | 0.0143 |
| 79974 | CPED1 | ATC12 | Human | Thyroid | ATC | 5.85e-06 | 1.41e-01 | 0.34 |
| 79974 | CPED1 | ATC13 | Human | Thyroid | ATC | 6.92e-24 | 4.61e-01 | 0.34 |
| 79974 | CPED1 | ATC2 | Human | Thyroid | ATC | 2.94e-10 | 9.95e-01 | 0.34 |
| 79974 | CPED1 | ATC4 | Human | Thyroid | ATC | 6.35e-09 | 1.93e-01 | 0.34 |
| 79974 | CPED1 | ATC5 | Human | Thyroid | ATC | 2.90e-24 | 4.85e-01 | 0.34 |
| Page: 1 |
| Tissue | Expression Dynamics | Abbreviation |
| Liver |  | HCC: Hepatocellular carcinoma |
| NAFLD: Non-alcoholic fatty liver disease | ||
| Thyroid | 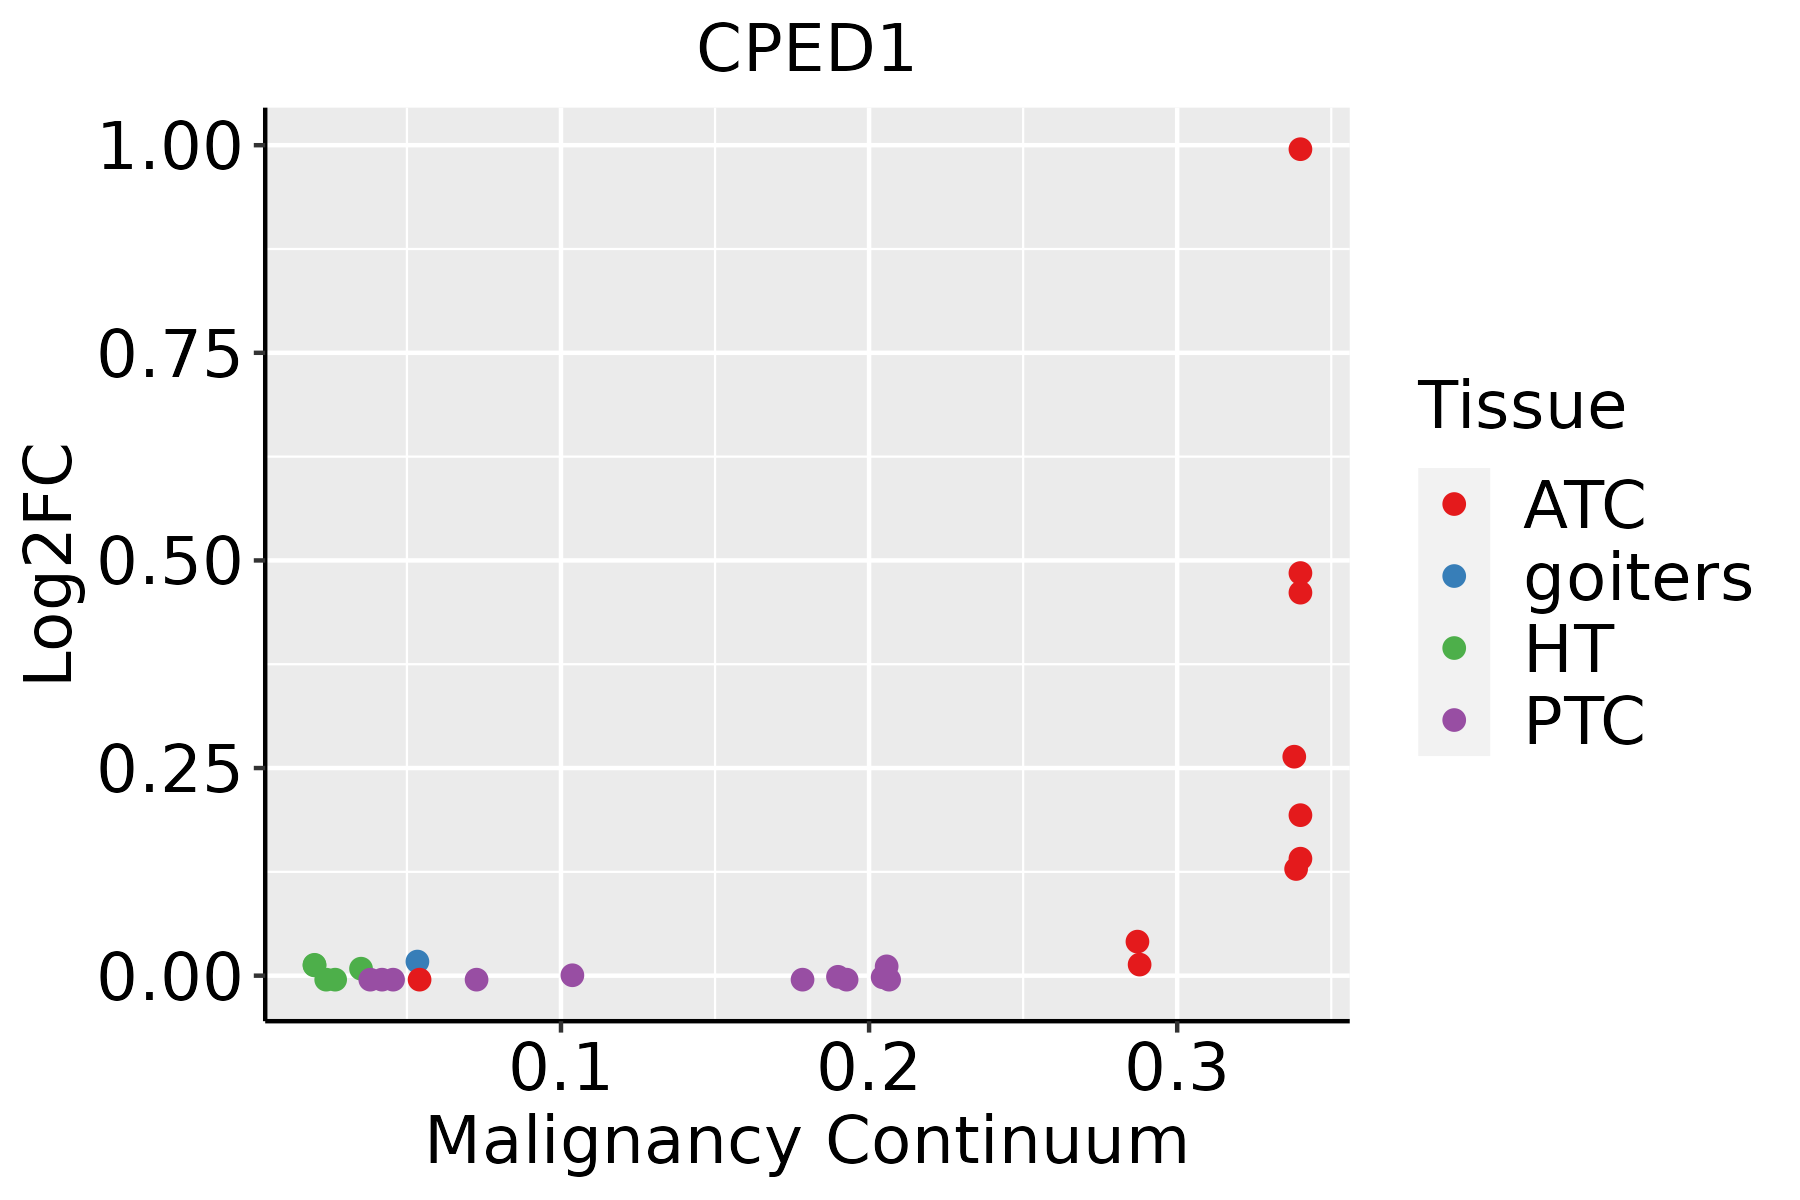 | ATC: Anaplastic thyroid cancer |
| HT: Hashimoto's thyroiditis | ||
| PTC: Papillary thyroid cancer |
| ∗log2FC in expression of this searched gene in stem-like cells from each diseased tissue sample relative to stem-like cells in normal samples in each tissue plotted against the malignancy continuum. Samples are colored based on if they are from different disease stage. |
Top |
Malignant transformation related pathway analysis |
| Find out the enriched GO biological processes and KEGG pathways involved in transition from healthy to precancer to cancer |
| Tissue | Disease Stage | Enriched GO biological Processes |
| Colorectum | AD |  |
| Colorectum | SER |  |
| Colorectum | MSS |  |
| Colorectum | MSI-H |  |
| Colorectum | FAP |  |
| ∗Top 15 enriched GO BP terms are showed in the bar plot of each disease state in each tissue. Each row represents a significant GO biological process which is colored according to the -log10(p.adjust). |
| Page: 1 2 3 4 5 6 7 8 9 |
| GO ID | Tissue | Disease Stage | Description | Gene Ratio | Bg Ratio | pvalue | p.adjust | Count |
| Page: 1 |
| Pathway ID | Tissue | Disease Stage | Description | Gene Ratio | Bg Ratio | pvalue | p.adjust | qvalue | Count |
| Page: 1 |
Top |
Cell-cell communication analysis |
| Identification of potential cell-cell interactions between two cell types and their ligand-receptor pairs for different disease states |
| Ligand | Receptor | LRpair | Pathway | Tissue | Disease Stage |
| Page: 1 |
Top |
Single-cell gene regulatory network inference analysis |
| Find out the significant the regulons (TFs) and the target genes of each regulon across cell types for different disease states |
| TF | Cell Type | Tissue | Disease Stage | Target Gene | RSS | Regulon Activity |
| ∗The dot plots of a searched regulon are shown for all cell subpopulations in each disease state of each tissue based on the regulon specific score inferred using pySCENIC and by calculating the average expression. |
| Page: 1 |
Top |
Somatic mutation of malignant transformation related genes |
| Annotation of somatic variants for genes involved in malignant transformation |
| Hugo Symbol | Variant Class | Variant Classification | dbSNP RS | HGVSc | HGVSp | HGVSp Short | SWISSPROT | BIOTYPE | SIFT | PolyPhen | Tumor Sample Barcode | Tissue | Histology | Sex | Age | Stage | Therapy Types | Drugs | Outcome |
| CPED1 | SNV | Missense_Mutation | c.1916N>G | p.Met639Arg | p.M639R | A4D0V7 | protein_coding | tolerated(0.06) | benign(0.378) | TCGA-A2-A0SW-01 | Breast | breast invasive carcinoma | Female | >=65 | III/IV | Hormone Therapy | arimidex | PD | |
| CPED1 | SNV | Missense_Mutation | rs187314481 | c.791G>A | p.Arg264Gln | p.R264Q | A4D0V7 | protein_coding | tolerated(0.2) | benign(0.005) | TCGA-AN-A046-01 | Breast | breast invasive carcinoma | Female | >=65 | I/II | Unknown | Unknown | SD |
| CPED1 | SNV | Missense_Mutation | c.655C>A | p.Gln219Lys | p.Q219K | A4D0V7 | protein_coding | deleterious(0.01) | benign(0.057) | TCGA-B6-A0I8-01 | Breast | breast invasive carcinoma | Female | <65 | I/II | Unknown | Unknown | PD | |
| CPED1 | SNV | Missense_Mutation | c.2063N>C | p.Gly688Ala | p.G688A | A4D0V7 | protein_coding | deleterious(0) | possibly_damaging(0.448) | TCGA-BH-A0AW-01 | Breast | breast invasive carcinoma | Female | <65 | I/II | Chemotherapy | carboplatin | SD | |
| CPED1 | SNV | Missense_Mutation | c.337C>G | p.Gln113Glu | p.Q113E | A4D0V7 | protein_coding | deleterious(0.04) | benign(0.001) | TCGA-C8-A27B-01 | Breast | breast invasive carcinoma | Female | <65 | I/II | Chemotherapy | 5-fluorouracil | CR | |
| CPED1 | SNV | Missense_Mutation | c.1279C>A | p.Leu427Ile | p.L427I | A4D0V7 | protein_coding | tolerated(0.48) | benign(0.006) | TCGA-C8-A27B-01 | Breast | breast invasive carcinoma | Female | <65 | I/II | Chemotherapy | 5-fluorouracil | CR | |
| CPED1 | SNV | Missense_Mutation | c.688N>T | p.His230Tyr | p.H230Y | A4D0V7 | protein_coding | tolerated(0.09) | possibly_damaging(0.551) | TCGA-D8-A1JA-01 | Breast | breast invasive carcinoma | Female | <65 | III/IV | Chemotherapy | adriamycin | PD | |
| CPED1 | SNV | Missense_Mutation | c.3042N>G | p.Ile1014Met | p.I1014M | A4D0V7 | protein_coding | deleterious(0) | probably_damaging(0.999) | TCGA-D8-A1JA-01 | Breast | breast invasive carcinoma | Female | <65 | III/IV | Chemotherapy | adriamycin | PD | |
| CPED1 | SNV | Missense_Mutation | c.836C>T | p.Thr279Met | p.T279M | A4D0V7 | protein_coding | deleterious(0) | probably_damaging(0.999) | TCGA-D8-A1JL-01 | Breast | breast invasive carcinoma | Female | >=65 | I/II | Unknown | Unknown | SD | |
| CPED1 | SNV | Missense_Mutation | c.2894A>T | p.Glu965Val | p.E965V | A4D0V7 | protein_coding | tolerated(0.07) | possibly_damaging(0.81) | TCGA-D8-A1JL-01 | Breast | breast invasive carcinoma | Female | >=65 | I/II | Unknown | Unknown | SD |
| Page: 1 2 3 4 5 6 7 8 9 10 11 12 13 14 15 16 17 18 19 |
Top |
Related drugs of malignant transformation related genes |
| Identification of chemicals and drugs interact with genes involved in malignant transfromation |
| (DGIdb 4.0) |
| Entrez ID | Symbol | Category | Interaction Types | Drug Claim Name | Drug Name | PMIDs |
| Page: 1 |

Copyright 2023-Present -The University of Texas Health Science Center at Houston |