
|
|||||
|
 | |
| |
| |
| |
| |
| |
|
Gene: CPEB4 |
Gene summary for CPEB4 |
| Gene information | Species | Human | Gene symbol | CPEB4 | Gene ID | 80315 |
| Gene name | cytoplasmic polyadenylation element binding protein 4 | |
| Gene Alias | CPE-BP4 | |
| Cytomap | 5q35.2 | |
| Gene Type | protein-coding | GO ID | GO:0001101 | UniProtAcc | Q17RY0 |
Top |
Malignant transformation analysis |
| Identification of the aberrant gene expression in precancerous and cancerous lesions by comparing the gene expression of stem-like cells in diseased tissues with normal stem cells |
| Entrez ID | Symbol | Replicates | Species | Organ | Tissue | Adj P-value | Log2FC | Malignancy |
| 80315 | CPEB4 | NAFLD1 | Human | Liver | NAFLD | 2.56e-03 | 8.61e-01 | -0.04 |
| 80315 | CPEB4 | S43 | Human | Liver | Cirrhotic | 2.98e-15 | -2.77e-01 | -0.0187 |
| 80315 | CPEB4 | HCC1_Meng | Human | Liver | HCC | 1.53e-53 | -2.66e-01 | 0.0246 |
| 80315 | CPEB4 | HCC2_Meng | Human | Liver | HCC | 2.76e-25 | -1.04e-01 | 0.0107 |
| 80315 | CPEB4 | cirrhotic1 | Human | Liver | Cirrhotic | 6.52e-03 | -2.27e-01 | 0.0202 |
| 80315 | CPEB4 | cirrhotic2 | Human | Liver | Cirrhotic | 8.83e-10 | -2.50e-02 | 0.0201 |
| 80315 | CPEB4 | cirrhotic3 | Human | Liver | Cirrhotic | 6.86e-06 | -2.92e-01 | 0.0215 |
| 80315 | CPEB4 | HCC1 | Human | Liver | HCC | 1.70e-03 | 3.75e+00 | 0.5336 |
| 80315 | CPEB4 | HCC2 | Human | Liver | HCC | 1.26e-12 | 3.90e+00 | 0.5341 |
| 80315 | CPEB4 | Pt13.b | Human | Liver | HCC | 4.55e-13 | -1.78e-01 | 0.0251 |
| 80315 | CPEB4 | TD9 | Human | Lung | IAC | 4.71e-10 | 9.36e-01 | 0.088 |
| 80315 | CPEB4 | RNA-P17T-P17T-2 | Human | Lung | IAC | 4.89e-03 | 4.28e-01 | 0.3371 |
| 80315 | CPEB4 | RNA-P17T-P17T-4 | Human | Lung | IAC | 5.88e-05 | 5.34e-01 | 0.343 |
| 80315 | CPEB4 | RNA-P17T-P17T-6 | Human | Lung | IAC | 2.38e-03 | 4.65e-01 | 0.3385 |
| 80315 | CPEB4 | RNA-P17T-P17T-8 | Human | Lung | IAC | 6.01e-05 | 5.66e-01 | 0.3329 |
| 80315 | CPEB4 | RNA-P25T1-P25T1-1 | Human | Lung | AIS | 5.58e-17 | 6.44e-01 | -0.2116 |
| 80315 | CPEB4 | RNA-P25T1-P25T1-2 | Human | Lung | AIS | 6.77e-06 | 7.00e-01 | -0.1941 |
| 80315 | CPEB4 | RNA-P25T1-P25T1-3 | Human | Lung | AIS | 7.44e-05 | 5.91e-01 | -0.2107 |
| 80315 | CPEB4 | RNA-P25T1-P25T1-4 | Human | Lung | AIS | 1.28e-05 | 4.56e-01 | -0.2119 |
| 80315 | CPEB4 | RNA-P6T2-P6T2-1 | Human | Lung | IAC | 7.07e-11 | 4.16e-01 | -0.0166 |
| Page: 1 2 3 |
| Tissue | Expression Dynamics | Abbreviation |
| Liver |  | HCC: Hepatocellular carcinoma |
| NAFLD: Non-alcoholic fatty liver disease | ||
| Lung | 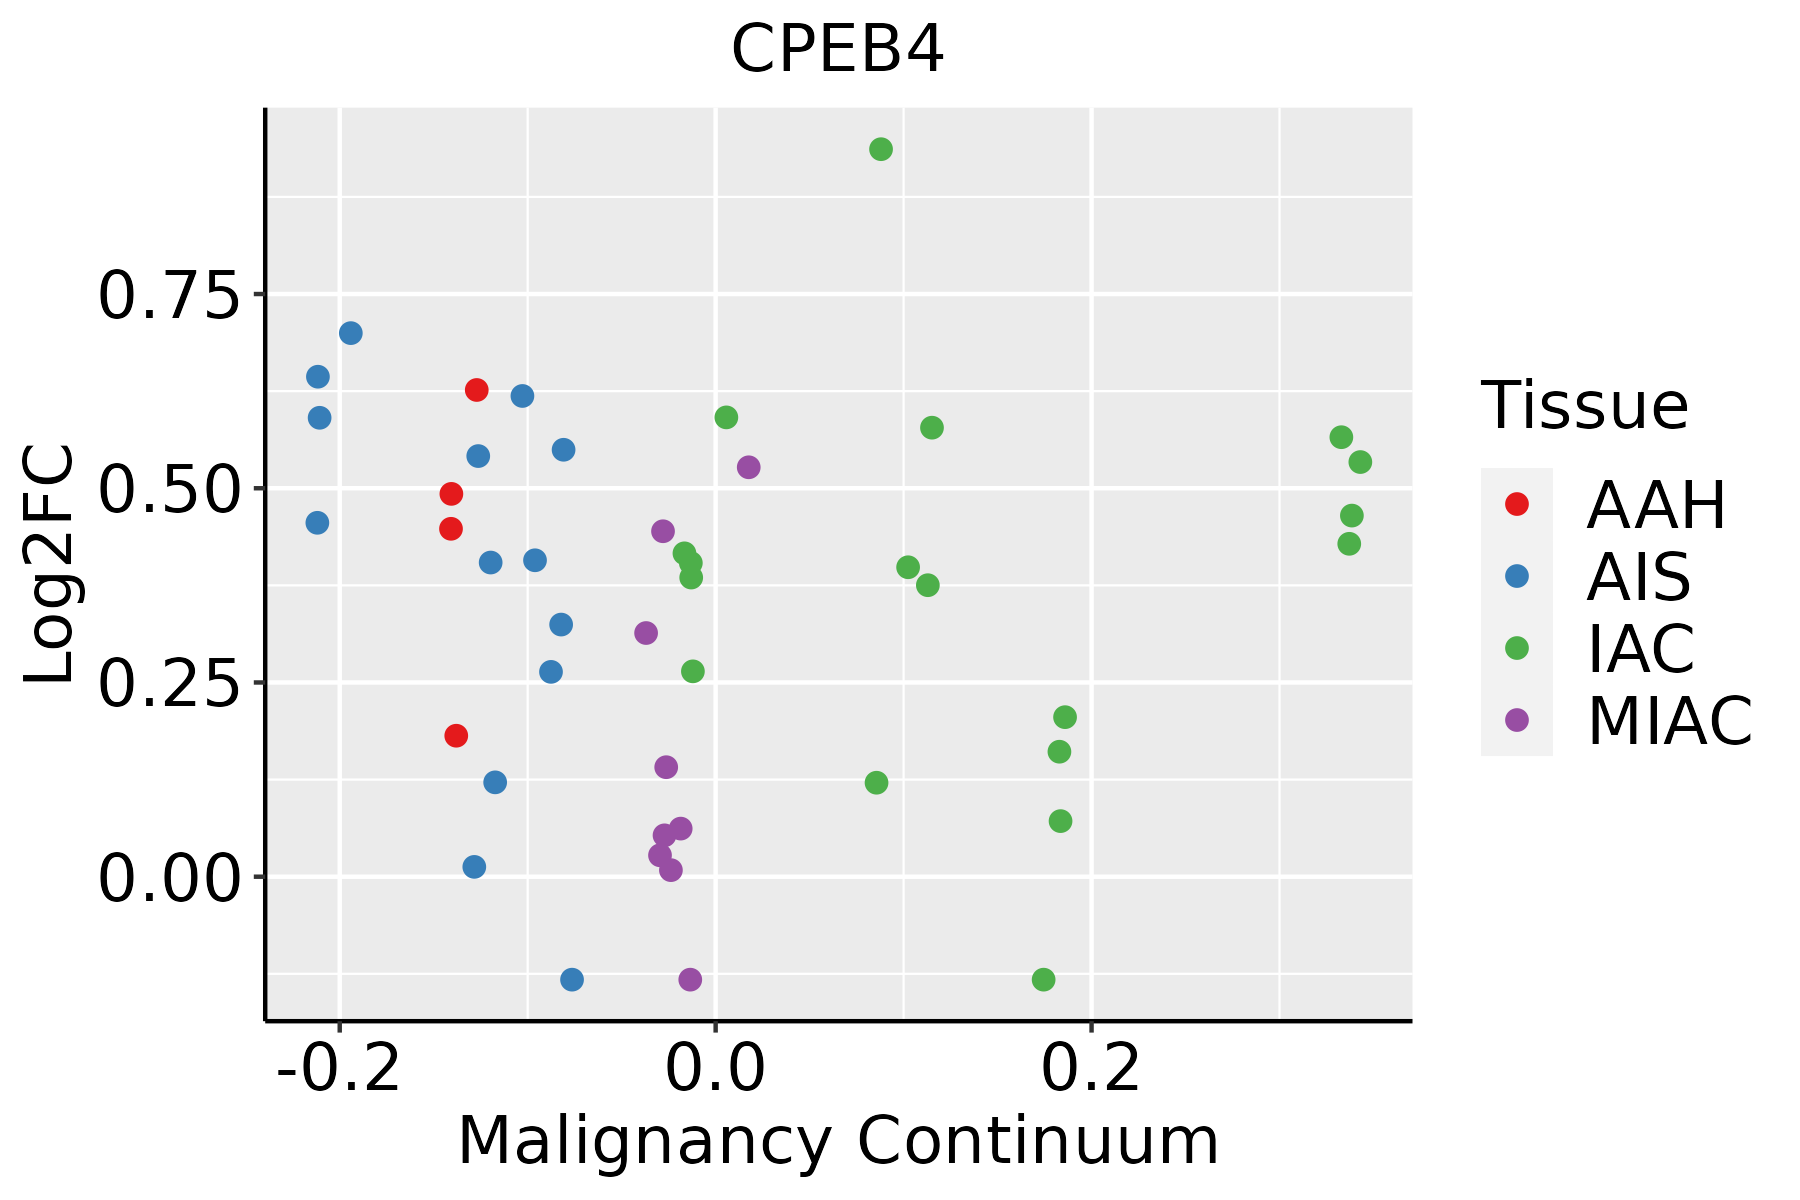 | AAH: Atypical adenomatous hyperplasia |
| AIS: Adenocarcinoma in situ | ||
| IAC: Invasive lung adenocarcinoma | ||
| MIA: Minimally invasive adenocarcinoma | ||
| Prostate | 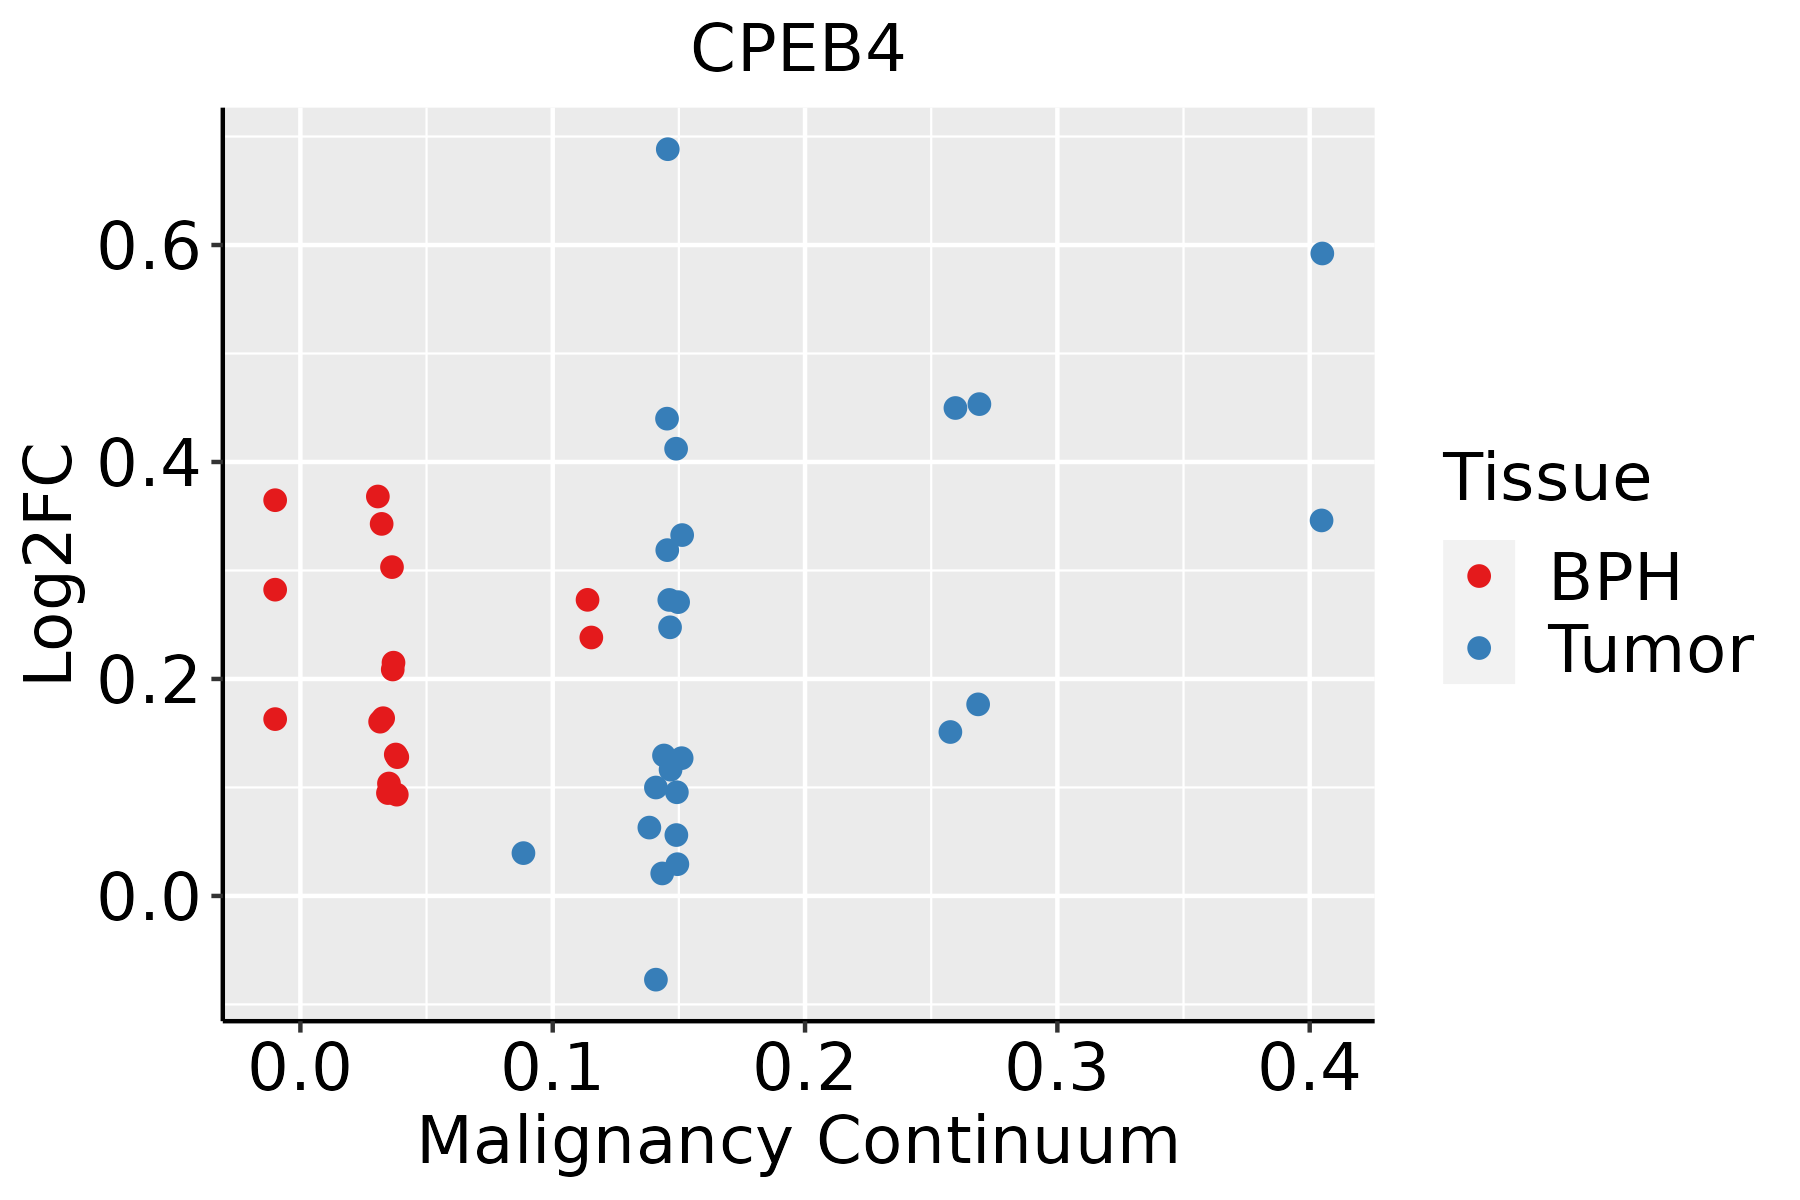 | BPH: Benign Prostatic Hyperplasia |
| Thyroid | 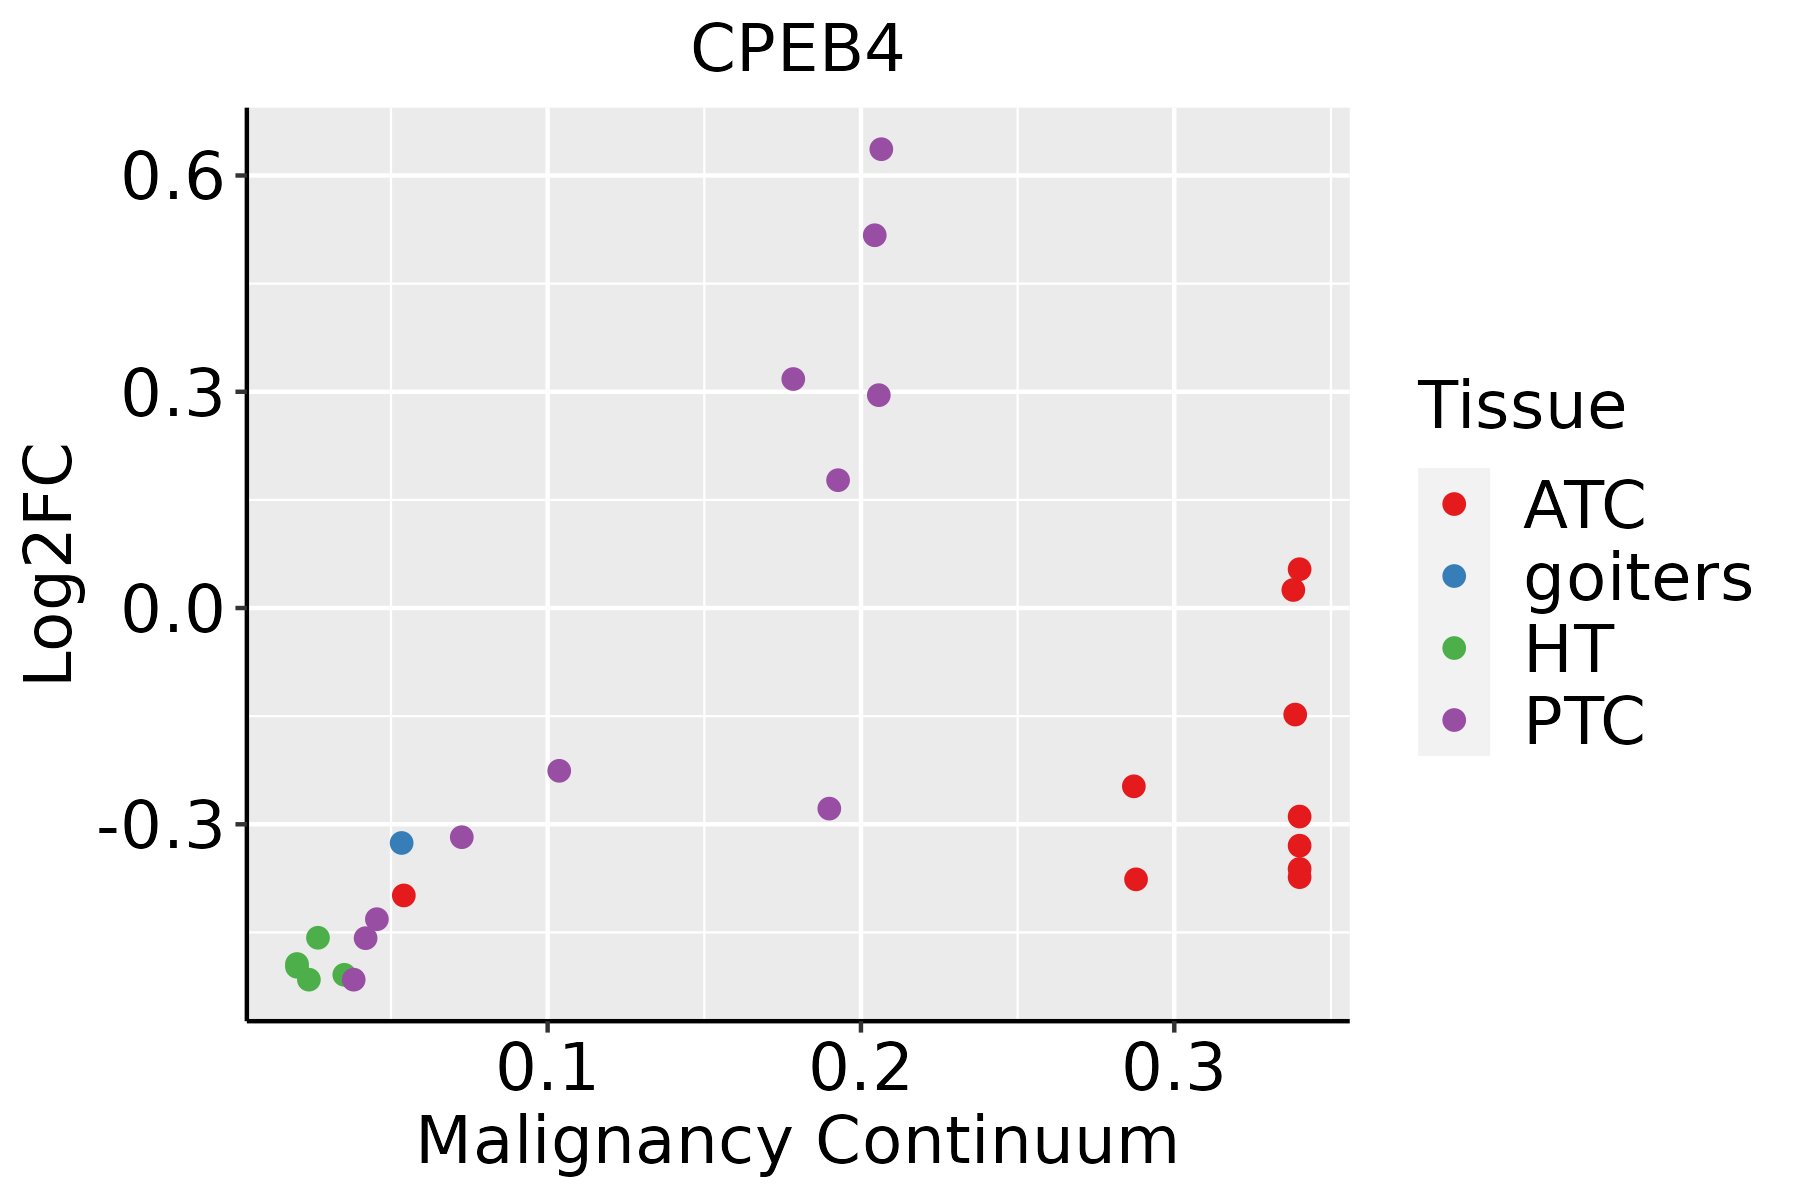 | ATC: Anaplastic thyroid cancer |
| HT: Hashimoto's thyroiditis | ||
| PTC: Papillary thyroid cancer |
| ∗log2FC in expression of this searched gene in stem-like cells from each diseased tissue sample relative to stem-like cells in normal samples in each tissue plotted against the malignancy continuum. Samples are colored based on if they are from different disease stage. |
Top |
Malignant transformation related pathway analysis |
| Find out the enriched GO biological processes and KEGG pathways involved in transition from healthy to precancer to cancer |
| Tissue | Disease Stage | Enriched GO biological Processes |
| Colorectum | AD |  |
| Colorectum | SER |  |
| Colorectum | MSS |  |
| Colorectum | MSI-H |  |
| Colorectum | FAP |  |
| ∗Top 15 enriched GO BP terms are showed in the bar plot of each disease state in each tissue. Each row represents a significant GO biological process which is colored according to the -log10(p.adjust). |
| Page: 1 2 3 4 5 6 7 8 9 |
| GO ID | Tissue | Disease Stage | Description | Gene Ratio | Bg Ratio | pvalue | p.adjust | Count |
| GO:00021817 | Liver | NAFLD | cytoplasmic translation | 93/1882 | 148/18723 | 1.44e-55 | 8.41e-52 | 93 |
| GO:00064177 | Liver | NAFLD | regulation of translation | 85/1882 | 468/18723 | 4.58e-08 | 4.54e-06 | 85 |
| GO:00316677 | Liver | NAFLD | response to nutrient levels | 85/1882 | 474/18723 | 8.23e-08 | 7.09e-06 | 85 |
| GO:00171483 | Liver | NAFLD | negative regulation of translation | 43/1882 | 245/18723 | 2.05e-04 | 3.56e-03 | 43 |
| GO:00342493 | Liver | NAFLD | negative regulation of cellular amide metabolic process | 46/1882 | 273/18723 | 3.27e-04 | 5.04e-03 | 46 |
| GO:00714967 | Liver | NAFLD | cellular response to external stimulus | 51/1882 | 320/18723 | 6.21e-04 | 8.18e-03 | 51 |
| GO:00425945 | Liver | NAFLD | response to starvation | 33/1882 | 197/18723 | 2.35e-03 | 2.21e-02 | 33 |
| GO:00709977 | Liver | NAFLD | neuron death | 52/1882 | 361/18723 | 5.08e-03 | 3.96e-02 | 52 |
| GO:000218112 | Liver | Cirrhotic | cytoplasmic translation | 120/4634 | 148/18723 | 2.95e-47 | 1.85e-43 | 120 |
| GO:000641712 | Liver | Cirrhotic | regulation of translation | 194/4634 | 468/18723 | 7.28e-16 | 8.79e-14 | 194 |
| GO:007099712 | Liver | Cirrhotic | neuron death | 141/4634 | 361/18723 | 9.56e-10 | 4.38e-08 | 141 |
| GO:004259412 | Liver | Cirrhotic | response to starvation | 87/4634 | 197/18723 | 1.85e-09 | 7.78e-08 | 87 |
| GO:003166712 | Liver | Cirrhotic | response to nutrient levels | 174/4634 | 474/18723 | 3.08e-09 | 1.27e-07 | 174 |
| GO:007149612 | Liver | Cirrhotic | cellular response to external stimulus | 123/4634 | 320/18723 | 3.27e-08 | 1.10e-06 | 123 |
| GO:19012147 | Liver | Cirrhotic | regulation of neuron death | 122/4634 | 319/18723 | 5.17e-08 | 1.62e-06 | 122 |
| GO:00316686 | Liver | Cirrhotic | cellular response to extracellular stimulus | 96/4634 | 246/18723 | 4.55e-07 | 1.05e-05 | 96 |
| GO:00092675 | Liver | Cirrhotic | cellular response to starvation | 67/4634 | 156/18723 | 4.58e-07 | 1.05e-05 | 67 |
| GO:00316695 | Liver | Cirrhotic | cellular response to nutrient levels | 85/4634 | 215/18723 | 1.08e-06 | 2.20e-05 | 85 |
| GO:00704827 | Liver | Cirrhotic | response to oxygen levels | 125/4634 | 347/18723 | 1.55e-06 | 3.02e-05 | 125 |
| GO:003424911 | Liver | Cirrhotic | negative regulation of cellular amide metabolic process | 100/4634 | 273/18723 | 7.34e-06 | 1.13e-04 | 100 |
| Page: 1 2 3 4 5 6 7 8 9 10 11 |
| Pathway ID | Tissue | Disease Stage | Description | Gene Ratio | Bg Ratio | pvalue | p.adjust | qvalue | Count |
| Page: 1 |
Top |
Cell-cell communication analysis |
| Identification of potential cell-cell interactions between two cell types and their ligand-receptor pairs for different disease states |
| Ligand | Receptor | LRpair | Pathway | Tissue | Disease Stage |
| Page: 1 |
Top |
Single-cell gene regulatory network inference analysis |
| Find out the significant the regulons (TFs) and the target genes of each regulon across cell types for different disease states |
| TF | Cell Type | Tissue | Disease Stage | Target Gene | RSS | Regulon Activity |
| ∗The dot plots of a searched regulon are shown for all cell subpopulations in each disease state of each tissue based on the regulon specific score inferred using pySCENIC and by calculating the average expression. |
| Page: 1 |
Top |
Somatic mutation of malignant transformation related genes |
| Annotation of somatic variants for genes involved in malignant transformation |
| Hugo Symbol | Variant Class | Variant Classification | dbSNP RS | HGVSc | HGVSp | HGVSp Short | SWISSPROT | BIOTYPE | SIFT | PolyPhen | Tumor Sample Barcode | Tissue | Histology | Sex | Age | Stage | Therapy Types | Drugs | Outcome |
| CPEB4 | SNV | Missense_Mutation | novel | c.149N>A | p.Ala50Asp | p.A50D | Q17RY0 | protein_coding | tolerated_low_confidence(0.16) | benign(0.368) | TCGA-A8-A06P-01 | Breast | breast invasive carcinoma | Female | <65 | III/IV | Unspecific | SD | |
| CPEB4 | SNV | Missense_Mutation | rs148567441 | c.1144N>A | p.Asp382Asn | p.D382N | Q17RY0 | protein_coding | tolerated_low_confidence(0.3) | probably_damaging(0.986) | TCGA-AN-A046-01 | Breast | breast invasive carcinoma | Female | >=65 | I/II | Unknown | Unknown | SD |
| CPEB4 | SNV | Missense_Mutation | c.995C>T | p.Ser332Leu | p.S332L | Q17RY0 | protein_coding | deleterious_low_confidence(0) | probably_damaging(0.997) | TCGA-IR-A3LA-01 | Cervix | cervical & endocervical cancer | Female | <65 | I/II | Chemotherapy | cisplatin | CR | |
| CPEB4 | deletion | Frame_Shift_Del | novel | c.555_571delNNNNNNNNNNNNNNNNN | p.Asp186ProfsTer10 | p.D186Pfs*10 | Q17RY0 | protein_coding | TCGA-DG-A2KL-01 | Cervix | cervical & endocervical cancer | Female | <65 | I/II | Chemotherapy | cisplatin | SD | ||
| CPEB4 | SNV | Missense_Mutation | c.962N>C | p.Leu321Pro | p.L321P | Q17RY0 | protein_coding | deleterious_low_confidence(0) | possibly_damaging(0.781) | TCGA-AA-3854-01 | Colorectum | colon adenocarcinoma | Female | >=65 | I/II | Unknown | Unknown | SD | |
| CPEB4 | SNV | Missense_Mutation | novel | c.484N>A | p.Ala162Thr | p.A162T | Q17RY0 | protein_coding | tolerated_low_confidence(0.11) | benign(0.085) | TCGA-AA-3949-01 | Colorectum | colon adenocarcinoma | Female | >=65 | III/IV | Unknown | Unknown | SD |
| CPEB4 | SNV | Missense_Mutation | c.1049N>A | p.Arg350His | p.R350H | Q17RY0 | protein_coding | deleterious_low_confidence(0) | probably_damaging(0.985) | TCGA-AA-A010-01 | Colorectum | colon adenocarcinoma | Female | <65 | I/II | Chemotherapy | folinic | CR | |
| CPEB4 | SNV | Missense_Mutation | rs752472463 | c.1775N>A | p.Arg592Gln | p.R592Q | Q17RY0 | protein_coding | deleterious(0) | possibly_damaging(0.848) | TCGA-AA-A010-01 | Colorectum | colon adenocarcinoma | Female | <65 | I/II | Chemotherapy | folinic | CR |
| CPEB4 | SNV | Missense_Mutation | c.1055G>A | p.Ser352Asn | p.S352N | Q17RY0 | protein_coding | tolerated_low_confidence(0.27) | benign(0) | TCGA-AA-A01K-01 | Colorectum | colon adenocarcinoma | Female | >=65 | III/IV | Chemotherapy | folinic | CR | |
| CPEB4 | SNV | Missense_Mutation | c.1766N>A | p.Arg589Gln | p.R589Q | Q17RY0 | protein_coding | deleterious(0) | probably_damaging(0.971) | TCGA-AA-A02R-01 | Colorectum | colon adenocarcinoma | Female | >=65 | I/II | Unknown | Unknown | PD |
| Page: 1 2 3 4 5 6 7 8 |
Top |
Related drugs of malignant transformation related genes |
| Identification of chemicals and drugs interact with genes involved in malignant transfromation |
| (DGIdb 4.0) |
| Entrez ID | Symbol | Category | Interaction Types | Drug Claim Name | Drug Name | PMIDs |
| Page: 1 |

Copyright 2023-Present -The University of Texas Health Science Center at Houston |