
|
|||||
|
 | |
| |
| |
| |
| |
| |
|
Gene: CPEB3 |
Gene summary for CPEB3 |
| Gene information | Species | Human | Gene symbol | CPEB3 | Gene ID | 22849 |
| Gene name | cytoplasmic polyadenylation element binding protein 3 | |
| Gene Alias | CPEB3 | |
| Cytomap | 10q23.32 | |
| Gene Type | protein-coding | GO ID | GO:0000122 | UniProtAcc | Q5QP71 |
Top |
Malignant transformation analysis |
| Identification of the aberrant gene expression in precancerous and cancerous lesions by comparing the gene expression of stem-like cells in diseased tissues with normal stem cells |
| Entrez ID | Symbol | Replicates | Species | Organ | Tissue | Adj P-value | Log2FC | Malignancy |
| 22849 | CPEB3 | CCI_1 | Human | Cervix | CC | 3.24e-06 | 6.87e-01 | 0.528 |
| 22849 | CPEB3 | CCI_2 | Human | Cervix | CC | 1.96e-11 | 1.10e+00 | 0.5249 |
| 22849 | CPEB3 | CCI_3 | Human | Cervix | CC | 6.68e-07 | 6.13e-01 | 0.516 |
| 22849 | CPEB3 | HTA11_3410_2000001011 | Human | Colorectum | AD | 9.34e-06 | -3.55e-01 | 0.0155 |
| 22849 | CPEB3 | HTA11_347_2000001011 | Human | Colorectum | AD | 9.37e-06 | 5.35e-01 | -0.1954 |
| 22849 | CPEB3 | HTA11_866_3004761011 | Human | Colorectum | AD | 5.93e-03 | -3.13e-01 | 0.096 |
| 22849 | CPEB3 | HTA11_7696_3000711011 | Human | Colorectum | AD | 4.48e-03 | -2.90e-01 | 0.0674 |
| 22849 | CPEB3 | HTA11_99999970781_79442 | Human | Colorectum | MSS | 3.35e-11 | -4.14e-01 | 0.294 |
| 22849 | CPEB3 | HTA11_99999974143_84620 | Human | Colorectum | MSS | 7.68e-13 | -4.48e-01 | 0.3005 |
| 22849 | CPEB3 | A002-C-010 | Human | Colorectum | FAP | 3.18e-02 | -1.39e-01 | 0.242 |
| 22849 | CPEB3 | A015-C-203 | Human | Colorectum | FAP | 3.58e-18 | -3.49e-01 | -0.1294 |
| 22849 | CPEB3 | A015-C-204 | Human | Colorectum | FAP | 1.05e-03 | -3.26e-01 | -0.0228 |
| 22849 | CPEB3 | A014-C-040 | Human | Colorectum | FAP | 1.87e-03 | -4.55e-01 | -0.1184 |
| 22849 | CPEB3 | A002-C-201 | Human | Colorectum | FAP | 6.50e-11 | -3.81e-01 | 0.0324 |
| 22849 | CPEB3 | A002-C-203 | Human | Colorectum | FAP | 8.80e-03 | -1.78e-01 | 0.2786 |
| 22849 | CPEB3 | A001-C-119 | Human | Colorectum | FAP | 1.54e-09 | -4.53e-01 | -0.1557 |
| 22849 | CPEB3 | A001-C-108 | Human | Colorectum | FAP | 9.27e-10 | -2.80e-01 | -0.0272 |
| 22849 | CPEB3 | A002-C-205 | Human | Colorectum | FAP | 8.91e-17 | -4.35e-01 | -0.1236 |
| 22849 | CPEB3 | A001-C-104 | Human | Colorectum | FAP | 5.99e-04 | -2.26e-01 | 0.0184 |
| 22849 | CPEB3 | A015-C-005 | Human | Colorectum | FAP | 1.23e-02 | -2.39e-01 | -0.0336 |
| Page: 1 2 3 |
| Tissue | Expression Dynamics | Abbreviation |
| Cervix |  | CC: Cervix cancer |
| HSIL_HPV: HPV-infected high-grade squamous intraepithelial lesions | ||
| N_HPV: HPV-infected normal cervix | ||
| Colorectum (GSE201348) |  | FAP: Familial adenomatous polyposis |
| CRC: Colorectal cancer | ||
| Colorectum (HTA11) |  | AD: Adenomas |
| SER: Sessile serrated lesions | ||
| MSI-H: Microsatellite-high colorectal cancer | ||
| MSS: Microsatellite stable colorectal cancer | ||
| Liver | 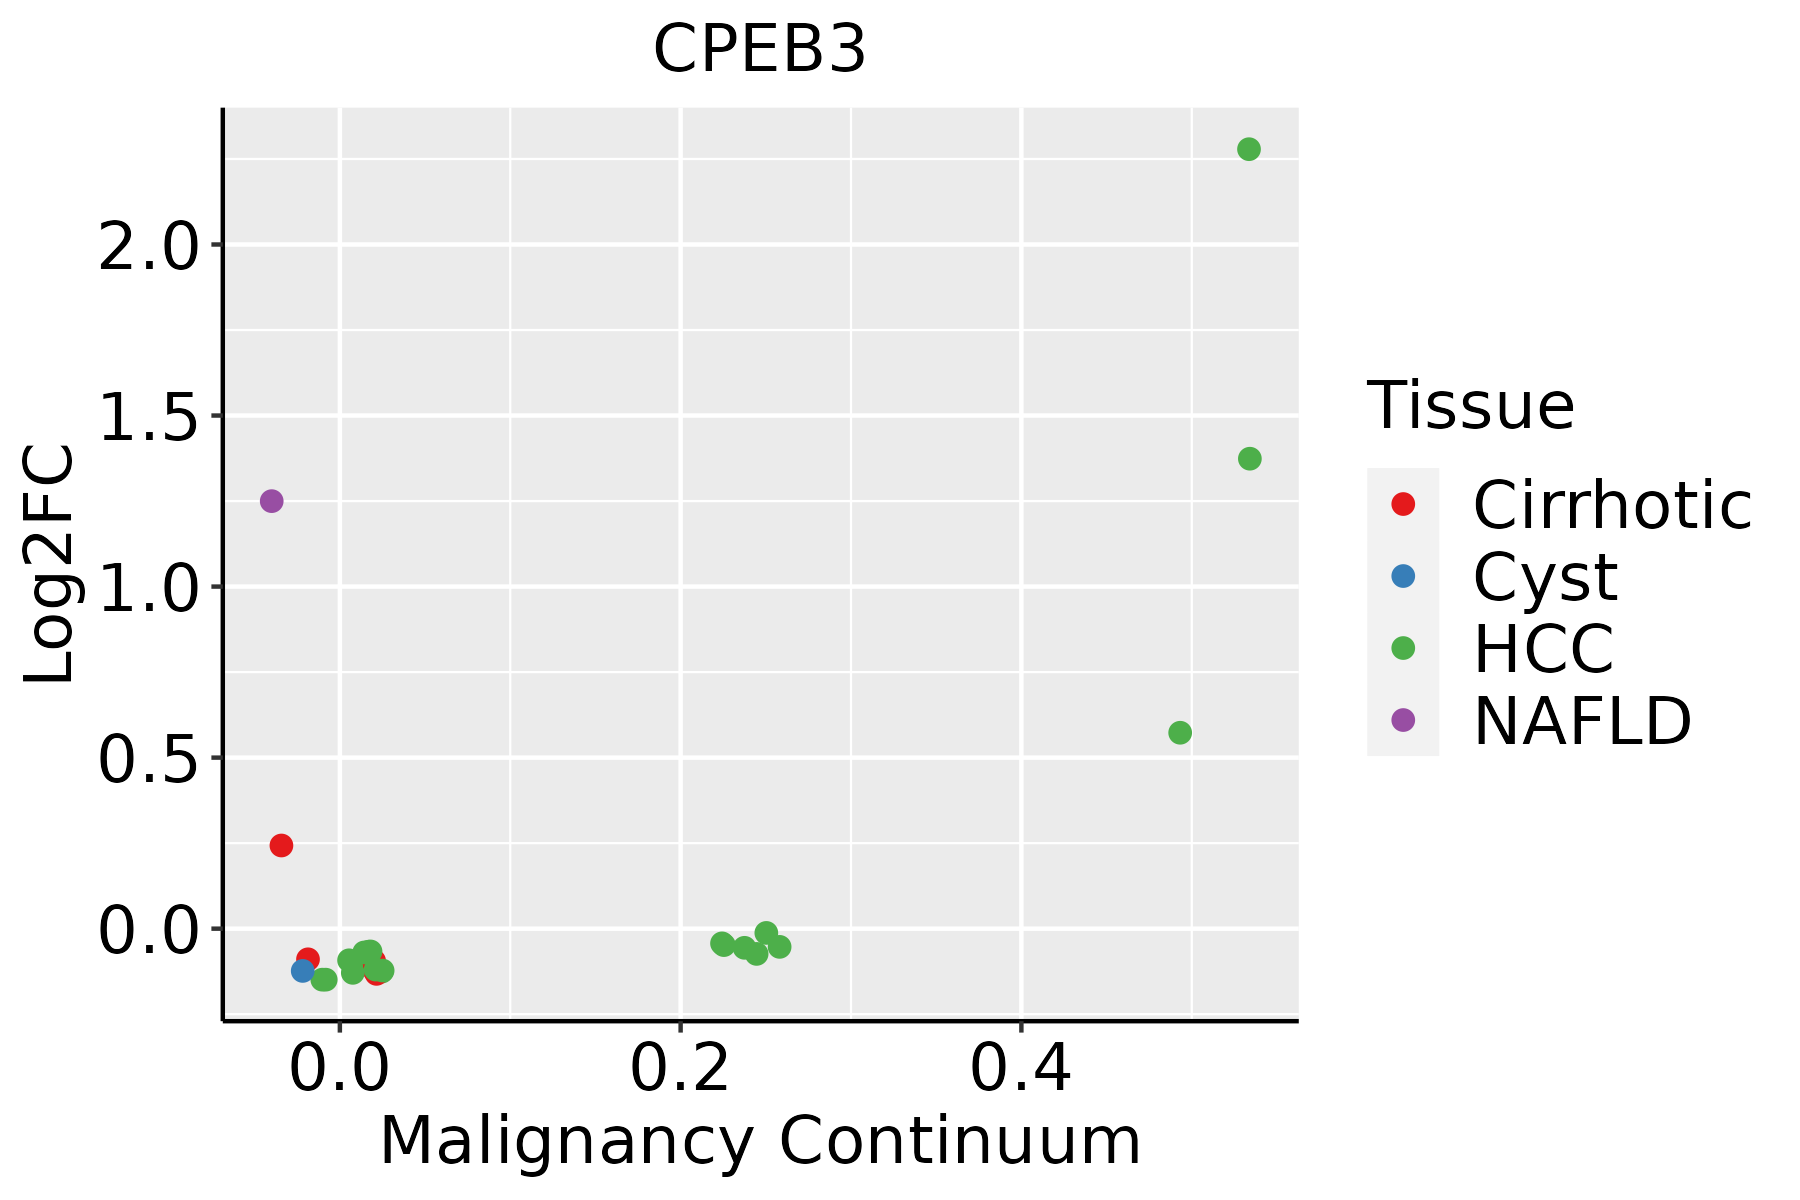 | HCC: Hepatocellular carcinoma |
| NAFLD: Non-alcoholic fatty liver disease |
| ∗log2FC in expression of this searched gene in stem-like cells from each diseased tissue sample relative to stem-like cells in normal samples in each tissue plotted against the malignancy continuum. Samples are colored based on if they are from different disease stage. |
Top |
Malignant transformation related pathway analysis |
| Find out the enriched GO biological processes and KEGG pathways involved in transition from healthy to precancer to cancer |
| Tissue | Disease Stage | Enriched GO biological Processes |
| Colorectum | AD |  |
| Colorectum | SER |  |
| Colorectum | MSS |  |
| Colorectum | MSI-H |  |
| Colorectum | FAP |  |
| ∗Top 15 enriched GO BP terms are showed in the bar plot of each disease state in each tissue. Each row represents a significant GO biological process which is colored according to the -log10(p.adjust). |
| Page: 1 2 3 4 5 6 7 8 9 |
| GO ID | Tissue | Disease Stage | Description | Gene Ratio | Bg Ratio | pvalue | p.adjust | Count |
| GO:000218110 | Cervix | CC | cytoplasmic translation | 96/2311 | 148/18723 | 4.87e-51 | 2.91e-47 | 96 |
| GO:000989610 | Cervix | CC | positive regulation of catabolic process | 109/2311 | 492/18723 | 5.26e-10 | 6.99e-08 | 109 |
| GO:003133110 | Cervix | CC | positive regulation of cellular catabolic process | 91/2311 | 427/18723 | 9.64e-08 | 5.25e-06 | 91 |
| GO:00163587 | Cervix | CC | dendrite development | 58/2311 | 243/18723 | 4.52e-07 | 1.76e-05 | 58 |
| GO:00064029 | Cervix | CC | mRNA catabolic process | 56/2311 | 232/18723 | 4.81e-07 | 1.83e-05 | 56 |
| GO:19001517 | Cervix | CC | regulation of nuclear-transcribed mRNA catabolic process, deadenylation-dependent decay | 11/2311 | 18/18723 | 1.37e-06 | 4.55e-05 | 11 |
| GO:19033119 | Cervix | CC | regulation of mRNA metabolic process | 64/2311 | 288/18723 | 1.71e-06 | 5.64e-05 | 64 |
| GO:00064019 | Cervix | CC | RNA catabolic process | 62/2311 | 278/18723 | 2.18e-06 | 6.56e-05 | 62 |
| GO:003425010 | Cervix | CC | positive regulation of cellular amide metabolic process | 40/2311 | 162/18723 | 1.11e-05 | 2.41e-04 | 40 |
| GO:00002896 | Cervix | CC | nuclear-transcribed mRNA poly(A) tail shortening | 13/2311 | 29/18723 | 1.48e-05 | 2.93e-04 | 13 |
| GO:00609965 | Cervix | CC | dendritic spine development | 28/2311 | 99/18723 | 1.61e-05 | 3.15e-04 | 28 |
| GO:00602119 | Cervix | CC | regulation of nuclear-transcribed mRNA poly(A) tail shortening | 9/2311 | 15/18723 | 1.63e-05 | 3.17e-04 | 9 |
| GO:19001536 | Cervix | CC | positive regulation of nuclear-transcribed mRNA catabolic process, deadenylation-dependent decay | 9/2311 | 15/18723 | 1.63e-05 | 3.17e-04 | 9 |
| GO:000641710 | Cervix | CC | regulation of translation | 89/2311 | 468/18723 | 1.86e-05 | 3.46e-04 | 89 |
| GO:00009567 | Cervix | CC | nuclear-transcribed mRNA catabolic process | 30/2311 | 112/18723 | 2.60e-05 | 4.37e-04 | 30 |
| GO:00602139 | Cervix | CC | positive regulation of nuclear-transcribed mRNA poly(A) tail shortening | 8/2311 | 13/18723 | 3.85e-05 | 6.05e-04 | 8 |
| GO:00002886 | Cervix | CC | nuclear-transcribed mRNA catabolic process, deadenylation-dependent decay | 18/2311 | 56/18723 | 8.42e-05 | 1.13e-03 | 18 |
| GO:004572710 | Cervix | CC | positive regulation of translation | 33/2311 | 136/18723 | 9.09e-05 | 1.20e-03 | 33 |
| GO:00506849 | Cervix | CC | regulation of mRNA processing | 33/2311 | 137/18723 | 1.06e-04 | 1.35e-03 | 33 |
| GO:00610139 | Cervix | CC | regulation of mRNA catabolic process | 38/2311 | 166/18723 | 1.07e-04 | 1.36e-03 | 38 |
| Page: 1 2 3 4 5 6 7 8 9 10 11 12 13 14 15 |
| Pathway ID | Tissue | Disease Stage | Description | Gene Ratio | Bg Ratio | pvalue | p.adjust | qvalue | Count |
| Page: 1 |
Top |
Cell-cell communication analysis |
| Identification of potential cell-cell interactions between two cell types and their ligand-receptor pairs for different disease states |
| Ligand | Receptor | LRpair | Pathway | Tissue | Disease Stage |
| Page: 1 |
Top |
Single-cell gene regulatory network inference analysis |
| Find out the significant the regulons (TFs) and the target genes of each regulon across cell types for different disease states |
| TF | Cell Type | Tissue | Disease Stage | Target Gene | RSS | Regulon Activity |
| ∗The dot plots of a searched regulon are shown for all cell subpopulations in each disease state of each tissue based on the regulon specific score inferred using pySCENIC and by calculating the average expression. |
| Page: 1 |
Top |
Somatic mutation of malignant transformation related genes |
| Annotation of somatic variants for genes involved in malignant transformation |
| Hugo Symbol | Variant Class | Variant Classification | dbSNP RS | HGVSc | HGVSp | HGVSp Short | SWISSPROT | BIOTYPE | SIFT | PolyPhen | Tumor Sample Barcode | Tissue | Histology | Sex | Age | Stage | Therapy Types | Drugs | Outcome |
| CPEB3 | SNV | Missense_Mutation | c.1096N>C | p.Gly366Arg | p.G366R | Q8NE35 | protein_coding | deleterious(0.02) | benign(0.261) | TCGA-AN-A0AR-01 | Breast | breast invasive carcinoma | Female | <65 | I/II | Unknown | Unknown | SD | |
| CPEB3 | SNV | Missense_Mutation | c.19N>C | p.Met7Leu | p.M7L | Q8NE35 | protein_coding | tolerated_low_confidence(0.24) | benign(0.354) | TCGA-B6-A0IH-01 | Breast | breast invasive carcinoma | Female | >=65 | III/IV | Unknown | Unknown | SD | |
| CPEB3 | insertion | Frame_Shift_Ins | rs763864563 | c.188_189insC | p.Ala64GlyfsTer258 | p.A64Gfs*258 | Q8NE35 | protein_coding | TCGA-AR-A5QN-01 | Breast | breast invasive carcinoma | Female | >=65 | III/IV | Chemotherapy | taxotere | SD | ||
| CPEB3 | insertion | Frame_Shift_Ins | novel | c.258_259insGCAAGTGTGTGGCAAGGTGCCGGCATAGTCCCAGGATG | p.Pro87AlafsTer46 | p.P87Afs*46 | Q8NE35 | protein_coding | TCGA-B6-A0IB-01 | Breast | breast invasive carcinoma | Female | <65 | III/IV | Unknown | Unknown | PD | ||
| CPEB3 | SNV | Missense_Mutation | rs764406144 | c.1653C>G | p.Ile551Met | p.I551M | Q8NE35 | protein_coding | deleterious(0) | probably_damaging(0.973) | TCGA-C5-A7CK-01 | Cervix | cervical & endocervical cancer | Female | <65 | I/II | Chemotherapy | cisplatin | SD |
| CPEB3 | SNV | Missense_Mutation | c.1280C>T | p.Pro427Leu | p.P427L | Q8NE35 | protein_coding | deleterious(0) | possibly_damaging(0.621) | TCGA-EA-A50E-01 | Cervix | cervical & endocervical cancer | Female | <65 | I/II | Unknown | Unknown | PD | |
| CPEB3 | SNV | Missense_Mutation | novel | c.645N>G | p.Ile215Met | p.I215M | Q8NE35 | protein_coding | tolerated(0.35) | benign(0.276) | TCGA-VS-A958-01 | Cervix | cervical & endocervical cancer | Female | <65 | I/II | Chemotherapy | cisplatin | CR |
| CPEB3 | SNV | Missense_Mutation | novel | c.1544N>G | p.Val515Gly | p.V515G | Q8NE35 | protein_coding | deleterious(0) | possibly_damaging(0.897) | TCGA-A6-6141-01 | Colorectum | colon adenocarcinoma | Male | <65 | I/II | Chemotherapy | 5-fu | SD |
| CPEB3 | SNV | Missense_Mutation | c.1712N>A | p.Arg571His | p.R571H | Q8NE35 | protein_coding | deleterious(0.03) | benign(0.263) | TCGA-A6-6653-01 | Colorectum | colon adenocarcinoma | Male | >=65 | I/II | Unknown | Unknown | SD | |
| CPEB3 | SNV | Missense_Mutation | novel | c.1682G>A | p.Arg561Gln | p.R561Q | Q8NE35 | protein_coding | deleterious(0.01) | possibly_damaging(0.831) | TCGA-AA-3672-01 | Colorectum | colon adenocarcinoma | Female | >=65 | III/IV | Unknown | Unknown | SD |
| Page: 1 2 3 4 5 6 |
Top |
Related drugs of malignant transformation related genes |
| Identification of chemicals and drugs interact with genes involved in malignant transfromation |
| (DGIdb 4.0) |
| Entrez ID | Symbol | Category | Interaction Types | Drug Claim Name | Drug Name | PMIDs |
| Page: 1 |

Copyright 2023-Present -The University of Texas Health Science Center at Houston |