
|
|||||
|
 | |
| |
| |
| |
| |
| |
|
Gene: CPE |
Gene summary for CPE |
| Gene information | Species | Human | Gene symbol | CPE | Gene ID | 1363 |
| Gene name | carboxypeptidase E | |
| Gene Alias | CPH | |
| Cytomap | 4q32.3 | |
| Gene Type | protein-coding | GO ID | GO:0003007 | UniProtAcc | P16870 |
Top |
Malignant transformation analysis |
| Identification of the aberrant gene expression in precancerous and cancerous lesions by comparing the gene expression of stem-like cells in diseased tissues with normal stem cells |
| Entrez ID | Symbol | Replicates | Species | Organ | Tissue | Adj P-value | Log2FC | Malignancy |
| 1363 | CPE | CA_HPV_3 | Human | Cervix | CC | 8.55e-36 | 5.94e-01 | 0.0414 |
| 1363 | CPE | sample1 | Human | Cervix | CC | 4.46e-16 | 6.90e-01 | 0.0959 |
| 1363 | CPE | T1 | Human | Cervix | CC | 4.63e-33 | 7.44e-01 | 0.0918 |
| 1363 | CPE | LZE24T | Human | Esophagus | ESCC | 2.55e-02 | -2.78e-01 | 0.0596 |
| 1363 | CPE | P2T-E | Human | Esophagus | ESCC | 2.69e-89 | 2.53e+00 | 0.1177 |
| 1363 | CPE | P4T-E | Human | Esophagus | ESCC | 1.66e-20 | 7.59e-01 | 0.1323 |
| 1363 | CPE | P10T-E | Human | Esophagus | ESCC | 4.97e-12 | 2.95e-01 | 0.116 |
| 1363 | CPE | P11T-E | Human | Esophagus | ESCC | 4.91e-03 | 4.69e-01 | 0.1426 |
| 1363 | CPE | P12T-E | Human | Esophagus | ESCC | 3.19e-03 | -2.42e-01 | 0.1122 |
| 1363 | CPE | P16T-E | Human | Esophagus | ESCC | 2.64e-43 | 1.19e+00 | 0.1153 |
| 1363 | CPE | P21T-E | Human | Esophagus | ESCC | 3.79e-04 | -1.37e-01 | 0.1617 |
| 1363 | CPE | P22T-E | Human | Esophagus | ESCC | 2.00e-17 | 4.87e-01 | 0.1236 |
| 1363 | CPE | P23T-E | Human | Esophagus | ESCC | 1.51e-03 | 4.76e-01 | 0.108 |
| 1363 | CPE | P26T-E | Human | Esophagus | ESCC | 3.48e-76 | 1.71e+00 | 0.1276 |
| 1363 | CPE | P28T-E | Human | Esophagus | ESCC | 7.36e-03 | -1.78e-01 | 0.1149 |
| 1363 | CPE | P31T-E | Human | Esophagus | ESCC | 6.04e-03 | -1.54e-01 | 0.1251 |
| 1363 | CPE | P32T-E | Human | Esophagus | ESCC | 1.57e-06 | 1.77e-01 | 0.1666 |
| 1363 | CPE | P37T-E | Human | Esophagus | ESCC | 9.84e-21 | 8.79e-01 | 0.1371 |
| 1363 | CPE | P39T-E | Human | Esophagus | ESCC | 3.49e-03 | -2.00e-01 | 0.0894 |
| 1363 | CPE | P40T-E | Human | Esophagus | ESCC | 2.89e-02 | 1.71e-01 | 0.109 |
| Page: 1 2 3 4 5 6 |
| Tissue | Expression Dynamics | Abbreviation |
| Cervix |  | CC: Cervix cancer |
| HSIL_HPV: HPV-infected high-grade squamous intraepithelial lesions | ||
| N_HPV: HPV-infected normal cervix | ||
| Esophagus | 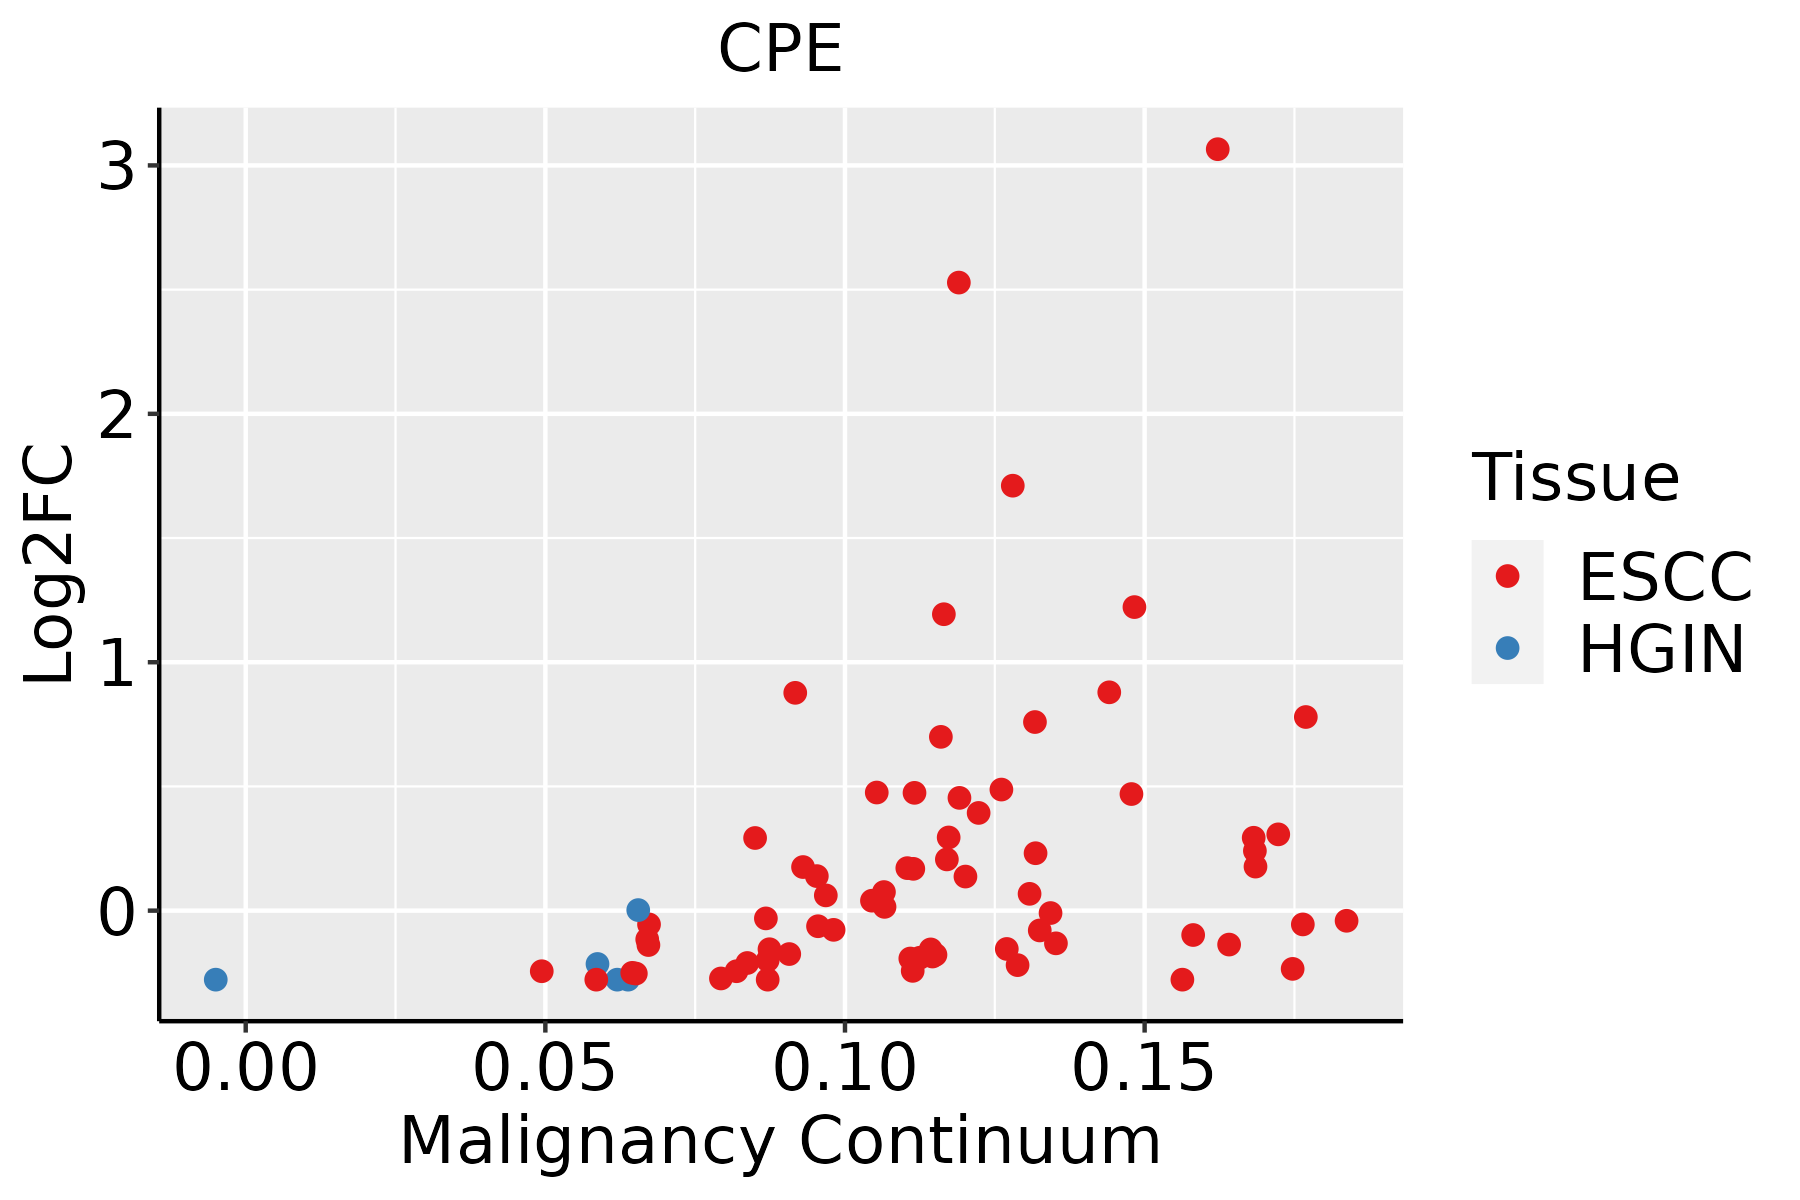 | ESCC: Esophageal squamous cell carcinoma |
| HGIN: High-grade intraepithelial neoplasias | ||
| LGIN: Low-grade intraepithelial neoplasias | ||
| Liver | 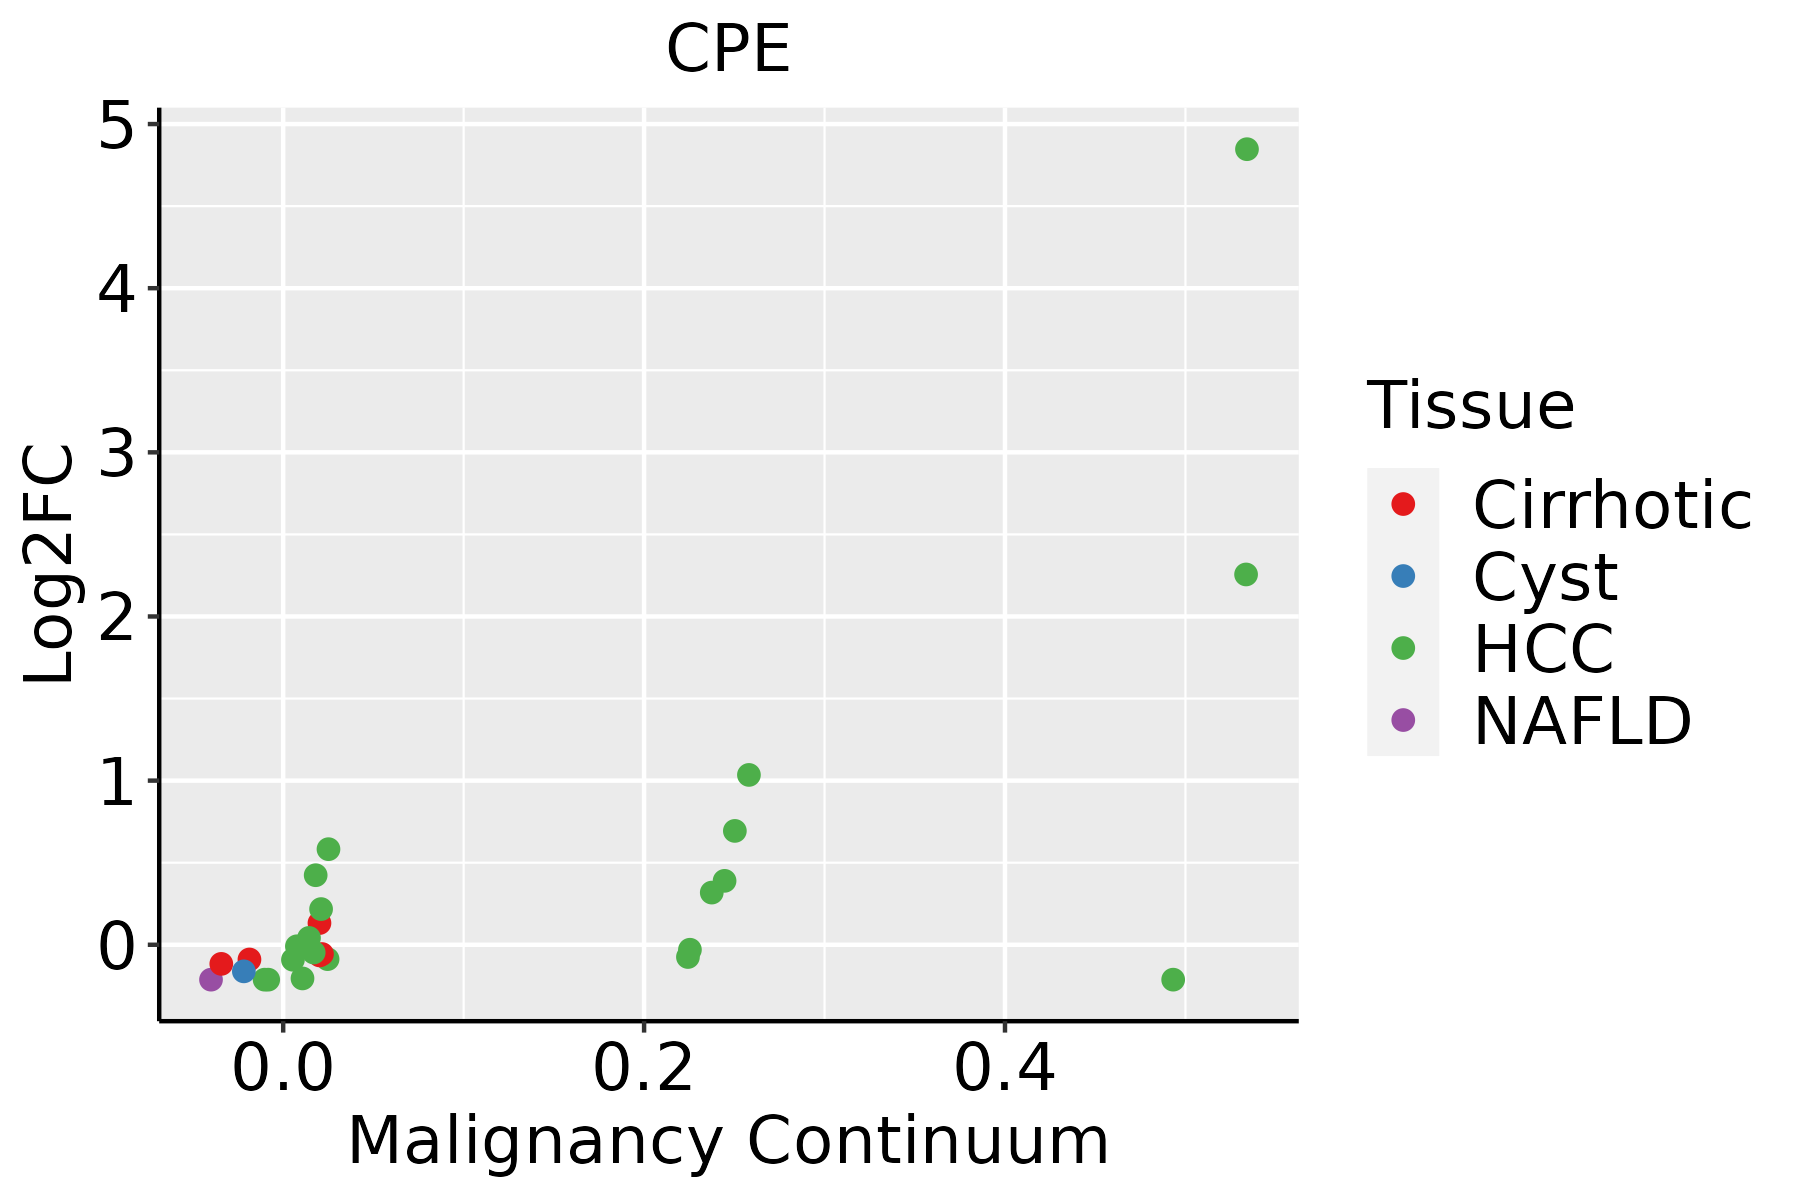 | HCC: Hepatocellular carcinoma |
| NAFLD: Non-alcoholic fatty liver disease | ||
| Oral Cavity | 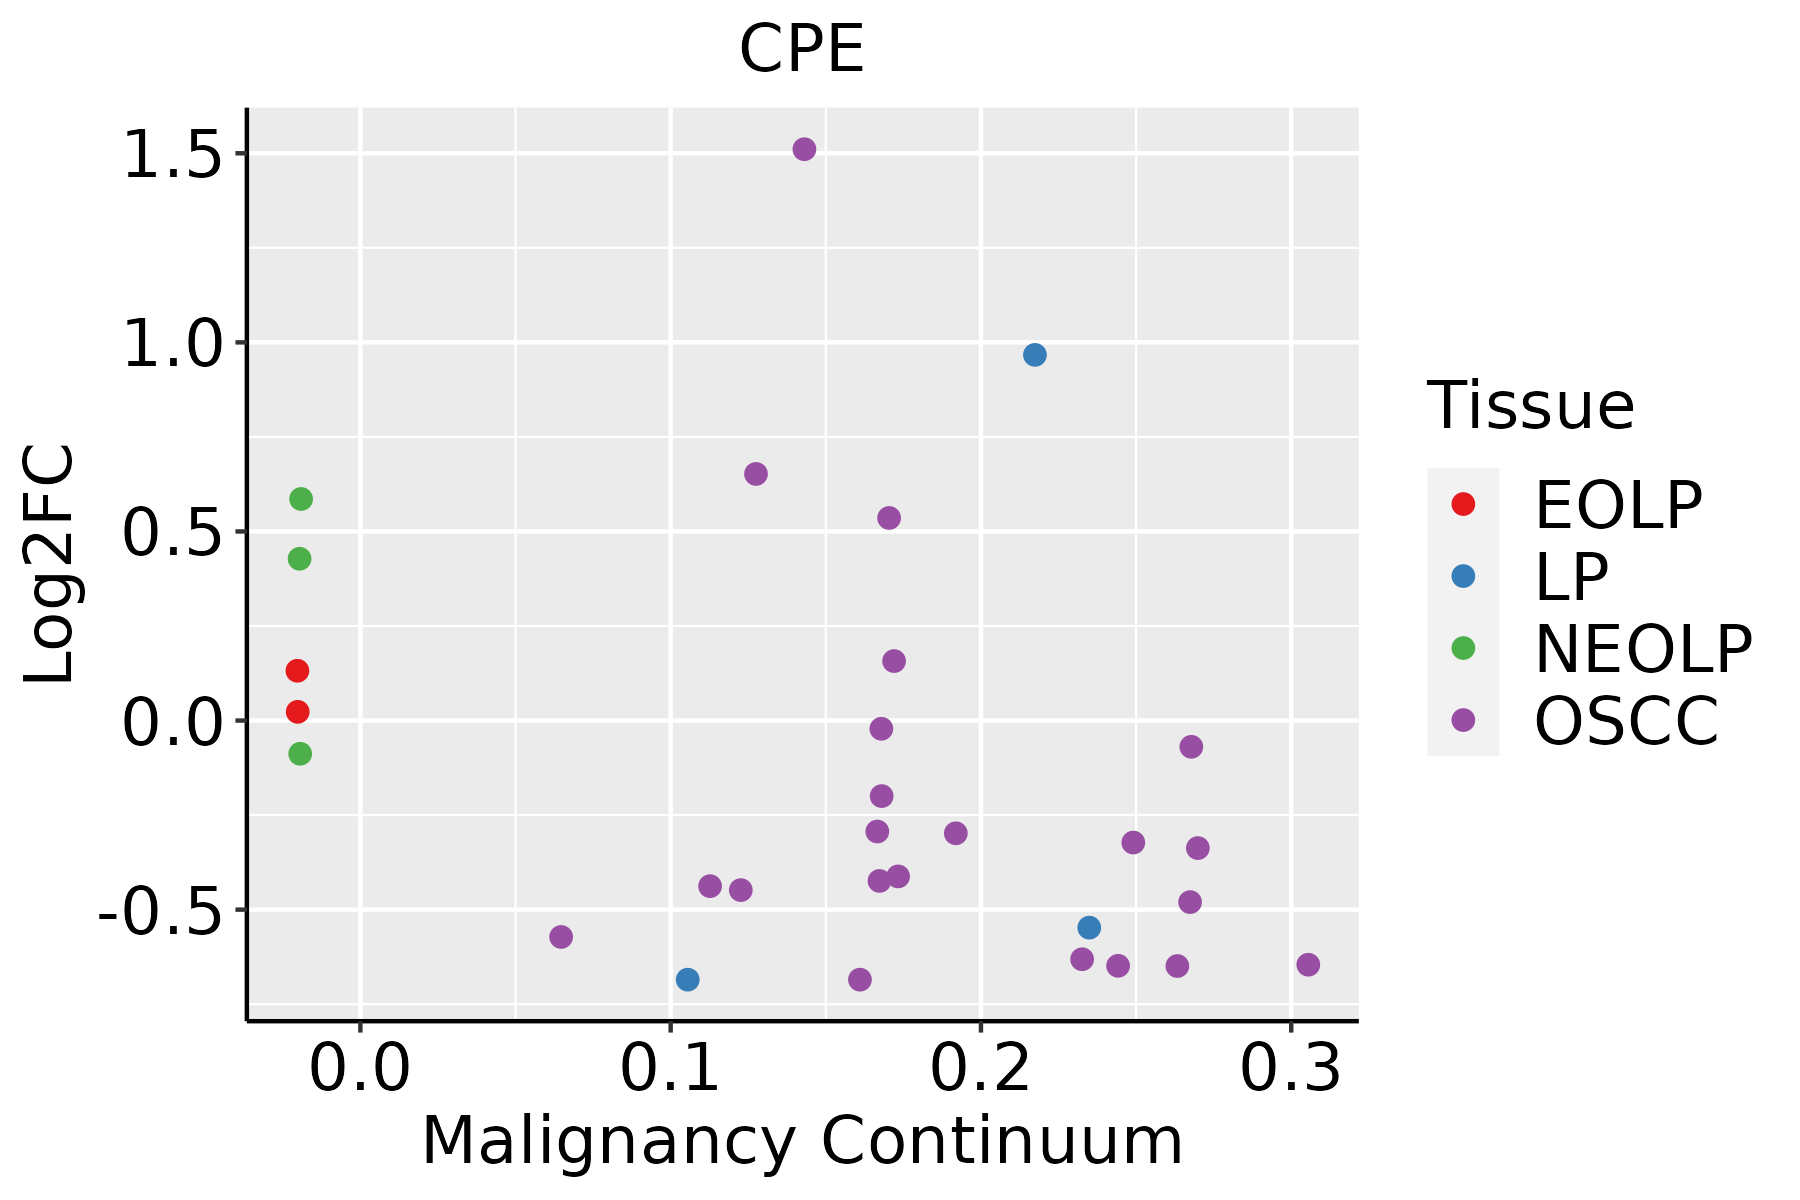 | EOLP: Erosive Oral lichen planus |
| LP: leukoplakia | ||
| NEOLP: Non-erosive oral lichen planus | ||
| OSCC: Oral squamous cell carcinoma | ||
| Prostate | 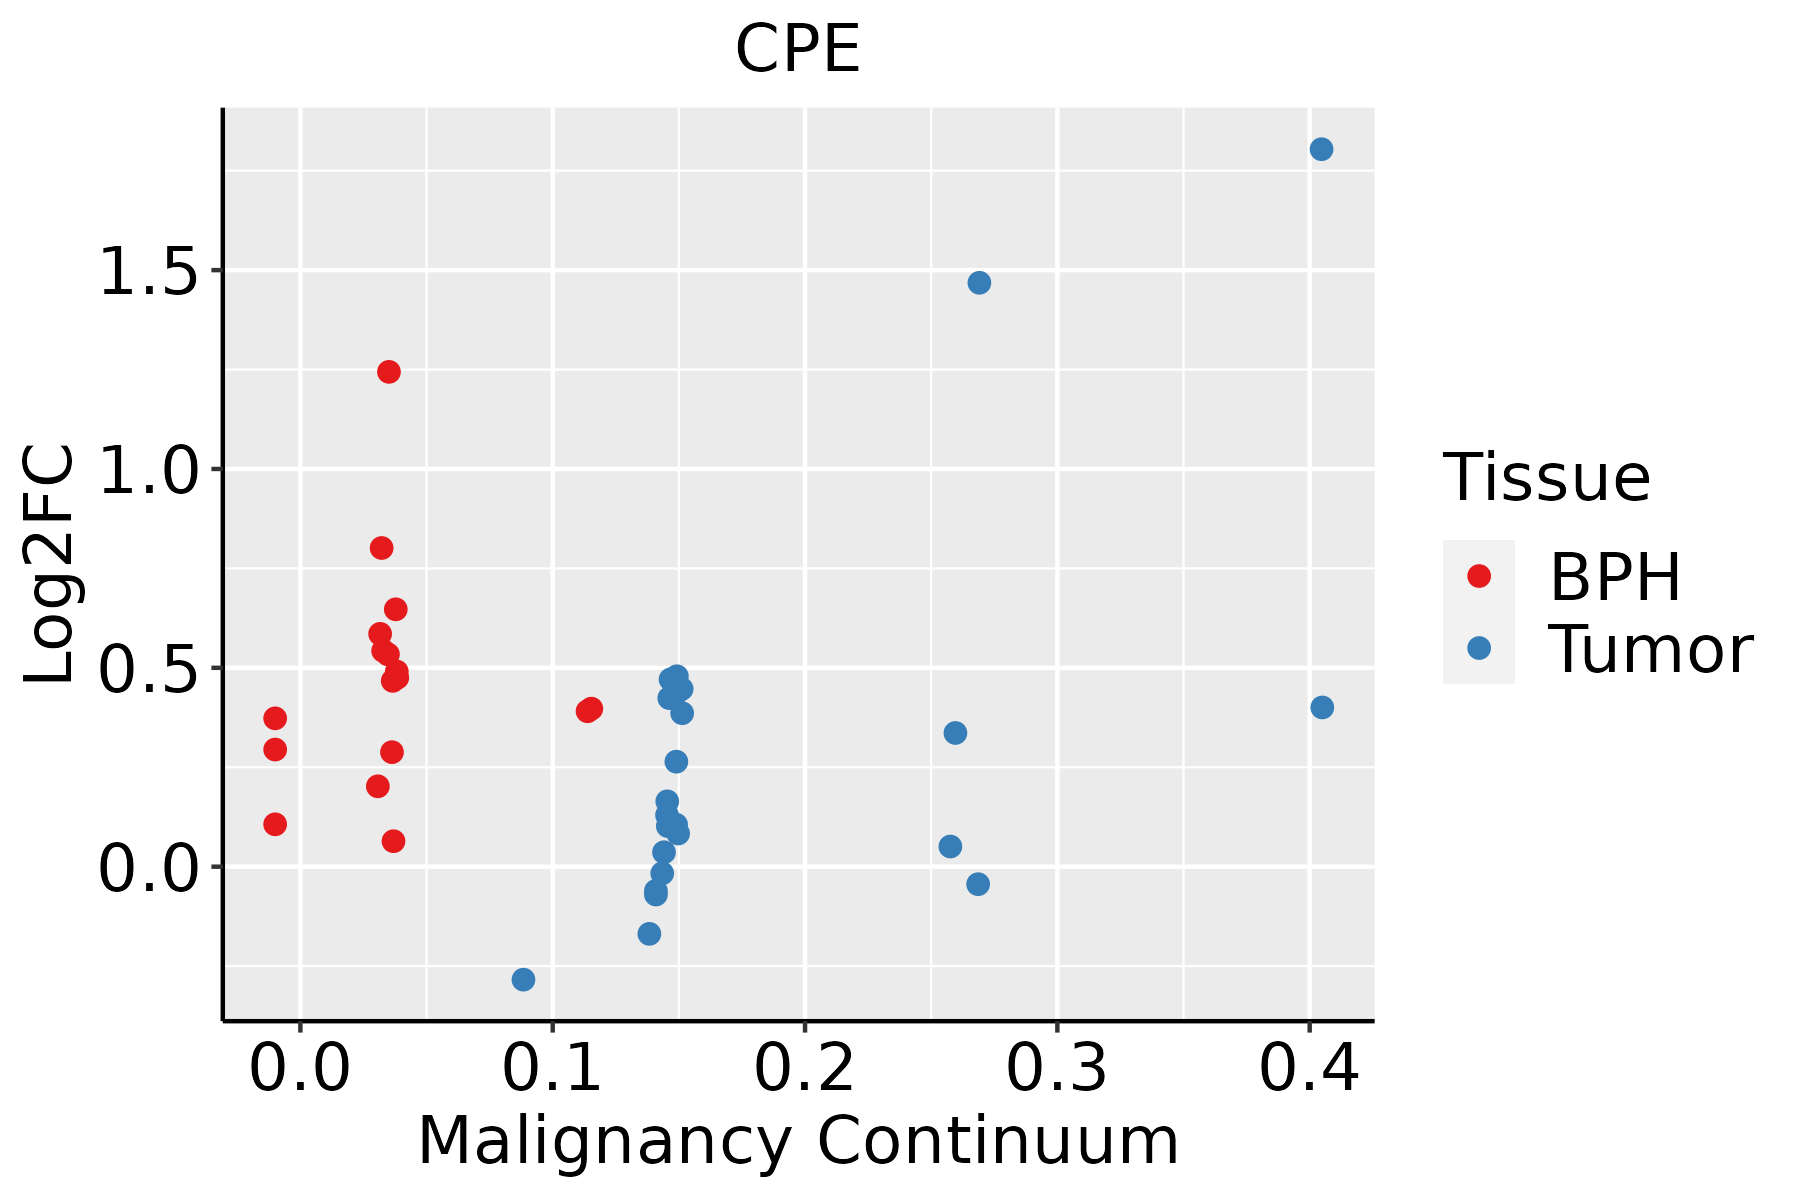 | BPH: Benign Prostatic Hyperplasia |
| Thyroid | 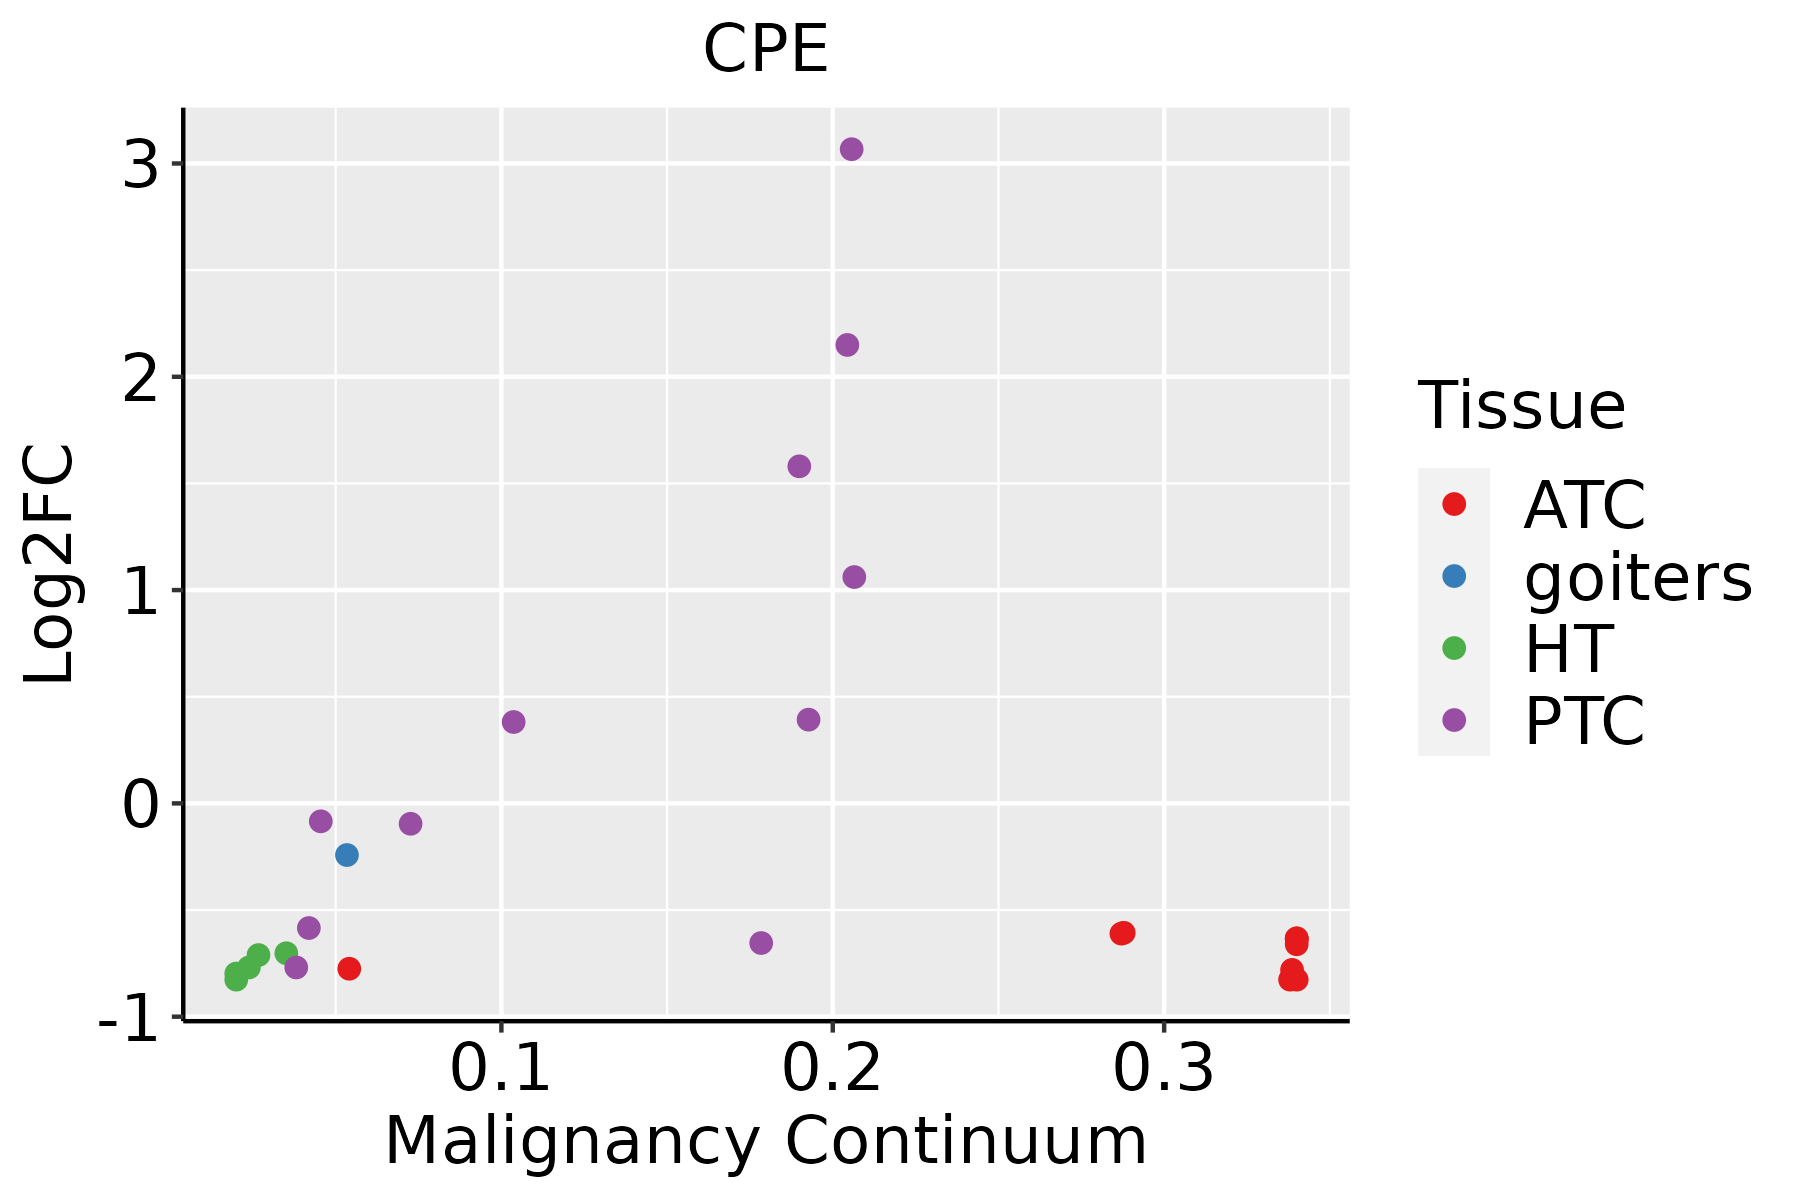 | ATC: Anaplastic thyroid cancer |
| HT: Hashimoto's thyroiditis | ||
| PTC: Papillary thyroid cancer |
| ∗log2FC in expression of this searched gene in stem-like cells from each diseased tissue sample relative to stem-like cells in normal samples in each tissue plotted against the malignancy continuum. Samples are colored based on if they are from different disease stage. |
Top |
Malignant transformation related pathway analysis |
| Find out the enriched GO biological processes and KEGG pathways involved in transition from healthy to precancer to cancer |
| Tissue | Disease Stage | Enriched GO biological Processes |
| Colorectum | AD |  |
| Colorectum | SER |  |
| Colorectum | MSS |  |
| Colorectum | MSI-H |  |
| Colorectum | FAP |  |
| ∗Top 15 enriched GO BP terms are showed in the bar plot of each disease state in each tissue. Each row represents a significant GO biological process which is colored according to the -log10(p.adjust). |
| Page: 1 2 3 4 5 6 7 8 9 |
| GO ID | Tissue | Disease Stage | Description | Gene Ratio | Bg Ratio | pvalue | p.adjust | Count |
| GO:000218110 | Cervix | CC | cytoplasmic translation | 96/2311 | 148/18723 | 4.87e-51 | 2.91e-47 | 96 |
| GO:000989610 | Cervix | CC | positive regulation of catabolic process | 109/2311 | 492/18723 | 5.26e-10 | 6.99e-08 | 109 |
| GO:00160557 | Cervix | CC | Wnt signaling pathway | 98/2311 | 444/18723 | 4.82e-09 | 4.65e-07 | 98 |
| GO:01987387 | Cervix | CC | cell-cell signaling by wnt | 98/2311 | 446/18723 | 6.16e-09 | 5.58e-07 | 98 |
| GO:003133110 | Cervix | CC | positive regulation of cellular catabolic process | 91/2311 | 427/18723 | 9.64e-08 | 5.25e-06 | 91 |
| GO:00163587 | Cervix | CC | dendrite development | 58/2311 | 243/18723 | 4.52e-07 | 1.76e-05 | 58 |
| GO:00064029 | Cervix | CC | mRNA catabolic process | 56/2311 | 232/18723 | 4.81e-07 | 1.83e-05 | 56 |
| GO:19001517 | Cervix | CC | regulation of nuclear-transcribed mRNA catabolic process, deadenylation-dependent decay | 11/2311 | 18/18723 | 1.37e-06 | 4.55e-05 | 11 |
| GO:19033119 | Cervix | CC | regulation of mRNA metabolic process | 64/2311 | 288/18723 | 1.71e-06 | 5.64e-05 | 64 |
| GO:00064019 | Cervix | CC | RNA catabolic process | 62/2311 | 278/18723 | 2.18e-06 | 6.56e-05 | 62 |
| GO:003425010 | Cervix | CC | positive regulation of cellular amide metabolic process | 40/2311 | 162/18723 | 1.11e-05 | 2.41e-04 | 40 |
| GO:00002896 | Cervix | CC | nuclear-transcribed mRNA poly(A) tail shortening | 13/2311 | 29/18723 | 1.48e-05 | 2.93e-04 | 13 |
| GO:00609965 | Cervix | CC | dendritic spine development | 28/2311 | 99/18723 | 1.61e-05 | 3.15e-04 | 28 |
| GO:00602119 | Cervix | CC | regulation of nuclear-transcribed mRNA poly(A) tail shortening | 9/2311 | 15/18723 | 1.63e-05 | 3.17e-04 | 9 |
| GO:19001536 | Cervix | CC | positive regulation of nuclear-transcribed mRNA catabolic process, deadenylation-dependent decay | 9/2311 | 15/18723 | 1.63e-05 | 3.17e-04 | 9 |
| GO:000641710 | Cervix | CC | regulation of translation | 89/2311 | 468/18723 | 1.86e-05 | 3.46e-04 | 89 |
| GO:00009567 | Cervix | CC | nuclear-transcribed mRNA catabolic process | 30/2311 | 112/18723 | 2.60e-05 | 4.37e-04 | 30 |
| GO:00602139 | Cervix | CC | positive regulation of nuclear-transcribed mRNA poly(A) tail shortening | 8/2311 | 13/18723 | 3.85e-05 | 6.05e-04 | 8 |
| GO:00002886 | Cervix | CC | nuclear-transcribed mRNA catabolic process, deadenylation-dependent decay | 18/2311 | 56/18723 | 8.42e-05 | 1.13e-03 | 18 |
| GO:004572710 | Cervix | CC | positive regulation of translation | 33/2311 | 136/18723 | 9.09e-05 | 1.20e-03 | 33 |
| Page: 1 2 3 4 5 6 7 8 9 10 11 12 13 14 15 16 17 18 19 20 21 22 23 24 25 26 27 28 |
| Pathway ID | Tissue | Disease Stage | Description | Gene Ratio | Bg Ratio | pvalue | p.adjust | qvalue | Count |
| hsa0494016 | Cervix | CC | Type I diabetes mellitus | 17/1267 | 43/8465 | 7.47e-05 | 5.04e-04 | 2.98e-04 | 17 |
| hsa0494017 | Cervix | CC | Type I diabetes mellitus | 17/1267 | 43/8465 | 7.47e-05 | 5.04e-04 | 2.98e-04 | 17 |
| Page: 1 |
Top |
Cell-cell communication analysis |
| Identification of potential cell-cell interactions between two cell types and their ligand-receptor pairs for different disease states |
| Ligand | Receptor | LRpair | Pathway | Tissue | Disease Stage |
| Page: 1 |
Top |
Single-cell gene regulatory network inference analysis |
| Find out the significant the regulons (TFs) and the target genes of each regulon across cell types for different disease states |
| TF | Cell Type | Tissue | Disease Stage | Target Gene | RSS | Regulon Activity |
| ∗The dot plots of a searched regulon are shown for all cell subpopulations in each disease state of each tissue based on the regulon specific score inferred using pySCENIC and by calculating the average expression. |
| Page: 1 |
Top |
Somatic mutation of malignant transformation related genes |
| Annotation of somatic variants for genes involved in malignant transformation |
| Hugo Symbol | Variant Class | Variant Classification | dbSNP RS | HGVSc | HGVSp | HGVSp Short | SWISSPROT | BIOTYPE | SIFT | PolyPhen | Tumor Sample Barcode | Tissue | Histology | Sex | Age | Stage | Therapy Types | Drugs | Outcome |
| CPE | SNV | Missense_Mutation | c.739C>T | p.Leu247Phe | p.L247F | P16870 | protein_coding | tolerated(0.08) | benign(0.342) | TCGA-A2-A25C-01 | Breast | breast invasive carcinoma | Female | <65 | I/II | Chemotherapy | taxotere | SD | |
| CPE | SNV | Missense_Mutation | c.448N>T | p.Arg150Cys | p.R150C | P16870 | protein_coding | deleterious(0) | probably_damaging(1) | TCGA-BH-A0HF-01 | Breast | breast invasive carcinoma | Female | >=65 | I/II | Hormone Therapy | arimidex | SD | |
| CPE | SNV | Missense_Mutation | c.376N>G | p.Phe126Val | p.F126V | P16870 | protein_coding | tolerated(0.3) | benign(0.021) | TCGA-C8-A12V-01 | Breast | breast invasive carcinoma | Female | <65 | I/II | Unknown | Unknown | SD | |
| CPE | SNV | Missense_Mutation | c.731C>A | p.Ser244Tyr | p.S244Y | P16870 | protein_coding | deleterious(0) | probably_damaging(0.999) | TCGA-Q1-A6DW-01 | Cervix | cervical & endocervical cancer | Female | <65 | I/II | Chemotherapy | cisplatin | SD | |
| CPE | SNV | Missense_Mutation | novel | c.274G>A | p.Glu92Lys | p.E92K | P16870 | protein_coding | deleterious(0) | benign(0.155) | TCGA-A6-5665-01 | Colorectum | colon adenocarcinoma | Female | >=65 | I/II | Unknown | Unknown | PD |
| CPE | SNV | Missense_Mutation | rs756392535 | c.566N>A | p.Arg189Gln | p.R189Q | P16870 | protein_coding | deleterious(0) | probably_damaging(0.975) | TCGA-AA-3502-01 | Colorectum | colon adenocarcinoma | Male | >=65 | I/II | Unknown | Unknown | SD |
| CPE | SNV | Missense_Mutation | c.214G>A | p.Ala72Thr | p.A72T | P16870 | protein_coding | tolerated(0.28) | benign(0.007) | TCGA-AA-3821-01 | Colorectum | colon adenocarcinoma | Female | >=65 | I/II | Unknown | Unknown | SD | |
| CPE | SNV | Missense_Mutation | novel | c.596N>G | p.Tyr199Cys | p.Y199C | P16870 | protein_coding | deleterious(0) | benign(0.359) | TCGA-AA-3949-01 | Colorectum | colon adenocarcinoma | Female | >=65 | III/IV | Unknown | Unknown | SD |
| CPE | SNV | Missense_Mutation | rs753892074 | c.802N>A | p.Glu268Lys | p.E268K | P16870 | protein_coding | tolerated(0.22) | benign(0.298) | TCGA-AA-3977-01 | Colorectum | colon adenocarcinoma | Male | >=65 | I/II | Unknown | Unknown | SD |
| CPE | SNV | Missense_Mutation | c.449N>A | p.Arg150His | p.R150H | P16870 | protein_coding | deleterious(0) | probably_damaging(0.999) | TCGA-AA-A00N-01 | Colorectum | colon adenocarcinoma | Male | >=65 | I/II | Unknown | Unknown | PD |
| Page: 1 2 3 4 5 6 7 8 |
Top |
Related drugs of malignant transformation related genes |
| Identification of chemicals and drugs interact with genes involved in malignant transfromation |
| (DGIdb 4.0) |
| Entrez ID | Symbol | Category | Interaction Types | Drug Claim Name | Drug Name | PMIDs |
| Page: 1 |

Copyright 2023-Present -The University of Texas Health Science Center at Houston |