
|
|||||
|
 | |
| |
| |
| |
| |
| |
|
Gene: CPAMD8 |
Gene summary for CPAMD8 |
| Gene information | Species | Human | Gene symbol | CPAMD8 | Gene ID | 27151 |
| Gene name | C3 and PZP like alpha-2-macroglobulin domain containing 8 | |
| Gene Alias | ASGD8 | |
| Cytomap | 19p13.11 | |
| Gene Type | protein-coding | GO ID | GO:0001654 | UniProtAcc | NA |
Top |
Malignant transformation analysis |
| Identification of the aberrant gene expression in precancerous and cancerous lesions by comparing the gene expression of stem-like cells in diseased tissues with normal stem cells |
| Entrez ID | Symbol | Replicates | Species | Organ | Tissue | Adj P-value | Log2FC | Malignancy |
| 27151 | CPAMD8 | RNA-P6T1-P6T1-3 | Human | Lung | MIAC | 3.80e-03 | 6.38e-01 | -0.0296 |
| 27151 | CPAMD8 | RNA-P6T1-P6T1-4 | Human | Lung | MIAC | 2.32e-05 | 7.38e-01 | -0.0263 |
| 27151 | CPAMD8 | RNA-P6T2-P6T2-1 | Human | Lung | IAC | 1.90e-15 | 5.09e-01 | -0.0166 |
| 27151 | CPAMD8 | RNA-P6T2-P6T2-2 | Human | Lung | IAC | 4.09e-13 | 4.57e-01 | -0.0132 |
| 27151 | CPAMD8 | RNA-P6T2-P6T2-3 | Human | Lung | IAC | 1.97e-23 | 6.15e-01 | -0.013 |
| 27151 | CPAMD8 | RNA-P6T2-P6T2-4 | Human | Lung | IAC | 1.27e-04 | 2.97e-01 | -0.0121 |
| Page: 1 |
| Tissue | Expression Dynamics | Abbreviation |
| Lung | 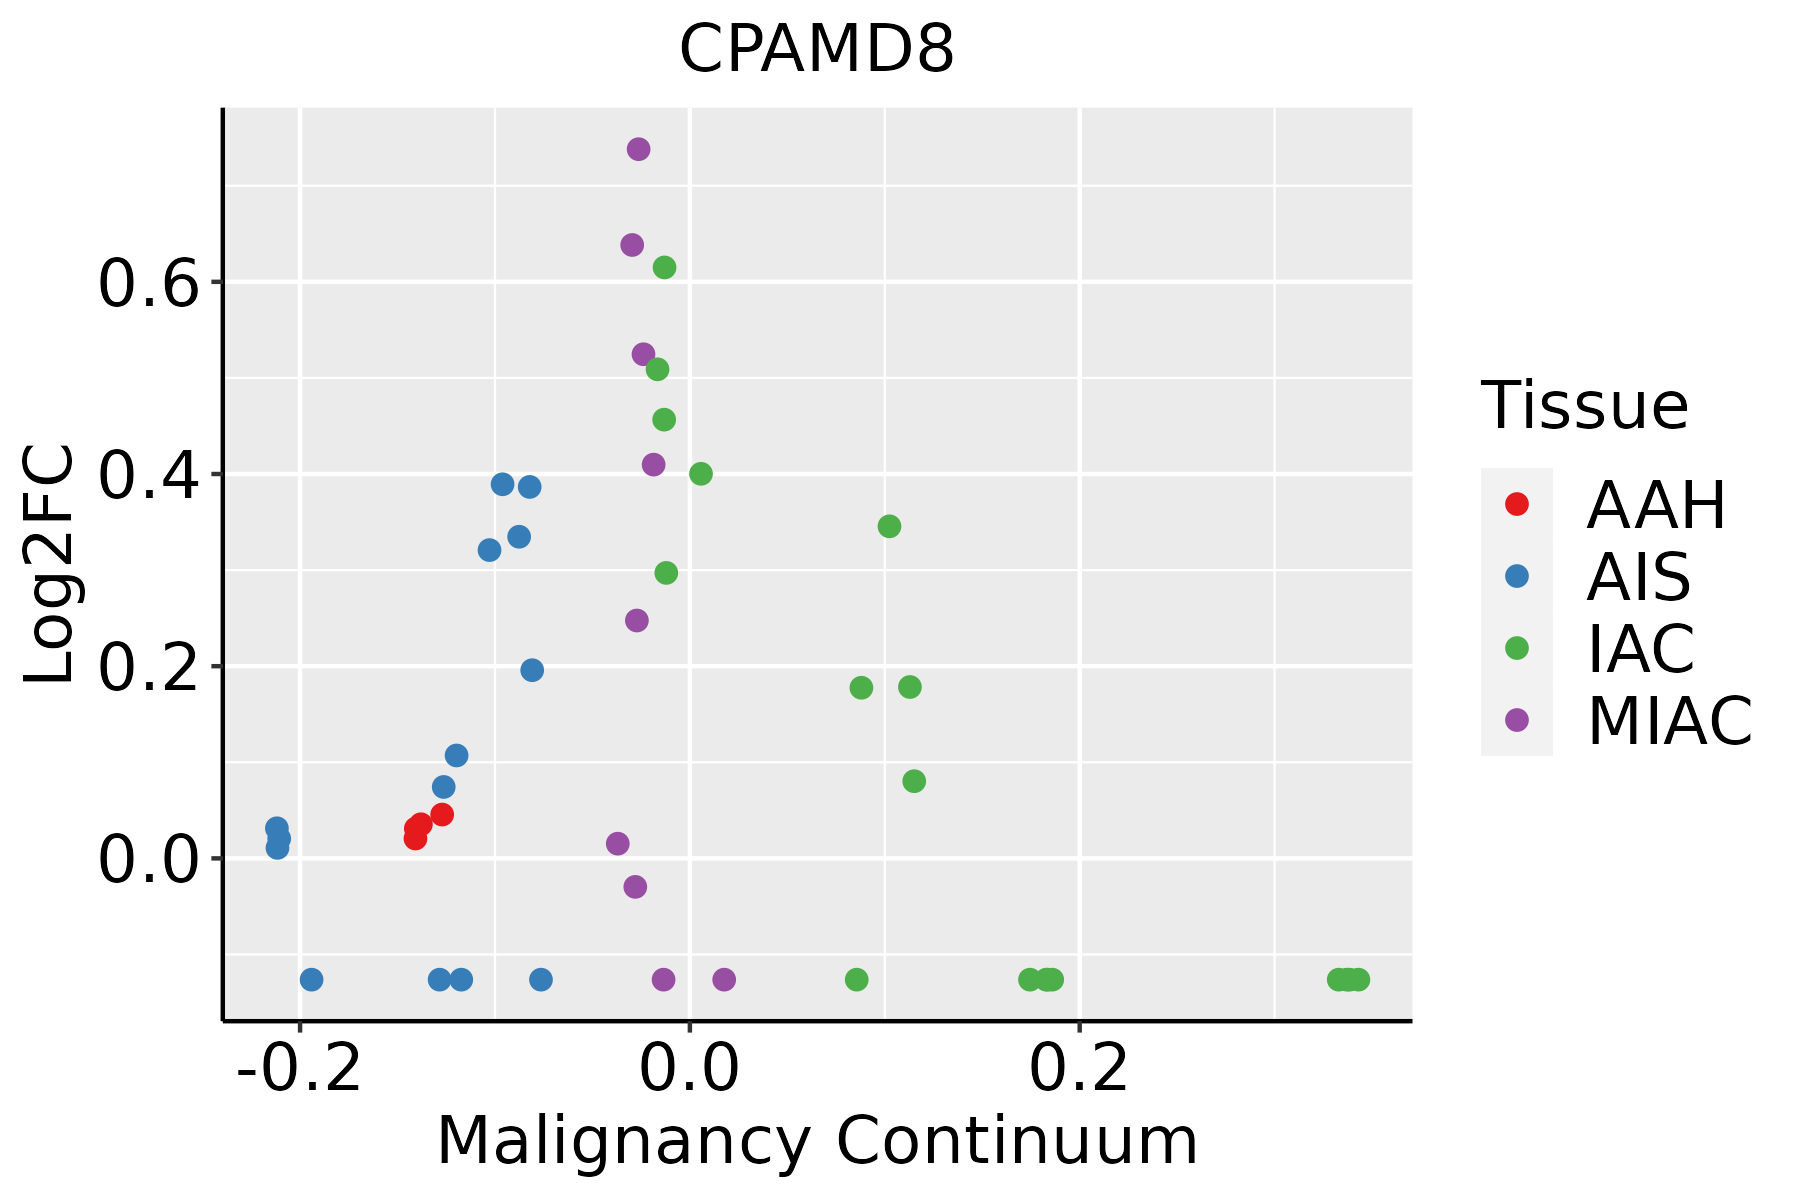 | AAH: Atypical adenomatous hyperplasia |
| AIS: Adenocarcinoma in situ | ||
| IAC: Invasive lung adenocarcinoma | ||
| MIA: Minimally invasive adenocarcinoma |
| ∗log2FC in expression of this searched gene in stem-like cells from each diseased tissue sample relative to stem-like cells in normal samples in each tissue plotted against the malignancy continuum. Samples are colored based on if they are from different disease stage. |
Top |
Malignant transformation related pathway analysis |
| Find out the enriched GO biological processes and KEGG pathways involved in transition from healthy to precancer to cancer |
| Tissue | Disease Stage | Enriched GO biological Processes |
| Colorectum | AD |  |
| Colorectum | SER |  |
| Colorectum | MSS |  |
| Colorectum | MSI-H |  |
| Colorectum | FAP |  |
| ∗Top 15 enriched GO BP terms are showed in the bar plot of each disease state in each tissue. Each row represents a significant GO biological process which is colored according to the -log10(p.adjust). |
| Page: 1 2 3 4 5 6 7 8 9 |
| GO ID | Tissue | Disease Stage | Description | Gene Ratio | Bg Ratio | pvalue | p.adjust | Count |
| GO:00525478 | Lung | IAC | regulation of peptidase activity | 80/2061 | 461/18723 | 2.39e-05 | 6.50e-04 | 80 |
| GO:00525488 | Lung | IAC | regulation of endopeptidase activity | 75/2061 | 432/18723 | 4.18e-05 | 1.01e-03 | 75 |
| GO:00458618 | Lung | IAC | negative regulation of proteolysis | 58/2061 | 351/18723 | 1.04e-03 | 1.24e-02 | 58 |
| GO:00109518 | Lung | IAC | negative regulation of endopeptidase activity | 41/2061 | 252/18723 | 6.84e-03 | 4.75e-02 | 41 |
| Page: 1 |
| Pathway ID | Tissue | Disease Stage | Description | Gene Ratio | Bg Ratio | pvalue | p.adjust | qvalue | Count |
| Page: 1 |
Top |
Cell-cell communication analysis |
| Identification of potential cell-cell interactions between two cell types and their ligand-receptor pairs for different disease states |
| Ligand | Receptor | LRpair | Pathway | Tissue | Disease Stage |
| Page: 1 |
Top |
Single-cell gene regulatory network inference analysis |
| Find out the significant the regulons (TFs) and the target genes of each regulon across cell types for different disease states |
| TF | Cell Type | Tissue | Disease Stage | Target Gene | RSS | Regulon Activity |
| ∗The dot plots of a searched regulon are shown for all cell subpopulations in each disease state of each tissue based on the regulon specific score inferred using pySCENIC and by calculating the average expression. |
| Page: 1 |
Top |
Somatic mutation of malignant transformation related genes |
| Annotation of somatic variants for genes involved in malignant transformation |
| Hugo Symbol | Variant Class | Variant Classification | dbSNP RS | HGVSc | HGVSp | HGVSp Short | SWISSPROT | BIOTYPE | SIFT | PolyPhen | Tumor Sample Barcode | Tissue | Histology | Sex | Age | Stage | Therapy Types | Drugs | Outcome |
| CPAMD8 | SNV | Missense_Mutation | c.4336G>T | p.Val1446Leu | p.V1446L | Q8IZJ3 | protein_coding | tolerated(0.05) | benign(0.018) | TCGA-A1-A0SO-01 | Breast | breast invasive carcinoma | Female | >=65 | I/II | Chemotherapy | SD | ||
| CPAMD8 | SNV | Missense_Mutation | c.399C>G | p.Ile133Met | p.I133M | Q8IZJ3 | protein_coding | deleterious(0.01) | possibly_damaging(0.76) | TCGA-A2-A04V-01 | Breast | breast invasive carcinoma | Female | <65 | I/II | Chemotherapy | cytoxan | PD | |
| CPAMD8 | SNV | Missense_Mutation | rs373943547 | c.1786N>A | p.Val596Met | p.V596M | Q8IZJ3 | protein_coding | deleterious(0) | probably_damaging(0.999) | TCGA-A2-A0CT-01 | Breast | breast invasive carcinoma | Female | >=65 | I/II | Chemotherapy | cytoxan | SD |
| CPAMD8 | SNV | Missense_Mutation | novel | c.2543N>A | p.Thr848Asn | p.T848N | Q8IZJ3 | protein_coding | deleterious(0.01) | probably_damaging(0.999) | TCGA-A2-A4S2-01 | Breast | breast invasive carcinoma | Female | <65 | III/IV | Chemotherapy | adriamycin | CR |
| CPAMD8 | SNV | Missense_Mutation | c.4295N>C | p.Leu1432Pro | p.L1432P | Q8IZJ3 | protein_coding | deleterious(0) | probably_damaging(0.989) | TCGA-A8-A075-01 | Breast | breast invasive carcinoma | Female | <65 | I/II | Chemotherapy | epirubicin | CR | |
| CPAMD8 | SNV | Missense_Mutation | c.3817N>G | p.Ile1273Val | p.I1273V | Q8IZJ3 | protein_coding | tolerated(0.08) | benign(0.071) | TCGA-A8-A09Z-01 | Breast | breast invasive carcinoma | Female | >=65 | I/II | Unknown | Unknown | SD | |
| CPAMD8 | SNV | Missense_Mutation | c.2690N>A | p.Val897Asp | p.V897D | Q8IZJ3 | protein_coding | deleterious(0) | possibly_damaging(0.886) | TCGA-B6-A0I8-01 | Breast | breast invasive carcinoma | Female | <65 | I/II | Unknown | Unknown | PD | |
| CPAMD8 | SNV | Missense_Mutation | novel | c.4540N>G | p.Thr1514Ala | p.T1514A | Q8IZJ3 | protein_coding | tolerated(0.19) | benign(0.06) | TCGA-BH-A0AY-01 | Breast | breast invasive carcinoma | Female | <65 | I/II | Chemotherapy | SD | |
| CPAMD8 | SNV | Missense_Mutation | novel | c.1270N>C | p.Glu424Gln | p.E424Q | Q8IZJ3 | protein_coding | tolerated(0.32) | benign(0.359) | TCGA-BH-A0B0-01 | Breast | breast invasive carcinoma | Female | <65 | I/II | Chemotherapy | adriamycin | CR |
| CPAMD8 | SNV | Missense_Mutation | novel | c.1889N>C | p.Phe630Ser | p.F630S | Q8IZJ3 | protein_coding | deleterious(0) | probably_damaging(0.999) | TCGA-BH-A0HK-01 | Breast | breast invasive carcinoma | Female | >=65 | I/II | Hormone Therapy | arimidex | SD |
| Page: 1 2 3 4 5 6 7 8 9 10 11 12 13 14 15 16 17 18 19 20 21 22 23 24 |
Top |
Related drugs of malignant transformation related genes |
| Identification of chemicals and drugs interact with genes involved in malignant transfromation |
| (DGIdb 4.0) |
| Entrez ID | Symbol | Category | Interaction Types | Drug Claim Name | Drug Name | PMIDs |
| Page: 1 |

Copyright 2023-Present -The University of Texas Health Science Center at Houston |