
|
|||||
|
 | |
| |
| |
| |
| |
| |
|
Gene: CPA6 |
Gene summary for CPA6 |
| Gene information | Species | Human | Gene symbol | CPA6 | Gene ID | 57094 |
| Gene name | carboxypeptidase A6 | |
| Gene Alias | CPAH | |
| Cytomap | 8q13.2 | |
| Gene Type | protein-coding | GO ID | GO:0006508 | UniProtAcc | Q8N4T0 |
Top |
Malignant transformation analysis |
| Identification of the aberrant gene expression in precancerous and cancerous lesions by comparing the gene expression of stem-like cells in diseased tissues with normal stem cells |
| Entrez ID | Symbol | Replicates | Species | Organ | Tissue | Adj P-value | Log2FC | Malignancy |
| 57094 | CPA6 | CA_HPV_3 | Human | Cervix | CC | 3.60e-05 | 1.37e-01 | 0.0414 |
| 57094 | CPA6 | CCI_1 | Human | Cervix | CC | 6.47e-09 | 1.05e+00 | 0.528 |
| 57094 | CPA6 | CCI_3 | Human | Cervix | CC | 3.69e-19 | 8.87e-01 | 0.516 |
| 57094 | CPA6 | HTA11_3410_2000001011 | Human | Colorectum | AD | 6.55e-07 | -4.77e-01 | 0.0155 |
| 57094 | CPA6 | HTA11_2487_2000001011 | Human | Colorectum | SER | 2.09e-23 | -1.12e+00 | -0.1808 |
| 57094 | CPA6 | HTA11_2951_2000001011 | Human | Colorectum | AD | 5.73e-04 | -8.86e-01 | 0.0216 |
| 57094 | CPA6 | HTA11_1938_2000001011 | Human | Colorectum | AD | 7.40e-19 | -1.11e+00 | -0.0811 |
| 57094 | CPA6 | HTA11_78_2000001011 | Human | Colorectum | AD | 1.44e-26 | -1.10e+00 | -0.1088 |
| 57094 | CPA6 | HTA11_347_2000001011 | Human | Colorectum | AD | 1.36e-03 | 7.28e-01 | -0.1954 |
| 57094 | CPA6 | HTA11_2112_2000001011 | Human | Colorectum | SER | 8.99e-03 | -8.38e-01 | -0.2196 |
| 57094 | CPA6 | HTA11_3361_2000001011 | Human | Colorectum | AD | 2.39e-13 | -9.20e-01 | -0.1207 |
| 57094 | CPA6 | HTA11_83_2000001011 | Human | Colorectum | SER | 7.13e-16 | -1.04e+00 | -0.1526 |
| 57094 | CPA6 | HTA11_696_2000001011 | Human | Colorectum | AD | 4.00e-16 | -6.64e-01 | -0.1464 |
| 57094 | CPA6 | HTA11_866_2000001011 | Human | Colorectum | AD | 4.54e-19 | -7.99e-01 | -0.1001 |
| 57094 | CPA6 | HTA11_1391_2000001011 | Human | Colorectum | AD | 9.51e-38 | -1.17e+00 | -0.059 |
| 57094 | CPA6 | HTA11_2992_2000001011 | Human | Colorectum | SER | 3.96e-04 | 4.85e-01 | -0.1706 |
| 57094 | CPA6 | HTA11_5212_2000001011 | Human | Colorectum | AD | 1.14e-06 | -8.81e-01 | -0.2061 |
| 57094 | CPA6 | HTA11_9408_2000001011 | Human | Colorectum | AD | 3.12e-05 | -9.81e-01 | 0.0451 |
| 57094 | CPA6 | HTA11_8622_2000001021 | Human | Colorectum | SER | 6.25e-09 | -1.01e+00 | 0.0528 |
| 57094 | CPA6 | HTA11_7663_2000001011 | Human | Colorectum | SER | 1.12e-12 | -1.36e+00 | 0.0131 |
| Page: 1 2 3 4 |
| Tissue | Expression Dynamics | Abbreviation |
| Cervix | 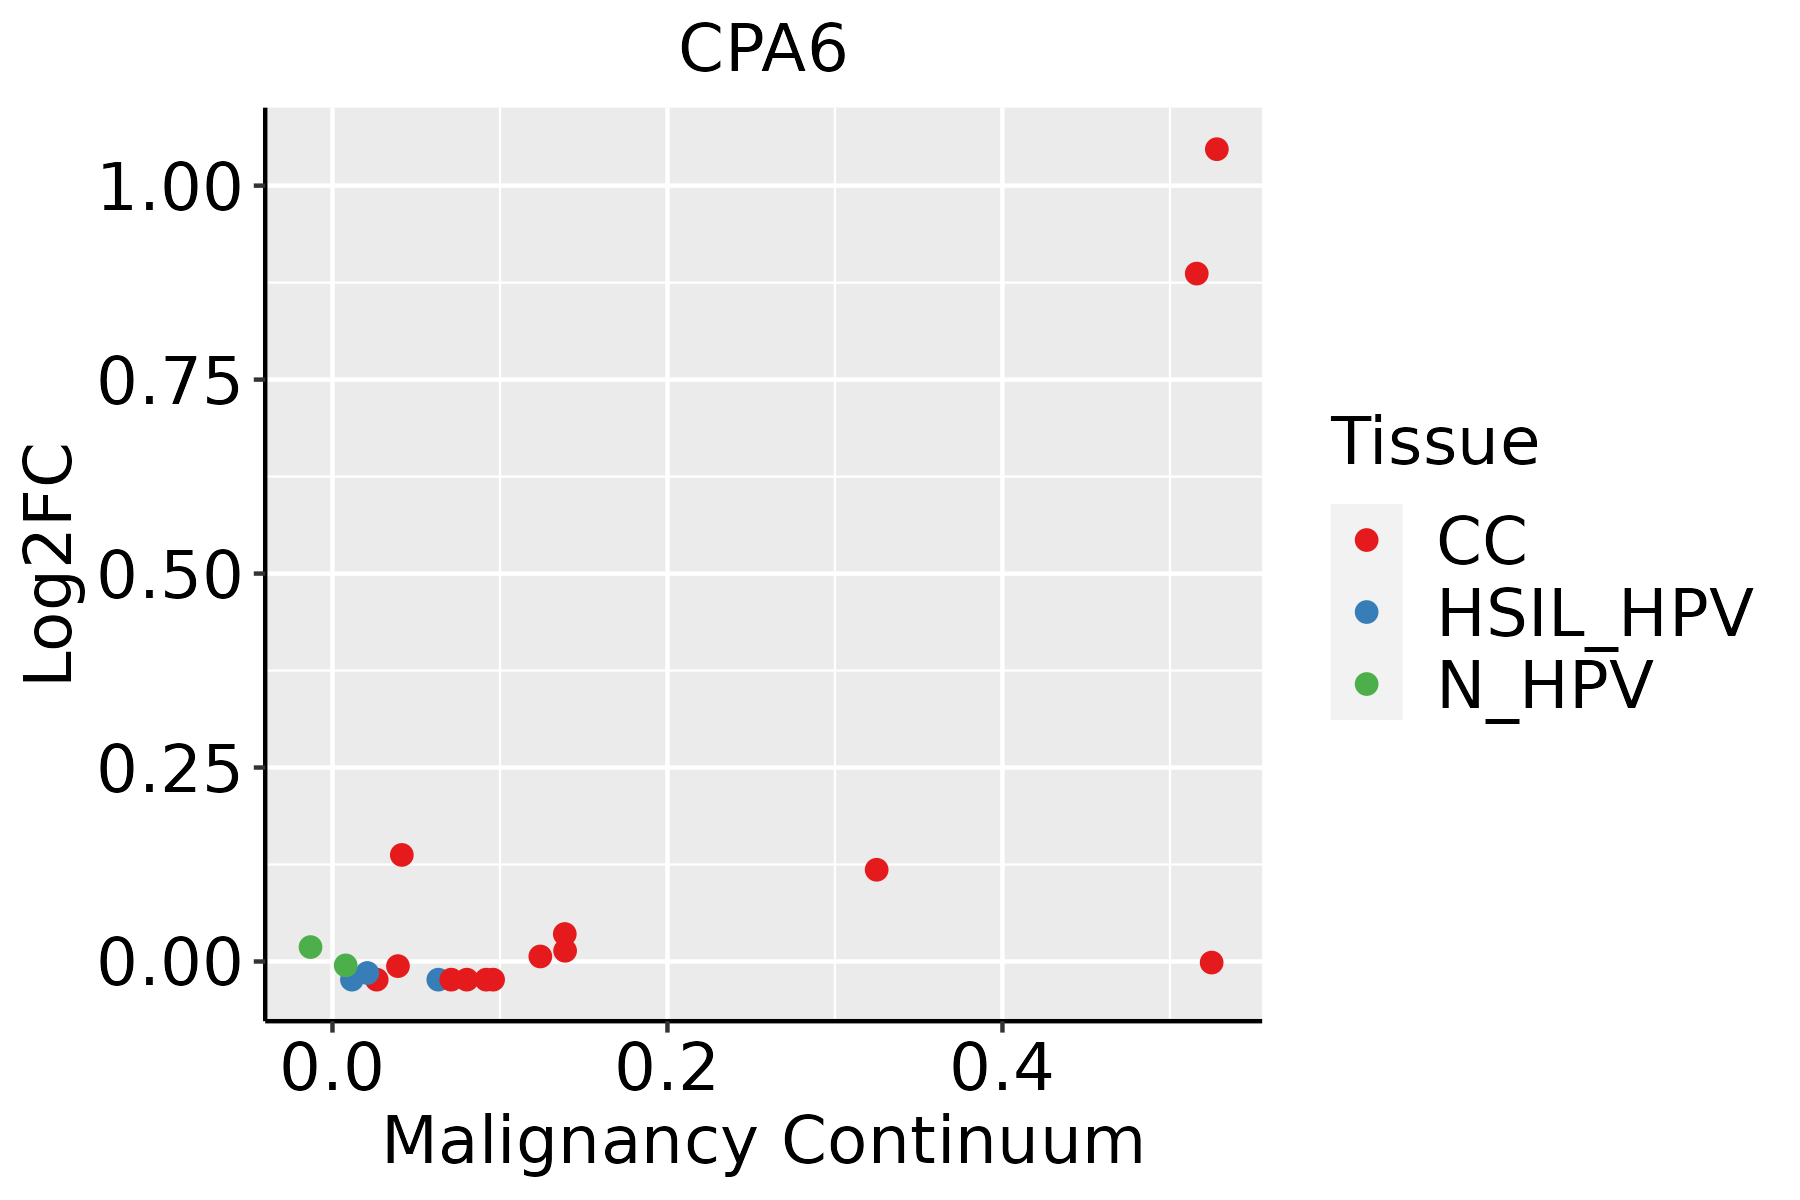 | CC: Cervix cancer |
| HSIL_HPV: HPV-infected high-grade squamous intraepithelial lesions | ||
| N_HPV: HPV-infected normal cervix | ||
| Colorectum (GSE201348) |  | FAP: Familial adenomatous polyposis |
| CRC: Colorectal cancer | ||
| Colorectum (HTA11) |  | AD: Adenomas |
| SER: Sessile serrated lesions | ||
| MSI-H: Microsatellite-high colorectal cancer | ||
| MSS: Microsatellite stable colorectal cancer | ||
| Lung |  | AAH: Atypical adenomatous hyperplasia |
| AIS: Adenocarcinoma in situ | ||
| IAC: Invasive lung adenocarcinoma | ||
| MIA: Minimally invasive adenocarcinoma | ||
| Oral Cavity | 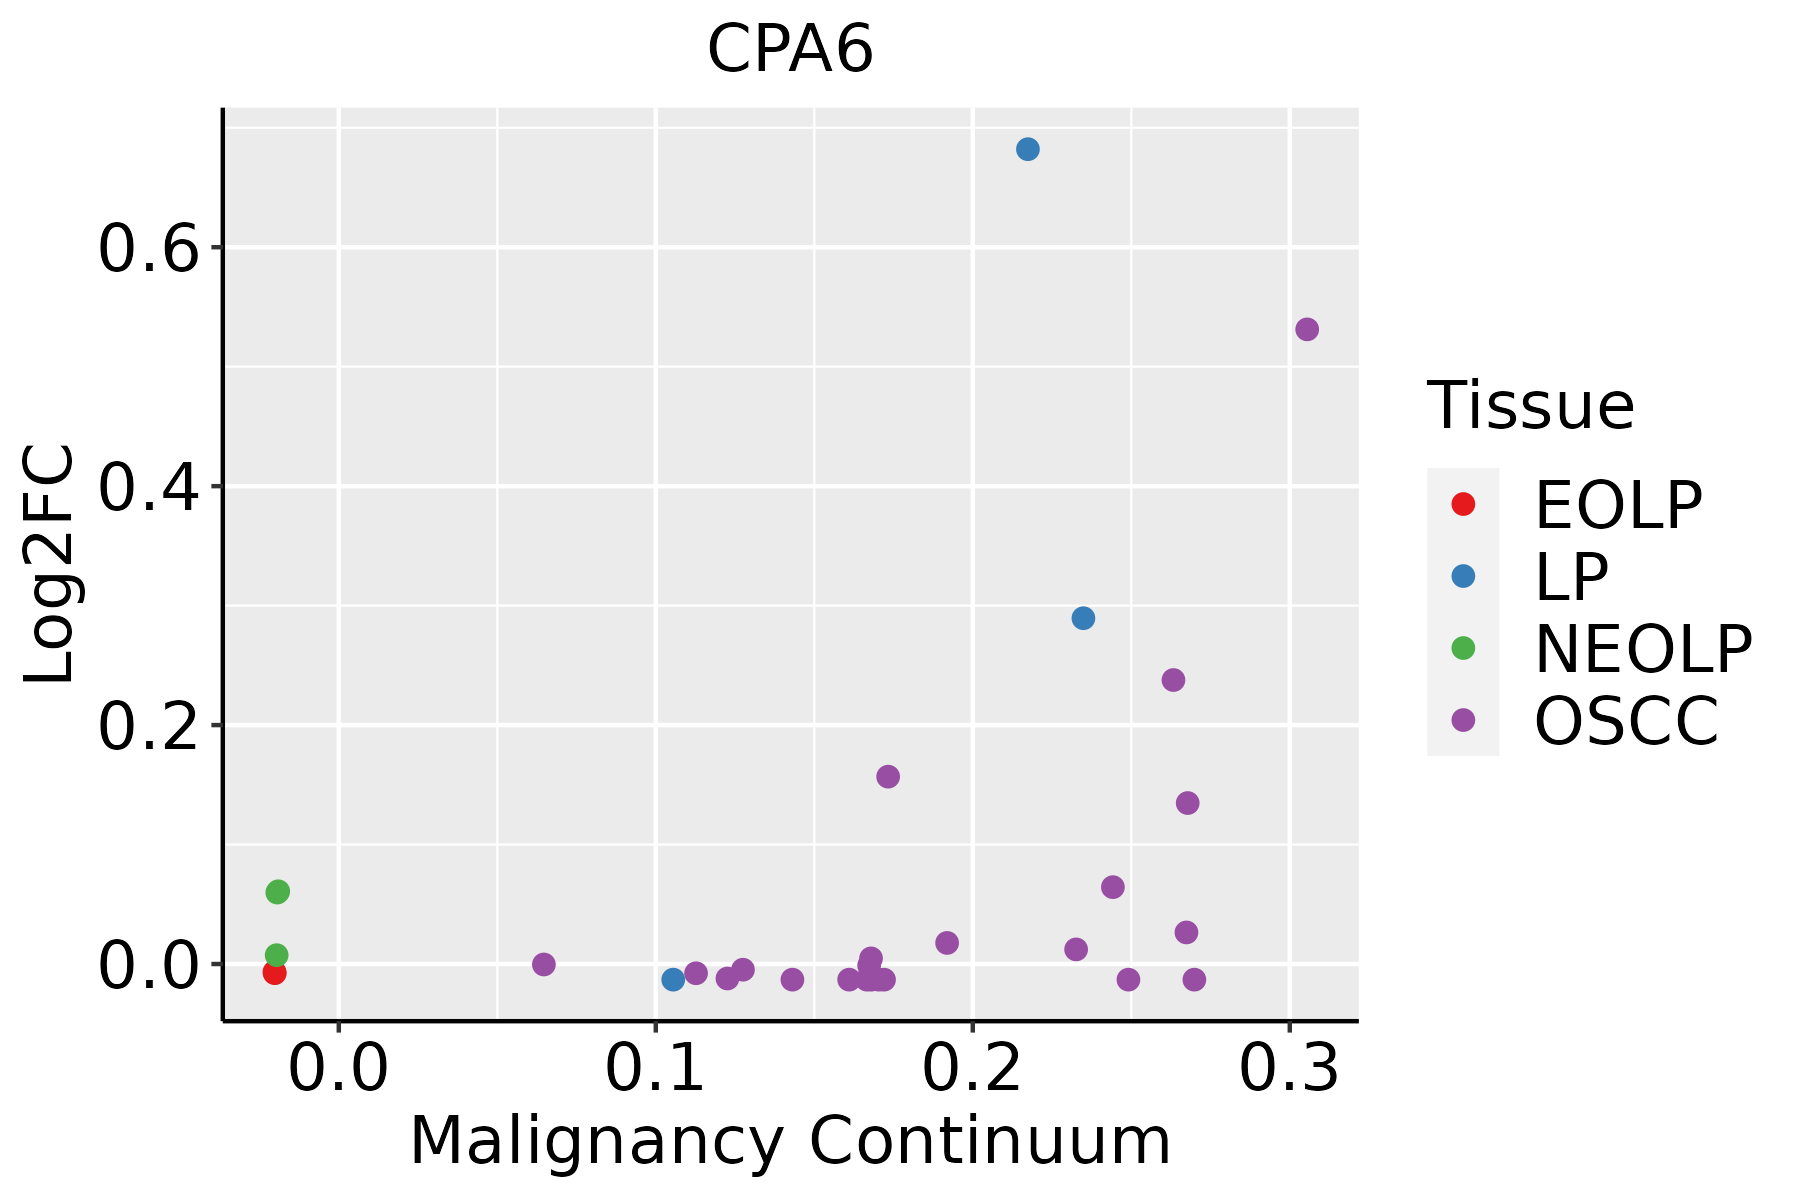 | EOLP: Erosive Oral lichen planus |
| LP: leukoplakia | ||
| NEOLP: Non-erosive oral lichen planus | ||
| OSCC: Oral squamous cell carcinoma | ||
| Prostate | 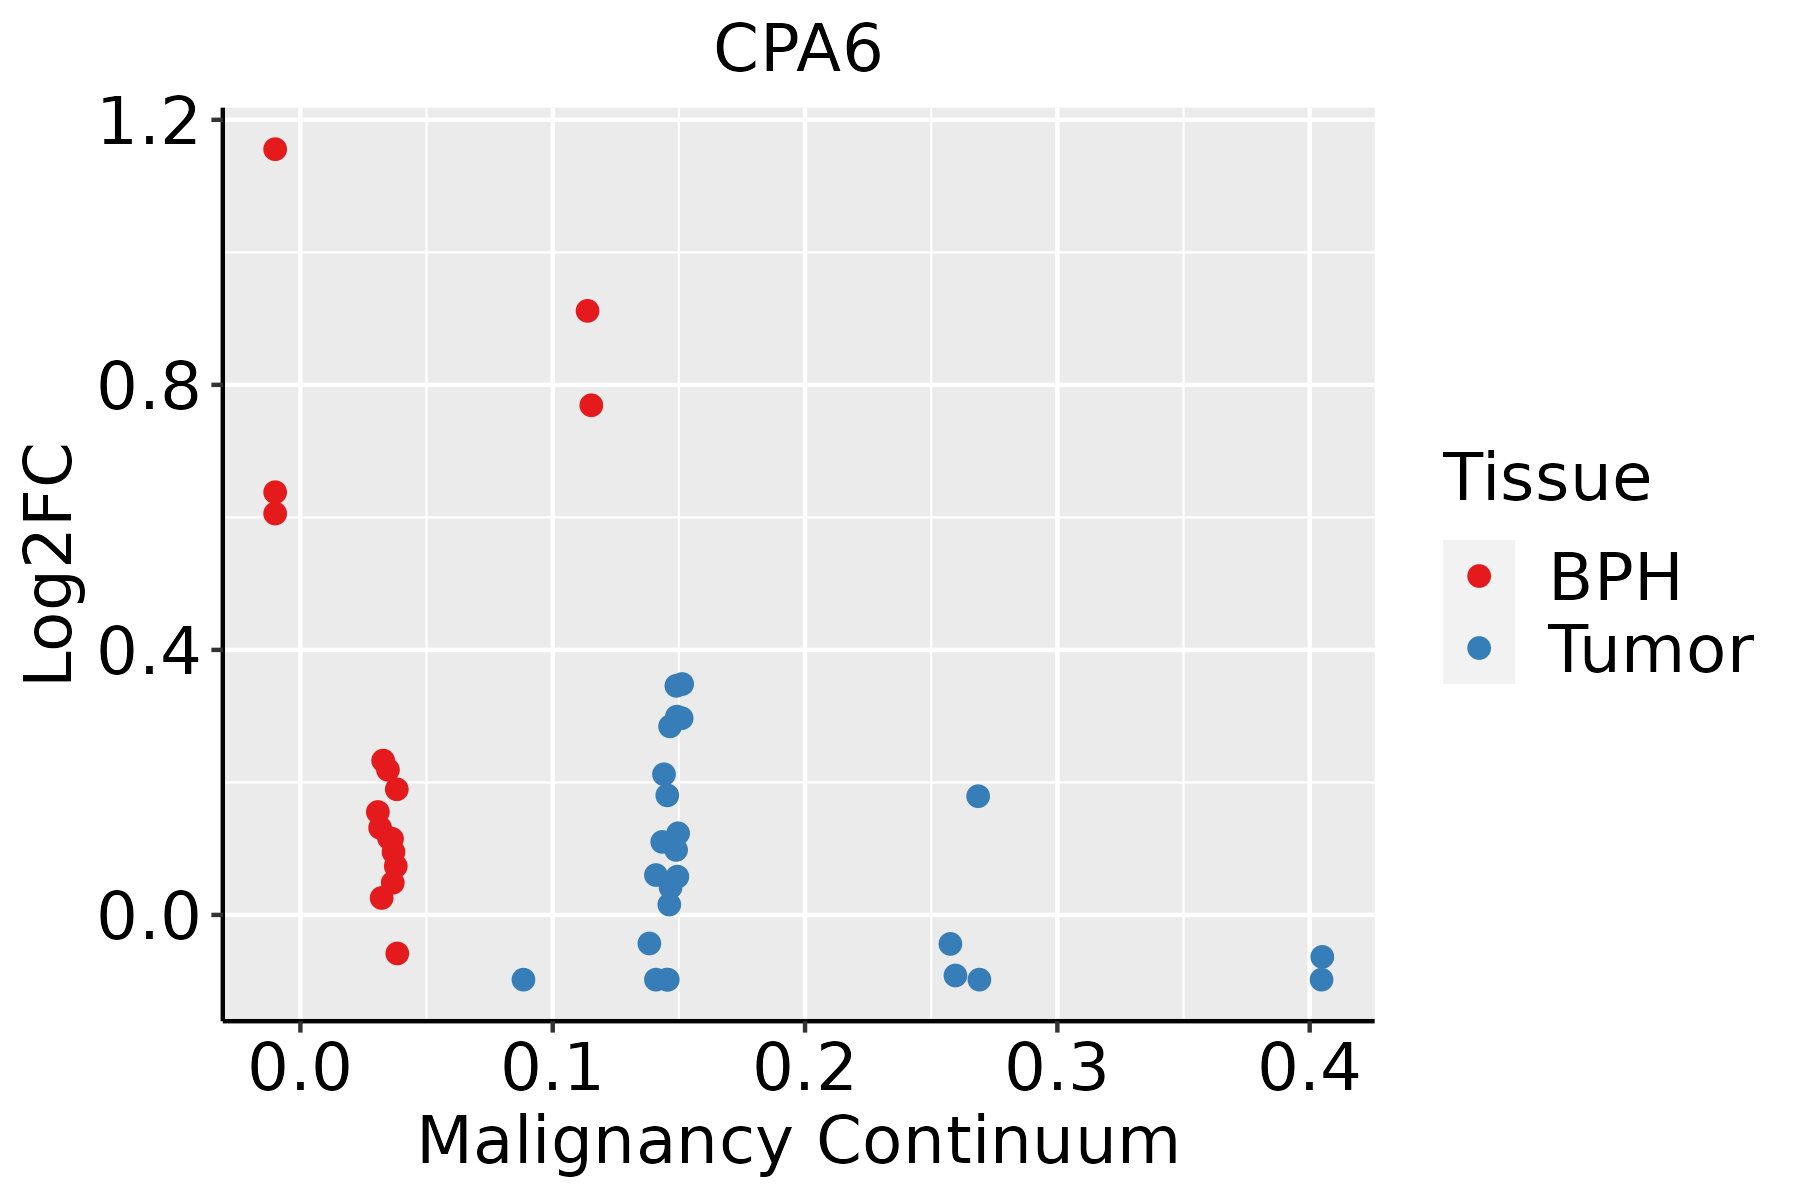 | BPH: Benign Prostatic Hyperplasia |
| ∗log2FC in expression of this searched gene in stem-like cells from each diseased tissue sample relative to stem-like cells in normal samples in each tissue plotted against the malignancy continuum. Samples are colored based on if they are from different disease stage. |
Top |
Malignant transformation related pathway analysis |
| Find out the enriched GO biological processes and KEGG pathways involved in transition from healthy to precancer to cancer |
| Tissue | Disease Stage | Enriched GO biological Processes |
| Colorectum | AD |  |
| Colorectum | SER |  |
| Colorectum | MSS |  |
| Colorectum | MSI-H |  |
| Colorectum | FAP |  |
| ∗Top 15 enriched GO BP terms are showed in the bar plot of each disease state in each tissue. Each row represents a significant GO biological process which is colored according to the -log10(p.adjust). |
| Page: 1 2 3 4 5 6 7 8 9 |
| GO ID | Tissue | Disease Stage | Description | Gene Ratio | Bg Ratio | pvalue | p.adjust | Count |
| Page: 1 |
| Pathway ID | Tissue | Disease Stage | Description | Gene Ratio | Bg Ratio | pvalue | p.adjust | qvalue | Count |
| Page: 1 |
Top |
Cell-cell communication analysis |
| Identification of potential cell-cell interactions between two cell types and their ligand-receptor pairs for different disease states |
| Ligand | Receptor | LRpair | Pathway | Tissue | Disease Stage |
| Page: 1 |
Top |
Single-cell gene regulatory network inference analysis |
| Find out the significant the regulons (TFs) and the target genes of each regulon across cell types for different disease states |
| TF | Cell Type | Tissue | Disease Stage | Target Gene | RSS | Regulon Activity |
| ∗The dot plots of a searched regulon are shown for all cell subpopulations in each disease state of each tissue based on the regulon specific score inferred using pySCENIC and by calculating the average expression. |
| Page: 1 |
Top |
Somatic mutation of malignant transformation related genes |
| Annotation of somatic variants for genes involved in malignant transformation |
| Hugo Symbol | Variant Class | Variant Classification | dbSNP RS | HGVSc | HGVSp | HGVSp Short | SWISSPROT | BIOTYPE | SIFT | PolyPhen | Tumor Sample Barcode | Tissue | Histology | Sex | Age | Stage | Therapy Types | Drugs | Outcome |
| CPA6 | SNV | Missense_Mutation | novel | c.652N>G | p.Lys218Glu | p.K218E | Q8N4T0 | protein_coding | tolerated(0.11) | benign(0.003) | TCGA-A2-A3XT-01 | Breast | breast invasive carcinoma | Female | <65 | I/II | Chemotherapy | cyclophosphamide | PR |
| CPA6 | SNV | Missense_Mutation | c.289N>C | p.Phe97Leu | p.F97L | Q8N4T0 | protein_coding | tolerated(0.68) | benign(0.009) | TCGA-A8-A09Z-01 | Breast | breast invasive carcinoma | Female | >=65 | I/II | Unknown | Unknown | SD | |
| CPA6 | SNV | Missense_Mutation | novel | c.850N>C | p.Ser284Pro | p.S284P | Q8N4T0 | protein_coding | deleterious(0) | probably_damaging(1) | TCGA-AN-A0FL-01 | Breast | breast invasive carcinoma | Female | <65 | I/II | Unknown | Unknown | SD |
| CPA6 | insertion | Frame_Shift_Ins | novel | c.1088_1089insAT | p.Val364TrpfsTer15 | p.V364Wfs*15 | Q8N4T0 | protein_coding | TCGA-AQ-A04J-01 | Breast | breast invasive carcinoma | Female | <65 | I/II | Chemotherapy | cytoxan | SD | ||
| CPA6 | insertion | Nonsense_Mutation | novel | c.1086_1087insTGAGGCACAGAGAAGTTACCCACTATGTGGTA | p.Gly363Ter | p.G363* | Q8N4T0 | protein_coding | TCGA-AQ-A04J-01 | Breast | breast invasive carcinoma | Female | <65 | I/II | Chemotherapy | cytoxan | SD | ||
| CPA6 | SNV | Missense_Mutation | novel | c.696N>A | p.Phe232Leu | p.F232L | Q8N4T0 | protein_coding | deleterious(0) | benign(0.271) | TCGA-2W-A8YY-01 | Cervix | cervical & endocervical cancer | Female | <65 | I/II | Chemotherapy | cisplatin | CR |
| CPA6 | SNV | Missense_Mutation | c.13G>A | p.Gly5Arg | p.G5R | Q8N4T0 | protein_coding | tolerated_low_confidence(0.14) | benign(0.003) | TCGA-C5-A1BN-01 | Cervix | cervical & endocervical cancer | Female | <65 | I/II | Chemotherapy | cisplatin | PD | |
| CPA6 | SNV | Missense_Mutation | c.470N>T | p.Ser157Leu | p.S157L | Q8N4T0 | protein_coding | deleterious(0) | possibly_damaging(0.724) | TCGA-LP-A5U2-01 | Cervix | cervical & endocervical cancer | Female | <65 | III/IV | Unknown | Unknown | SD | |
| CPA6 | SNV | Missense_Mutation | c.94C>T | p.Leu32Phe | p.L32F | Q8N4T0 | protein_coding | tolerated(0.68) | benign(0.406) | TCGA-A6-6781-01 | Colorectum | colon adenocarcinoma | Male | <65 | III/IV | Chemotherapy | oxaliplatin | SD | |
| CPA6 | SNV | Missense_Mutation | rs756306763 | c.254N>G | p.His85Arg | p.H85R | Q8N4T0 | protein_coding | tolerated(1) | benign(0.01) | TCGA-AA-3492-01 | Colorectum | colon adenocarcinoma | Female | >=65 | I/II | Unknown | Unknown | SD |
| Page: 1 2 3 4 5 6 7 |
Top |
Related drugs of malignant transformation related genes |
| Identification of chemicals and drugs interact with genes involved in malignant transfromation |
| (DGIdb 4.0) |
| Entrez ID | Symbol | Category | Interaction Types | Drug Claim Name | Drug Name | PMIDs |
| 57094 | CPA6 | DRUGGABLE GENOME, PROTEASE, ENZYME | metformin | METFORMIN | 29650774 |
| Page: 1 |

Copyright 2023-Present -The University of Texas Health Science Center at Houston |