| Tissue | Expression Dynamics | Abbreviation |
| Esophagus | 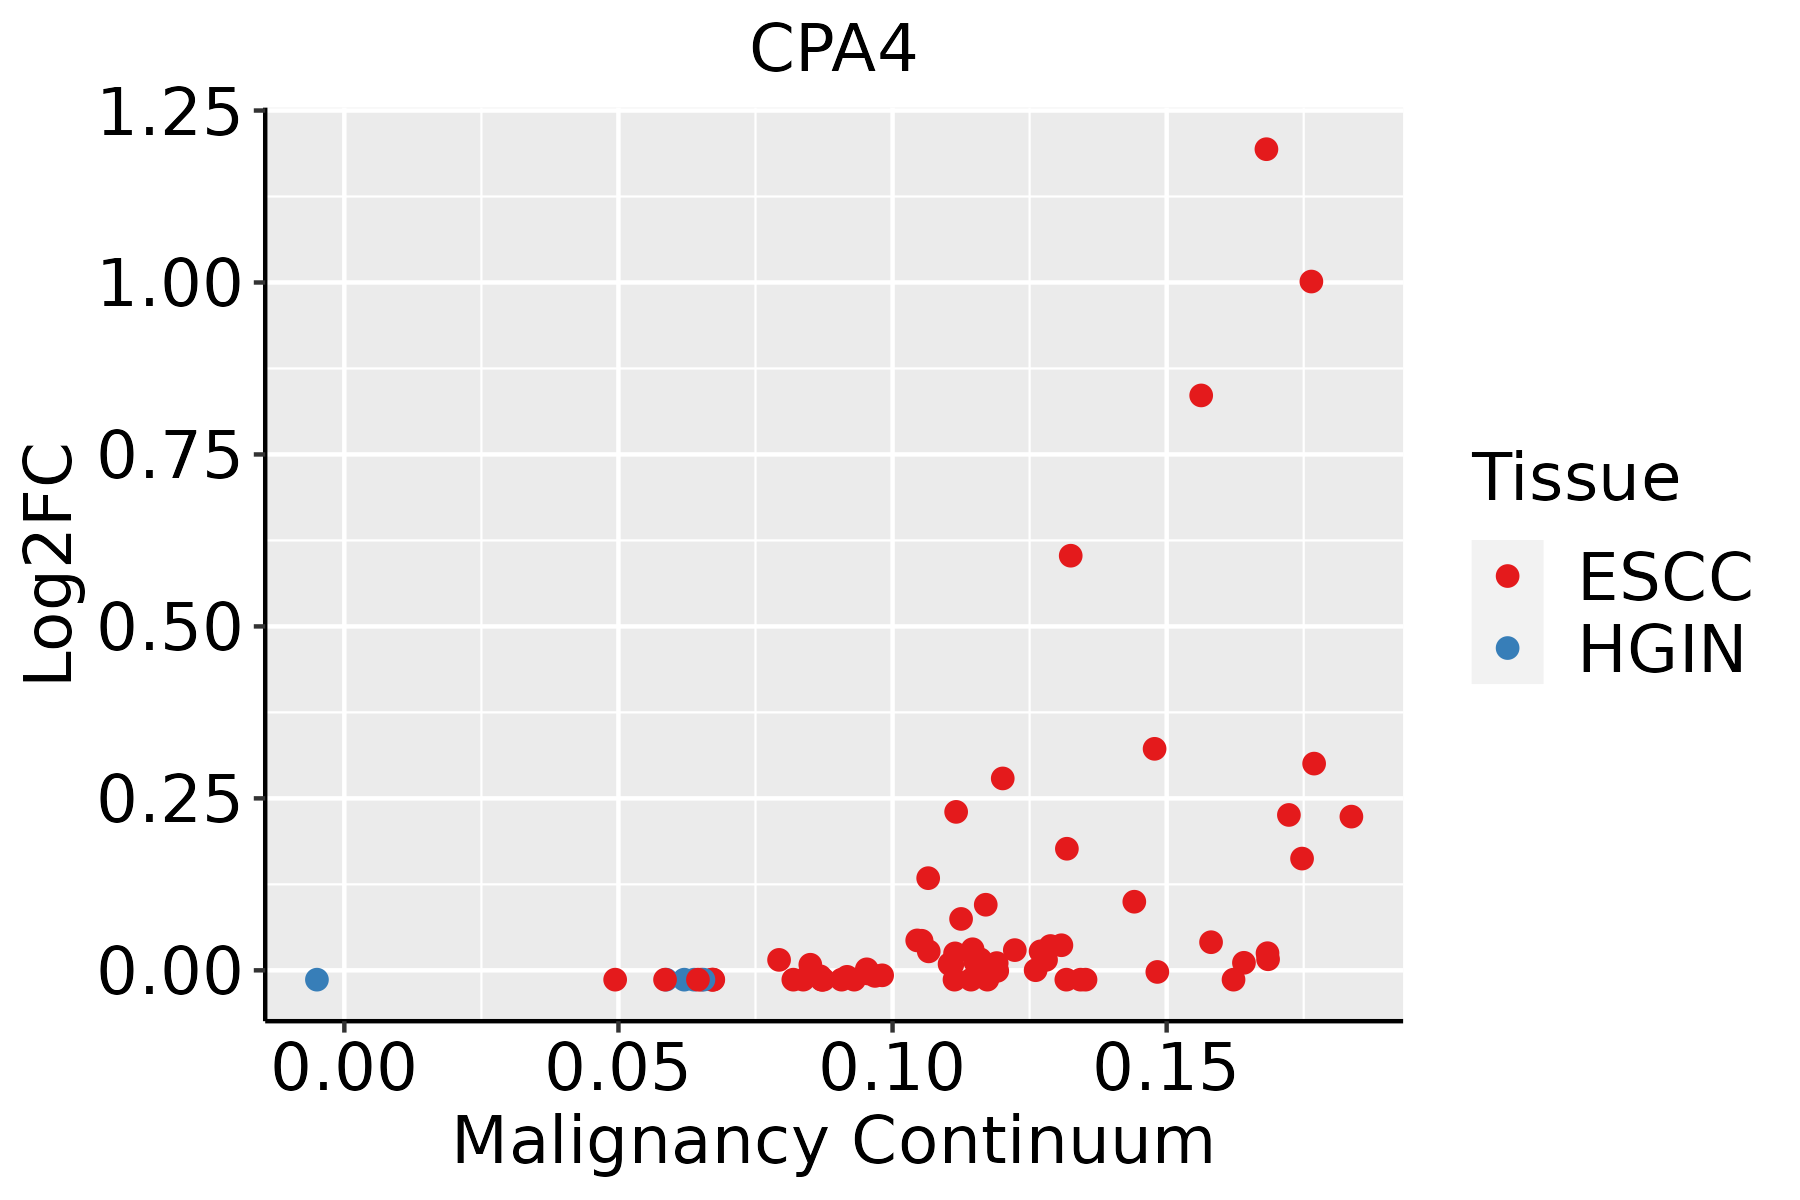 | ESCC: Esophageal squamous cell carcinoma |
| HGIN: High-grade intraepithelial neoplasias |
| LGIN: Low-grade intraepithelial neoplasias |
| Oral Cavity |  | EOLP: Erosive Oral lichen planus |
| LP: leukoplakia |
| NEOLP: Non-erosive oral lichen planus |
| OSCC: Oral squamous cell carcinoma |
| Thyroid | 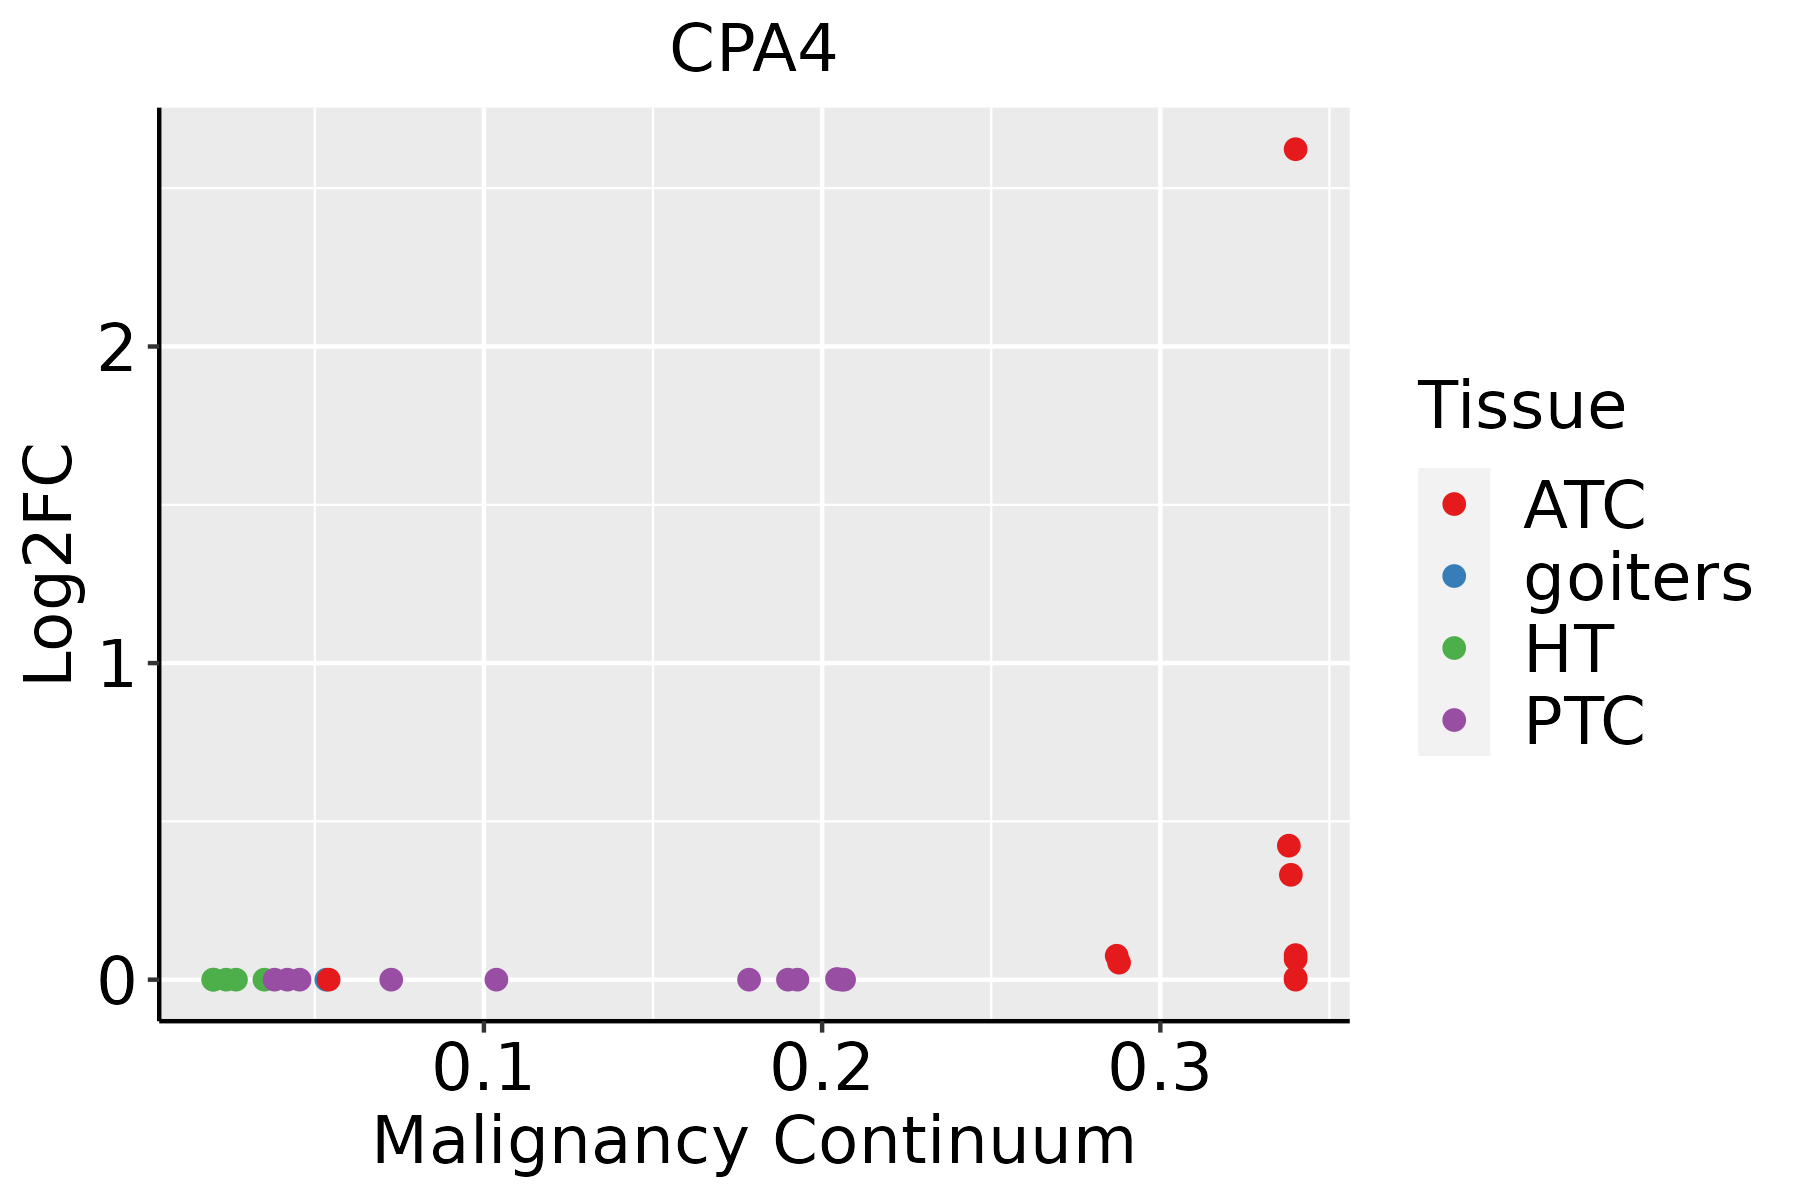 | ATC: Anaplastic thyroid cancer |
| HT: Hashimoto's thyroiditis |
| PTC: Papillary thyroid cancer |
| GO ID | Tissue | Disease Stage | Description | Gene Ratio | Bg Ratio | pvalue | p.adjust | Count |
| GO:001657015 | Esophagus | ESCC | histone modification | 323/8552 | 463/18723 | 2.61e-26 | 7.88e-24 | 323 |
| GO:001820514 | Esophagus | ESCC | peptidyl-lysine modification | 259/8552 | 376/18723 | 3.90e-20 | 5.26e-18 | 259 |
| GO:001839413 | Esophagus | ESCC | peptidyl-lysine acetylation | 123/8552 | 169/18723 | 6.58e-13 | 2.94e-11 | 123 |
| GO:004354313 | Esophagus | ESCC | protein acylation | 165/8552 | 243/18723 | 1.69e-12 | 7.14e-11 | 165 |
| GO:000647313 | Esophagus | ESCC | protein acetylation | 140/8552 | 201/18723 | 4.37e-12 | 1.69e-10 | 140 |
| GO:001839313 | Esophagus | ESCC | internal peptidyl-lysine acetylation | 114/8552 | 158/18723 | 1.16e-11 | 4.24e-10 | 114 |
| GO:000647513 | Esophagus | ESCC | internal protein amino acid acetylation | 115/8552 | 160/18723 | 1.43e-11 | 5.08e-10 | 115 |
| GO:00165735 | Esophagus | ESCC | histone acetylation | 110/8552 | 152/18723 | 1.95e-11 | 6.81e-10 | 110 |
| GO:00165707 | Oral cavity | OSCC | histone modification | 270/7305 | 463/18723 | 1.59e-17 | 1.50e-15 | 270 |
| GO:00182056 | Oral cavity | OSCC | peptidyl-lysine modification | 216/7305 | 376/18723 | 2.32e-13 | 1.16e-11 | 216 |
| GO:00435434 | Oral cavity | OSCC | protein acylation | 149/7305 | 243/18723 | 1.33e-12 | 5.80e-11 | 149 |
| GO:00183944 | Oral cavity | OSCC | peptidyl-lysine acetylation | 108/7305 | 169/18723 | 4.55e-11 | 1.45e-09 | 108 |
| GO:00064734 | Oral cavity | OSCC | protein acetylation | 124/7305 | 201/18723 | 5.59e-11 | 1.74e-09 | 124 |
| GO:00165734 | Oral cavity | OSCC | histone acetylation | 96/7305 | 152/18723 | 1.35e-09 | 3.29e-08 | 96 |
| GO:00183934 | Oral cavity | OSCC | internal peptidyl-lysine acetylation | 99/7305 | 158/18723 | 1.41e-09 | 3.39e-08 | 99 |
| GO:00064754 | Oral cavity | OSCC | internal protein amino acid acetylation | 100/7305 | 160/18723 | 1.43e-09 | 3.41e-08 | 100 |
| GO:001657017 | Thyroid | ATC | histone modification | 243/6293 | 463/18723 | 2.23e-17 | 2.27e-15 | 243 |
| GO:001820516 | Thyroid | ATC | peptidyl-lysine modification | 193/6293 | 376/18723 | 6.92e-13 | 3.06e-11 | 193 |
| GO:000647315 | Thyroid | ATC | protein acetylation | 116/6293 | 201/18723 | 1.75e-12 | 7.33e-11 | 116 |
| GO:004354315 | Thyroid | ATC | protein acylation | 134/6293 | 243/18723 | 3.46e-12 | 1.40e-10 | 134 |
| Hugo Symbol | Variant Class | Variant Classification | dbSNP RS | HGVSc | HGVSp | HGVSp Short | SWISSPROT | BIOTYPE | SIFT | PolyPhen | Tumor Sample Barcode | Tissue | Histology | Sex | Age | Stage | Therapy Types | Drugs | Outcome |
| CPA4 | SNV | Missense_Mutation | novel | c.714N>T | p.Trp238Cys | p.W238C | Q9UI42 | protein_coding | deleterious(0) | probably_damaging(1) | TCGA-5L-AAT1-01 | Breast | breast invasive carcinoma | Female | <65 | III/IV | Hormone Therapy | letrozol | SD |
| CPA4 | insertion | Nonsense_Mutation | novel | c.550_551insTAATGACATAAATTACATAAAAATCCAGTTGAATGAATA | p.Glu184delinsValMetThrTerIleThrTerLysSerSerTerMetAsnLys | p.E184delinsVMT*IT*KSS*MNK | Q9UI42 | protein_coding | | | TCGA-A2-A04V-01 | Breast | breast invasive carcinoma | Female | <65 | I/II | Chemotherapy | cytoxan | PD |
| CPA4 | insertion | Nonsense_Mutation | novel | c.578_579insCTCACTGTA | p.Trp193delinsCysSerLeuTer | p.W193delinsCSL* | Q9UI42 | protein_coding | | | TCGA-A2-A0CQ-01 | Breast | breast invasive carcinoma | Female | <65 | I/II | Chemotherapy | adriamycin | SD |
| CPA4 | SNV | Missense_Mutation | rs372031946 | c.202G>A | p.Val68Ile | p.V68I | Q9UI42 | protein_coding | tolerated(0.07) | possibly_damaging(0.489) | TCGA-VS-A94Z-01 | Cervix | cervical & endocervical cancer | Female | <65 | I/II | Chemotherapy | cisplatin | CR |
| CPA4 | SNV | Missense_Mutation | | c.60N>C | p.Lys20Asn | p.K20N | Q9UI42 | protein_coding | tolerated(0.6) | benign(0.003) | TCGA-AA-A010-01 | Colorectum | colon adenocarcinoma | Female | <65 | I/II | Chemotherapy | folinic | CR |
| CPA4 | SNV | Missense_Mutation | novel | c.827T>C | p.Val276Ala | p.V276A | Q9UI42 | protein_coding | deleterious(0.02) | benign(0.013) | TCGA-AA-A01I-01 | Colorectum | colon adenocarcinoma | Male | >=65 | I/II | Unknown | Unknown | SD |
| CPA4 | SNV | Missense_Mutation | rs368498370 | c.1004N>T | p.Ala335Val | p.A335V | Q9UI42 | protein_coding | deleterious(0.04) | benign(0.374) | TCGA-AZ-4315-01 | Colorectum | colon adenocarcinoma | Male | <65 | I/II | Unknown | Unknown | SD |
| CPA4 | SNV | Missense_Mutation | rs367921847 | c.466N>T | p.Arg156Trp | p.R156W | Q9UI42 | protein_coding | deleterious(0.01) | probably_damaging(0.937) | TCGA-D5-6924-01 | Colorectum | colon adenocarcinoma | Male | >=65 | I/II | Unknown | Unknown | SD |
| CPA4 | SNV | Missense_Mutation | novel | c.1004N>A | p.Ala335Glu | p.A335E | Q9UI42 | protein_coding | deleterious(0) | probably_damaging(0.976) | TCGA-CI-6621-01 | Colorectum | rectum adenocarcinoma | Male | <65 | III/IV | Unknown | Unknown | SD |
| CPA4 | insertion | In_Frame_Ins | novel | c.486_486+1insCATGAAAGA | p.Lys162_Phe163insHisGluArg | p.K162_F163insHER | Q9UI42 | protein_coding | | | TCGA-AM-5820-01 | Colorectum | colon adenocarcinoma | Female | <65 | I/II | Unknown | Unknown | SD |


