
|
|||||
|
 | |
| |
| |
| |
| |
| |
|
Gene: CPA3 |
Gene summary for CPA3 |
| Gene information | Species | Human | Gene symbol | CPA3 | Gene ID | 1359 |
| Gene name | carboxypeptidase A3 | |
| Gene Alias | MC-CPA | |
| Cytomap | 3q24 | |
| Gene Type | protein-coding | GO ID | GO:0001990 | UniProtAcc | P15088 |
Top |
Malignant transformation analysis |
| Identification of the aberrant gene expression in precancerous and cancerous lesions by comparing the gene expression of stem-like cells in diseased tissues with normal stem cells |
| Entrez ID | Symbol | Replicates | Species | Organ | Tissue | Adj P-value | Log2FC | Malignancy |
| 1359 | CPA3 | CA_HPV_1 | Human | Cervix | CC | 1.86e-23 | -1.01e+00 | 0.0264 |
| 1359 | CPA3 | CA_HPV_3 | Human | Cervix | CC | 3.09e-06 | -6.46e-01 | 0.0414 |
| 1359 | CPA3 | N_HPV_2 | Human | Cervix | N_HPV | 6.87e-11 | -8.17e-01 | -0.0131 |
| 1359 | CPA3 | CCI_1 | Human | Cervix | CC | 2.58e-06 | -1.25e+00 | 0.528 |
| 1359 | CPA3 | CCI_2 | Human | Cervix | CC | 1.08e-05 | -1.25e+00 | 0.5249 |
| 1359 | CPA3 | CCI_3 | Human | Cervix | CC | 8.25e-09 | -1.25e+00 | 0.516 |
| 1359 | CPA3 | CCII_1 | Human | Cervix | CC | 1.23e-12 | -1.25e+00 | 0.3249 |
| 1359 | CPA3 | Tumor | Human | Cervix | CC | 3.62e-31 | -1.24e+00 | 0.1241 |
| 1359 | CPA3 | sample1 | Human | Cervix | CC | 2.19e-10 | -1.25e+00 | 0.0959 |
| 1359 | CPA3 | sample3 | Human | Cervix | CC | 8.28e-32 | -1.25e+00 | 0.1387 |
| 1359 | CPA3 | H2 | Human | Cervix | HSIL_HPV | 8.44e-35 | -1.14e+00 | 0.0632 |
| 1359 | CPA3 | L1 | Human | Cervix | CC | 5.78e-14 | -1.25e+00 | 0.0802 |
| 1359 | CPA3 | T1 | Human | Cervix | CC | 1.52e-24 | -1.24e+00 | 0.0918 |
| 1359 | CPA3 | T2 | Human | Cervix | CC | 3.83e-07 | -1.23e+00 | 0.0709 |
| 1359 | CPA3 | T3 | Human | Cervix | CC | 1.30e-32 | -1.25e+00 | 0.1389 |
| 1359 | CPA3 | EOLP-1 | Human | Oral cavity | EOLP | 6.09e-21 | 1.01e+00 | -0.0202 |
| 1359 | CPA3 | EOLP-2 | Human | Oral cavity | EOLP | 1.04e-41 | 1.33e+00 | -0.0203 |
| 1359 | CPA3 | NEOLP-1 | Human | Oral cavity | NEOLP | 3.02e-09 | 6.36e-01 | -0.0194 |
| 1359 | CPA3 | SYSMH5 | Human | Oral cavity | OSCC | 5.90e-05 | -2.60e-02 | 0.0647 |
| Page: 1 |
| Tissue | Expression Dynamics | Abbreviation |
| Cervix |  | CC: Cervix cancer |
| HSIL_HPV: HPV-infected high-grade squamous intraepithelial lesions | ||
| N_HPV: HPV-infected normal cervix | ||
| Oral Cavity | 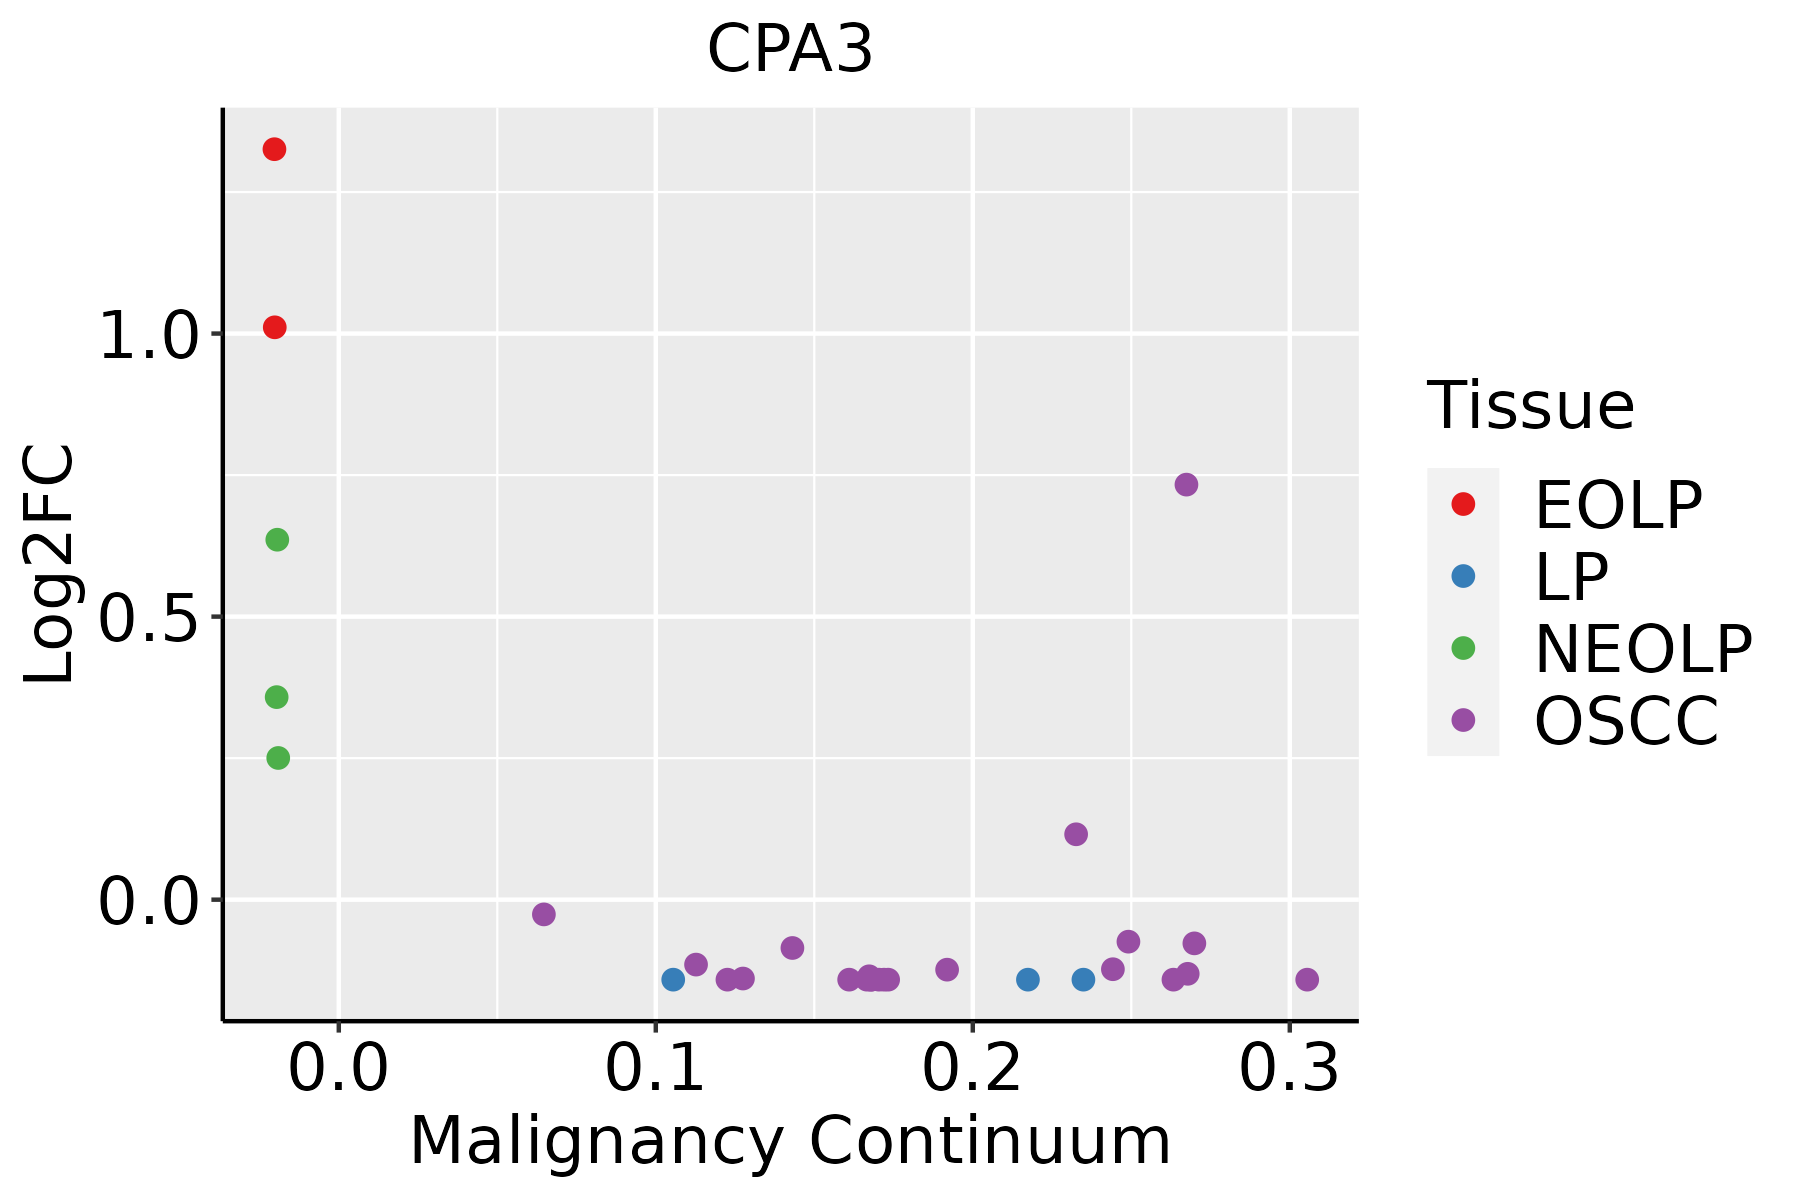 | EOLP: Erosive Oral lichen planus |
| LP: leukoplakia | ||
| NEOLP: Non-erosive oral lichen planus | ||
| OSCC: Oral squamous cell carcinoma |
| ∗log2FC in expression of this searched gene in stem-like cells from each diseased tissue sample relative to stem-like cells in normal samples in each tissue plotted against the malignancy continuum. Samples are colored based on if they are from different disease stage. |
Top |
Malignant transformation related pathway analysis |
| Find out the enriched GO biological processes and KEGG pathways involved in transition from healthy to precancer to cancer |
| Tissue | Disease Stage | Enriched GO biological Processes |
| Colorectum | AD |  |
| Colorectum | SER |  |
| Colorectum | MSS |  |
| Colorectum | MSI-H |  |
| Colorectum | FAP |  |
| ∗Top 15 enriched GO BP terms are showed in the bar plot of each disease state in each tissue. Each row represents a significant GO biological process which is colored according to the -log10(p.adjust). |
| Page: 1 2 3 4 5 6 7 8 9 |
| GO ID | Tissue | Disease Stage | Description | Gene Ratio | Bg Ratio | pvalue | p.adjust | Count |
| GO:00516048 | Cervix | CC | protein maturation | 56/2311 | 294/18723 | 5.90e-04 | 5.59e-03 | 56 |
| GO:005160414 | Cervix | N_HPV | protein maturation | 20/534 | 294/18723 | 3.17e-04 | 4.75e-03 | 20 |
| GO:00164854 | Cervix | N_HPV | protein processing | 15/534 | 225/18723 | 2.09e-03 | 2.00e-02 | 15 |
| GO:005160410 | Oral cavity | OSCC | protein maturation | 170/7305 | 294/18723 | 3.97e-11 | 1.28e-09 | 170 |
| GO:00164856 | Oral cavity | OSCC | protein processing | 121/7305 | 225/18723 | 4.56e-06 | 5.23e-05 | 121 |
| GO:005160423 | Oral cavity | EOLP | protein maturation | 50/2218 | 294/18723 | 5.32e-03 | 2.77e-02 | 50 |
| GO:005160432 | Oral cavity | NEOLP | protein maturation | 50/2005 | 294/18723 | 6.46e-04 | 5.47e-03 | 50 |
| GO:001648521 | Oral cavity | NEOLP | protein processing | 39/2005 | 225/18723 | 1.68e-03 | 1.17e-02 | 39 |
| GO:0016486 | Oral cavity | NEOLP | peptide hormone processing | 8/2005 | 24/18723 | 2.59e-03 | 1.63e-02 | 8 |
| GO:0140448 | Oral cavity | NEOLP | signaling receptor ligand precursor processing | 8/2005 | 25/18723 | 3.46e-03 | 2.05e-02 | 8 |
| Page: 1 |
| Pathway ID | Tissue | Disease Stage | Description | Gene Ratio | Bg Ratio | pvalue | p.adjust | qvalue | Count |
| Page: 1 |
Top |
Cell-cell communication analysis |
| Identification of potential cell-cell interactions between two cell types and their ligand-receptor pairs for different disease states |
| Ligand | Receptor | LRpair | Pathway | Tissue | Disease Stage |
| Page: 1 |
Top |
Single-cell gene regulatory network inference analysis |
| Find out the significant the regulons (TFs) and the target genes of each regulon across cell types for different disease states |
| TF | Cell Type | Tissue | Disease Stage | Target Gene | RSS | Regulon Activity |
| ∗The dot plots of a searched regulon are shown for all cell subpopulations in each disease state of each tissue based on the regulon specific score inferred using pySCENIC and by calculating the average expression. |
| Page: 1 |
Top |
Somatic mutation of malignant transformation related genes |
| Annotation of somatic variants for genes involved in malignant transformation |
| Hugo Symbol | Variant Class | Variant Classification | dbSNP RS | HGVSc | HGVSp | HGVSp Short | SWISSPROT | BIOTYPE | SIFT | PolyPhen | Tumor Sample Barcode | Tissue | Histology | Sex | Age | Stage | Therapy Types | Drugs | Outcome |
| CPA3 | SNV | Missense_Mutation | novel | c.938N>A | p.Pro313His | p.P313H | P15088 | protein_coding | deleterious(0.02) | probably_damaging(1) | TCGA-AN-A046-01 | Breast | breast invasive carcinoma | Female | >=65 | I/II | Unknown | Unknown | SD |
| CPA3 | SNV | Missense_Mutation | c.388N>C | p.Glu130Gln | p.E130Q | P15088 | protein_coding | tolerated(0.49) | benign(0.019) | TCGA-C5-A1MH-01 | Cervix | cervical & endocervical cancer | Female | >=65 | III/IV | Chemotherapy | cisplatin | PD | |
| CPA3 | SNV | Missense_Mutation | c.283G>T | p.Asp95Tyr | p.D95Y | P15088 | protein_coding | deleterious(0) | probably_damaging(0.997) | TCGA-Q1-A73O-01 | Cervix | cervical & endocervical cancer | Female | <65 | I/II | Chemotherapy | cisplatin | CR | |
| CPA3 | SNV | Missense_Mutation | c.569N>C | p.Val190Ala | p.V190A | P15088 | protein_coding | deleterious(0.03) | probably_damaging(1) | TCGA-AA-3663-01 | Colorectum | colon adenocarcinoma | Male | <65 | I/II | Unknown | Unknown | SD | |
| CPA3 | SNV | Missense_Mutation | c.261N>T | p.Met87Ile | p.M87I | P15088 | protein_coding | tolerated(1) | benign(0.005) | TCGA-AY-A54L-01 | Colorectum | colon adenocarcinoma | Female | >=65 | I/II | Unknown | Unknown | PD | |
| CPA3 | SNV | Missense_Mutation | c.965C>G | p.Pro322Arg | p.P322R | P15088 | protein_coding | deleterious(0.04) | possibly_damaging(0.78) | TCGA-F4-6570-01 | Colorectum | colon adenocarcinoma | Female | >=65 | I/II | Unknown | Unknown | SD | |
| CPA3 | SNV | Missense_Mutation | rs753756118 | c.206N>A | p.Arg69Gln | p.R69Q | P15088 | protein_coding | tolerated(0.1) | benign(0.06) | TCGA-AG-A002-01 | Colorectum | rectum adenocarcinoma | Male | <65 | I/II | Unknown | Unknown | SD |
| CPA3 | SNV | Missense_Mutation | novel | c.1127C>T | p.Ala376Val | p.A376V | P15088 | protein_coding | tolerated(0.06) | benign(0.251) | TCGA-AJ-A3EK-01 | Endometrium | uterine corpus endometrioid carcinoma | Female | <65 | I/II | Chemotherapy | carboplatin | CR |
| CPA3 | SNV | Missense_Mutation | c.1220N>G | p.Phe407Cys | p.F407C | P15088 | protein_coding | tolerated(0.1) | possibly_damaging(0.706) | TCGA-AX-A0J0-01 | Endometrium | uterine corpus endometrioid carcinoma | Female | <65 | I/II | Unknown | Unknown | SD | |
| CPA3 | SNV | Missense_Mutation | c.761T>G | p.Phe254Cys | p.F254C | P15088 | protein_coding | deleterious(0) | probably_damaging(0.999) | TCGA-B5-A0JY-01 | Endometrium | uterine corpus endometrioid carcinoma | Female | <65 | III/IV | Chemotherapy | doxorubicin | SD |
| Page: 1 2 3 4 5 6 7 |
Top |
Related drugs of malignant transformation related genes |
| Identification of chemicals and drugs interact with genes involved in malignant transfromation |
| (DGIdb 4.0) |
| Entrez ID | Symbol | Category | Interaction Types | Drug Claim Name | Drug Name | PMIDs |
| Page: 1 |

Copyright 2023-Present -The University of Texas Health Science Center at Houston |