
|
|||||
|
 | |
| |
| |
| |
| |
| |
|
Gene: CPA1 |
Gene summary for CPA1 |
| Gene information | Species | Human | Gene symbol | CPA1 | Gene ID | 1357 |
| Gene name | carboxypeptidase A1 | |
| Gene Alias | CPA | |
| Cytomap | 7q32.2 | |
| Gene Type | protein-coding | GO ID | GO:0006082 | UniProtAcc | P15085 |
Top |
Malignant transformation analysis |
| Identification of the aberrant gene expression in precancerous and cancerous lesions by comparing the gene expression of stem-like cells in diseased tissues with normal stem cells |
| Entrez ID | Symbol | Replicates | Species | Organ | Tissue | Adj P-value | Log2FC | Malignancy |
| 1357 | CPA1 | S014 | Human | Liver | HCC | 3.64e-16 | 6.22e-01 | 0.2254 |
| 1357 | CPA1 | S015 | Human | Liver | HCC | 2.75e-17 | 9.00e-01 | 0.2375 |
| 1357 | CPA1 | S016 | Human | Liver | HCC | 1.09e-17 | 6.10e-01 | 0.2243 |
| 1357 | CPA1 | HTA12-15-2 | Human | Pancreas | PDAC | 2.63e-53 | -2.61e+00 | 0.2315 |
| 1357 | CPA1 | HTA12-23-1 | Human | Pancreas | PDAC | 9.09e-39 | -2.61e+00 | 0.3405 |
| 1357 | CPA1 | HTA12-25-1 | Human | Pancreas | PDAC | 2.08e-52 | -2.61e+00 | 0.313 |
| 1357 | CPA1 | HTA12-26-1 | Human | Pancreas | PDAC | 7.53e-62 | -2.61e+00 | 0.3728 |
| 1357 | CPA1 | HTA12-29-1 | Human | Pancreas | PDAC | 2.80e-133 | -2.61e+00 | 0.3722 |
| 1357 | CPA1 | HTA12-3-16 | Human | Pancreas | PDAC | 2.87e-15 | -2.61e+00 | 0.1553 |
| 1357 | CPA1 | HTA12-30-1 | Human | Pancreas | PDAC | 8.73e-16 | -2.27e+00 | 0.3671 |
| 1357 | CPA1 | HTA12-32-1 | Human | Pancreas | PDAC | 9.07e-26 | -2.48e+00 | 0.3624 |
| 1357 | CPA1 | HTA12-9-1 | Human | Pancreas | PDAC | 3.70e-78 | -2.39e+00 | 0.1532 |
| 1357 | CPA1 | HTA12-9-2 | Human | Pancreas | PDAC | 2.56e-06 | -2.62e-01 | 0.0835 |
| 1357 | CPA1 | HTA12-9-3 | Human | Pancreas | PDAC | 7.05e-45 | -2.61e+00 | 0.2045 |
| 1357 | CPA1 | 4347-EC | Human | Pancreas | PanIN | 1.25e-40 | -2.06e-01 | 0.0572 |
| 1357 | CPA1 | 4741-EC2 | Human | Pancreas | PanIN | 1.62e-03 | 6.31e-02 | 0.0194 |
| 1357 | CPA1 | 181429 | Human | Pancreas | PDAC | 3.62e-26 | -2.61e+00 | 0.1416 |
| 1357 | CPA1 | 61354830 | Human | Pancreas | PDAC | 9.52e-17 | -2.61e+00 | 0.1458 |
| 1357 | CPA1 | DS20191261Tumor | Human | Pancreas | PDAC | 1.09e-92 | -2.61e+00 | 0.1367 |
| 1357 | CPA1 | DS20191261TumorKeller | Human | Pancreas | PDAC | 3.69e-32 | -2.61e+00 | 0.1407 |
| Page: 1 |
| Tissue | Expression Dynamics | Abbreviation |
| Liver | 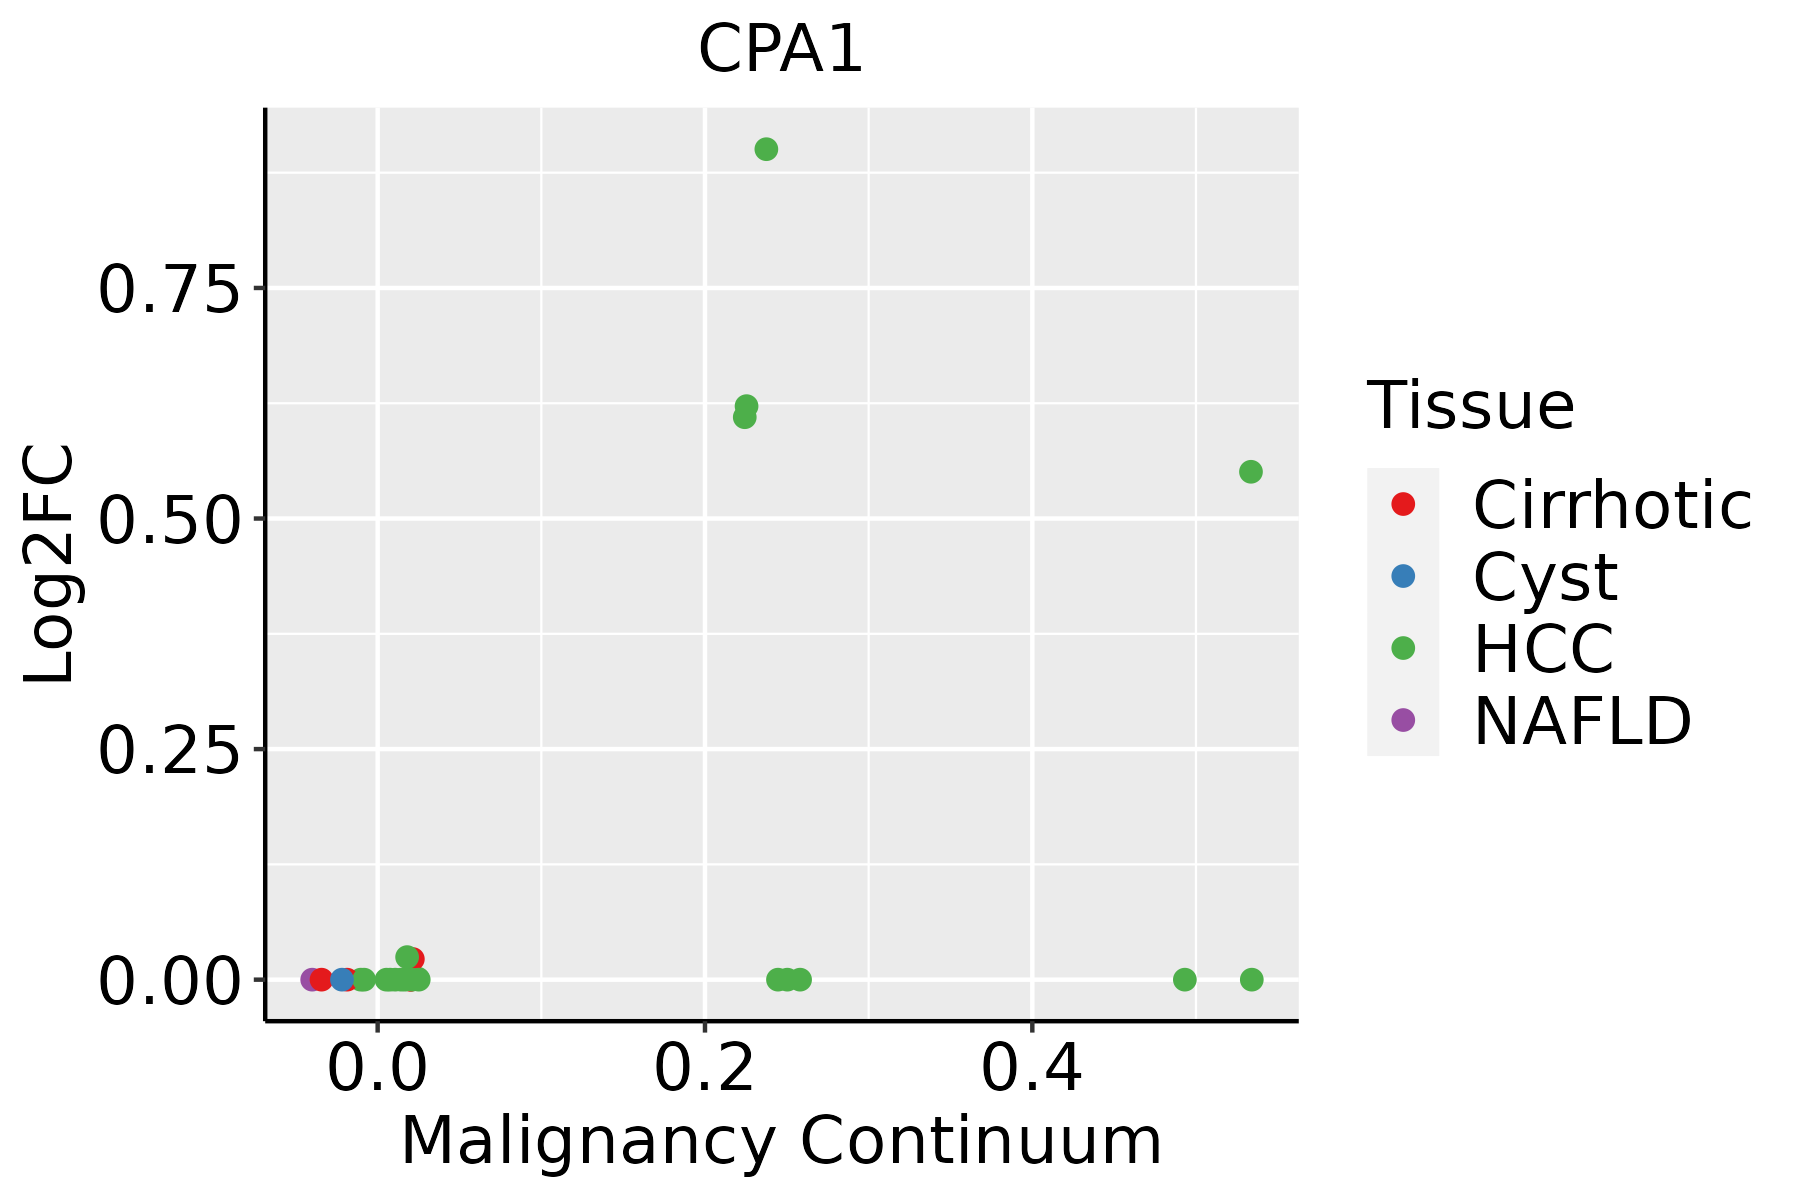 | HCC: Hepatocellular carcinoma |
| NAFLD: Non-alcoholic fatty liver disease |
| ∗log2FC in expression of this searched gene in stem-like cells from each diseased tissue sample relative to stem-like cells in normal samples in each tissue plotted against the malignancy continuum. Samples are colored based on if they are from different disease stage. |
Top |
Malignant transformation related pathway analysis |
| Find out the enriched GO biological processes and KEGG pathways involved in transition from healthy to precancer to cancer |
| Tissue | Disease Stage | Enriched GO biological Processes |
| Colorectum | AD |  |
| Colorectum | SER |  |
| Colorectum | MSS |  |
| Colorectum | MSI-H |  |
| Colorectum | FAP |  |
| ∗Top 15 enriched GO BP terms are showed in the bar plot of each disease state in each tissue. Each row represents a significant GO biological process which is colored according to the -log10(p.adjust). |
| Page: 1 2 3 4 5 6 7 8 9 |
| GO ID | Tissue | Disease Stage | Description | Gene Ratio | Bg Ratio | pvalue | p.adjust | Count |
| Page: 1 |
| Pathway ID | Tissue | Disease Stage | Description | Gene Ratio | Bg Ratio | pvalue | p.adjust | qvalue | Count |
| Page: 1 |
Top |
Cell-cell communication analysis |
| Identification of potential cell-cell interactions between two cell types and their ligand-receptor pairs for different disease states |
| Ligand | Receptor | LRpair | Pathway | Tissue | Disease Stage |
| Page: 1 |
Top |
Single-cell gene regulatory network inference analysis |
| Find out the significant the regulons (TFs) and the target genes of each regulon across cell types for different disease states |
| TF | Cell Type | Tissue | Disease Stage | Target Gene | RSS | Regulon Activity |
| ∗The dot plots of a searched regulon are shown for all cell subpopulations in each disease state of each tissue based on the regulon specific score inferred using pySCENIC and by calculating the average expression. |
| Page: 1 |
Top |
Somatic mutation of malignant transformation related genes |
| Annotation of somatic variants for genes involved in malignant transformation |
| Hugo Symbol | Variant Class | Variant Classification | dbSNP RS | HGVSc | HGVSp | HGVSp Short | SWISSPROT | BIOTYPE | SIFT | PolyPhen | Tumor Sample Barcode | Tissue | Histology | Sex | Age | Stage | Therapy Types | Drugs | Outcome |
| CPA1 | SNV | Missense_Mutation | c.1031N>G | p.Tyr344Cys | p.Y344C | P15085 | protein_coding | deleterious(0) | probably_damaging(0.979) | TCGA-A8-A09A-01 | Breast | breast invasive carcinoma | Female | <65 | I/II | Hormone Therapy | tamoxiphen | SD | |
| CPA1 | SNV | Missense_Mutation | rs782556361 | c.523N>A | p.Asp175Asn | p.D175N | P15085 | protein_coding | tolerated(0.26) | probably_damaging(0.998) | TCGA-BH-A0AW-01 | Breast | breast invasive carcinoma | Female | <65 | I/II | Chemotherapy | carboplatin | SD |
| CPA1 | SNV | Missense_Mutation | c.1052G>A | p.Gly351Asp | p.G351D | P15085 | protein_coding | deleterious(0) | probably_damaging(1) | TCGA-D8-A1J8-01 | Breast | breast invasive carcinoma | Female | >=65 | I/II | Hormone Therapy | nolvadex | SD | |
| CPA1 | SNV | Missense_Mutation | novel | c.959N>A | p.Thr320Lys | p.T320K | P15085 | protein_coding | tolerated(0.3) | benign(0.001) | TCGA-D8-A1XA-01 | Breast | breast invasive carcinoma | Female | <65 | I/II | Unknown | Unknown | SD |
| CPA1 | SNV | Missense_Mutation | novel | c.516N>G | p.Ile172Met | p.I172M | P15085 | protein_coding | deleterious(0.02) | possibly_damaging(0.456) | TCGA-D8-A27V-01 | Breast | breast invasive carcinoma | Female | <65 | I/II | Hormone Therapy | tamoxiphen | SD |
| CPA1 | SNV | Missense_Mutation | c.536N>G | p.His179Arg | p.H179R | P15085 | protein_coding | deleterious(0) | probably_damaging(0.998) | TCGA-E2-A14R-01 | Breast | breast invasive carcinoma | Female | <65 | I/II | Chemotherapy | doxorubicin | PD | |
| CPA1 | SNV | Missense_Mutation | novel | c.379G>A | p.Glu127Lys | p.E127K | P15085 | protein_coding | tolerated(0.06) | possibly_damaging(0.84) | TCGA-2W-A8YY-01 | Cervix | cervical & endocervical cancer | Female | <65 | I/II | Chemotherapy | cisplatin | CR |
| CPA1 | SNV | Missense_Mutation | c.277G>A | p.Val93Met | p.V93M | P15085 | protein_coding | deleterious(0) | probably_damaging(0.921) | TCGA-JX-A5QV-01 | Cervix | cervical & endocervical cancer | Female | <65 | I/II | Unknown | Unknown | SD | |
| CPA1 | SNV | Missense_Mutation | rs782561684 | c.847N>A | p.Glu283Lys | p.E283K | P15085 | protein_coding | deleterious(0) | probably_damaging(1) | TCGA-AA-3510-01 | Colorectum | colon adenocarcinoma | Male | >=65 | I/II | Unknown | Unknown | SD |
| CPA1 | SNV | Missense_Mutation | rs375929600 | c.284C>T | p.Ser95Leu | p.S95L | P15085 | protein_coding | tolerated(0.26) | benign(0.003) | TCGA-AA-3713-01 | Colorectum | colon adenocarcinoma | Male | >=65 | III/IV | Chemotherapy | 5-fluorouracil | PR |
| Page: 1 2 3 4 5 6 |
Top |
Related drugs of malignant transformation related genes |
| Identification of chemicals and drugs interact with genes involved in malignant transfromation |
| (DGIdb 4.0) |
| Entrez ID | Symbol | Category | Interaction Types | Drug Claim Name | Drug Name | PMIDs |
| 1357 | CPA1 | PROTEASE, ENZYME, DRUGGABLE GENOME | inhibitor | 252166827 |
| Page: 1 |

Copyright 2023-Present -The University of Texas Health Science Center at Houston |