
|
|||||
|
 | |
| |
| |
| |
| |
| |
|
Gene: CP |
Gene summary for CP |
| Gene information | Species | Human | Gene symbol | CP | Gene ID | 1356 |
| Gene name | ceruloplasmin | |
| Gene Alias | CP-2 | |
| Cytomap | 3q24-q25.1 | |
| Gene Type | protein-coding | GO ID | GO:0000041 | UniProtAcc | A5PL27 |
Top |
Malignant transformation analysis |
| Identification of the aberrant gene expression in precancerous and cancerous lesions by comparing the gene expression of stem-like cells in diseased tissues with normal stem cells |
| Entrez ID | Symbol | Replicates | Species | Organ | Tissue | Adj P-value | Log2FC | Malignancy |
| 1356 | CP | GSM4909281 | Human | Breast | IDC | 2.40e-56 | 9.45e-01 | 0.21 |
| 1356 | CP | GSM4909282 | Human | Breast | IDC | 2.10e-17 | 3.80e-01 | -0.0288 |
| 1356 | CP | GSM4909290 | Human | Breast | IDC | 5.75e-06 | 3.01e-01 | 0.2096 |
| 1356 | CP | GSM4909295 | Human | Breast | IDC | 3.71e-03 | 2.70e-01 | 0.0898 |
| 1356 | CP | GSM4909307 | Human | Breast | IDC | 1.08e-14 | 4.03e-01 | 0.1569 |
| 1356 | CP | GSM4909308 | Human | Breast | IDC | 1.87e-13 | 3.49e-01 | 0.158 |
| 1356 | CP | brca2 | Human | Breast | Precancer | 2.58e-20 | 5.71e-01 | -0.024 |
| 1356 | CP | brca3 | Human | Breast | Precancer | 5.76e-10 | 3.76e-01 | -0.0263 |
| 1356 | CP | M2 | Human | Breast | IDC | 1.27e-14 | 1.04e+00 | 0.21 |
| 1356 | CP | NCCBC14 | Human | Breast | DCIS | 6.79e-06 | 4.61e-01 | 0.2021 |
| 1356 | CP | P2 | Human | Breast | IDC | 2.09e-14 | 7.78e-01 | 0.21 |
| 1356 | CP | DCIS2 | Human | Breast | DCIS | 2.37e-04 | 1.67e-01 | 0.0085 |
| 1356 | CP | CA_HPV_1 | Human | Cervix | CC | 1.12e-08 | -4.63e-01 | 0.0264 |
| 1356 | CP | CA_HPV_3 | Human | Cervix | CC | 3.97e-12 | -5.04e-01 | 0.0414 |
| 1356 | CP | HSIL_HPV_1 | Human | Cervix | HSIL_HPV | 4.70e-03 | -4.14e-01 | 0.0116 |
| 1356 | CP | N_HPV_1 | Human | Cervix | N_HPV | 6.31e-09 | -4.55e-01 | 0.0079 |
| 1356 | CP | N_HPV_2 | Human | Cervix | N_HPV | 2.75e-04 | -3.81e-01 | -0.0131 |
| 1356 | CP | CCII_1 | Human | Cervix | CC | 3.22e-04 | -4.98e-01 | 0.3249 |
| 1356 | CP | Tumor | Human | Cervix | CC | 5.04e-04 | -4.13e-01 | 0.1241 |
| 1356 | CP | sample1 | Human | Cervix | CC | 5.56e-11 | 7.38e-01 | 0.0959 |
| Page: 1 2 3 4 5 |
| Tissue | Expression Dynamics | Abbreviation |
| Breast |  | IDC: Invasive ductal carcinoma |
| DCIS: Ductal carcinoma in situ | ||
| Precancer(BRCA1-mut): Precancerous lesion from BRCA1 mutation carriers | ||
| Cervix | 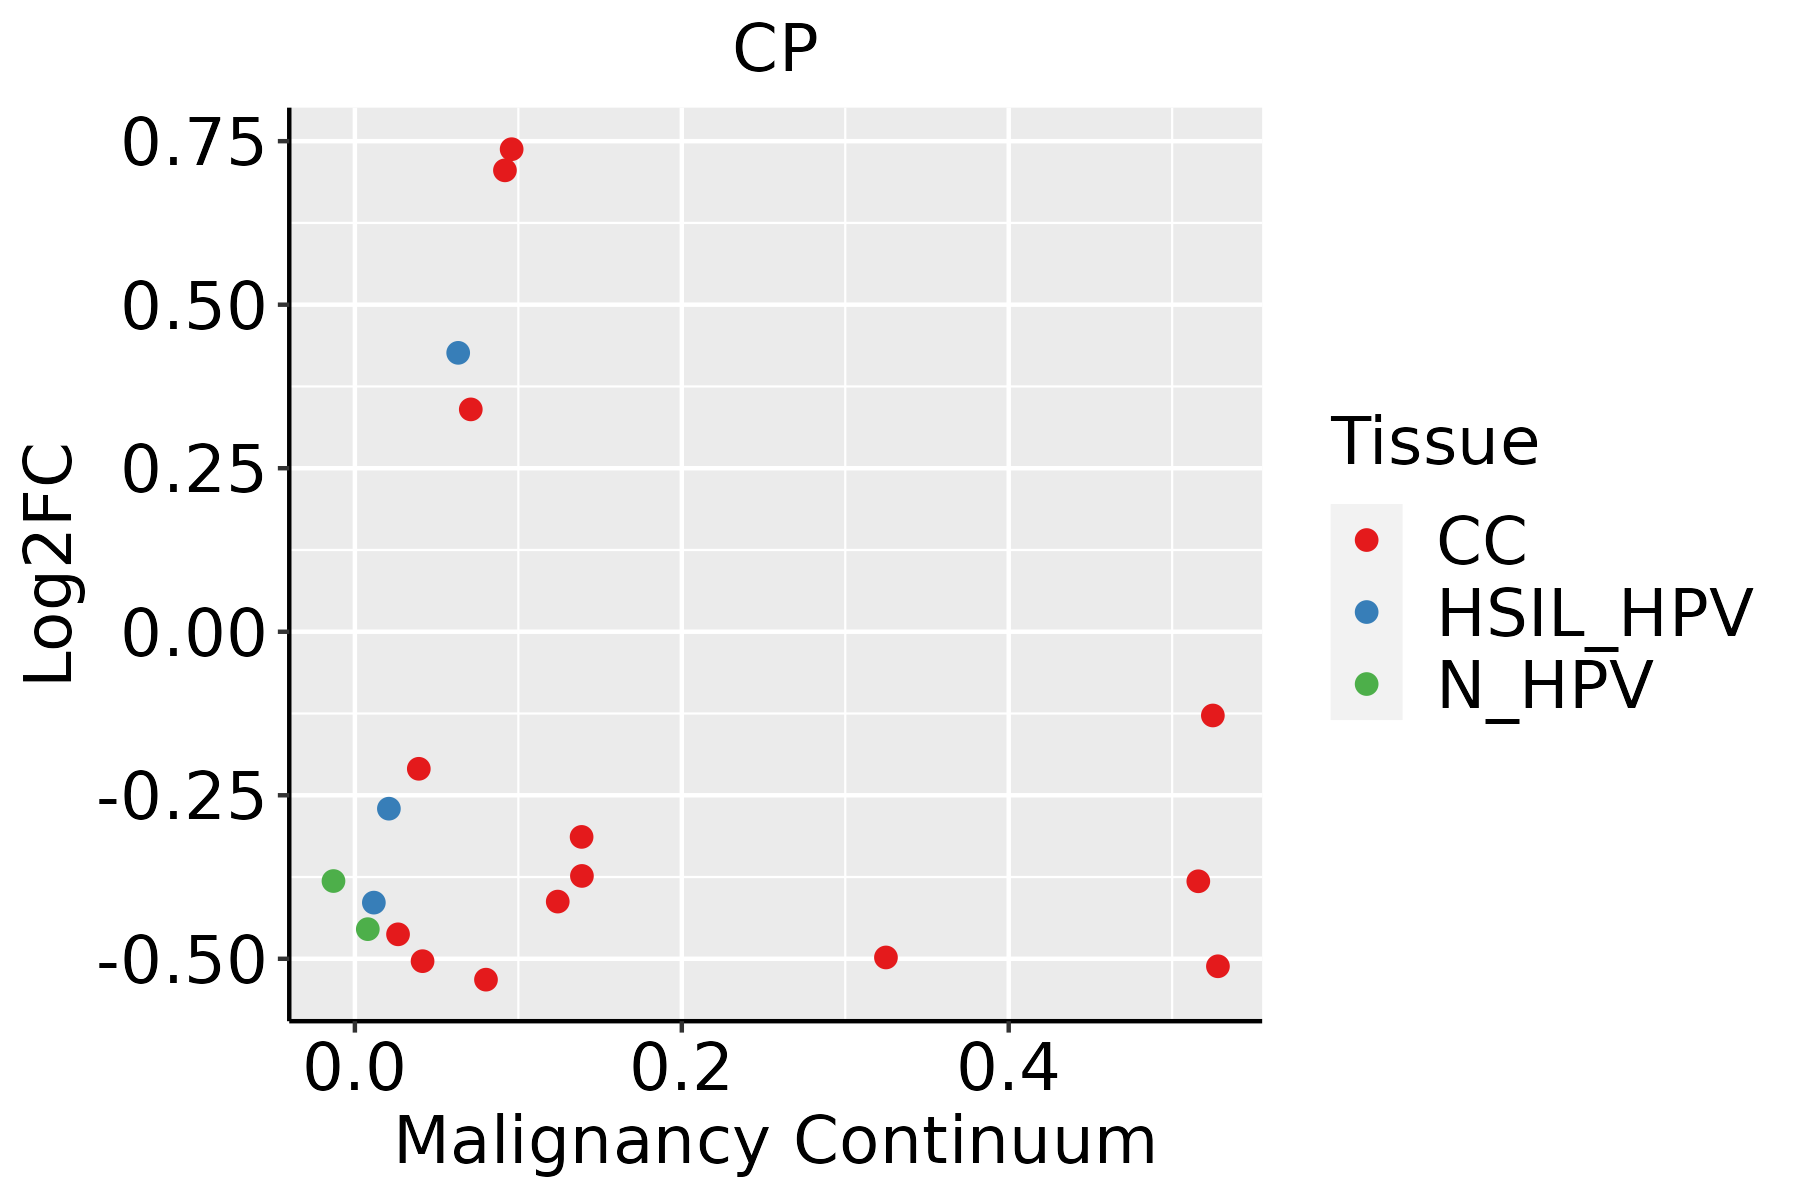 | CC: Cervix cancer |
| HSIL_HPV: HPV-infected high-grade squamous intraepithelial lesions | ||
| N_HPV: HPV-infected normal cervix | ||
| Esophagus |  | ESCC: Esophageal squamous cell carcinoma |
| HGIN: High-grade intraepithelial neoplasias | ||
| LGIN: Low-grade intraepithelial neoplasias | ||
| Liver | 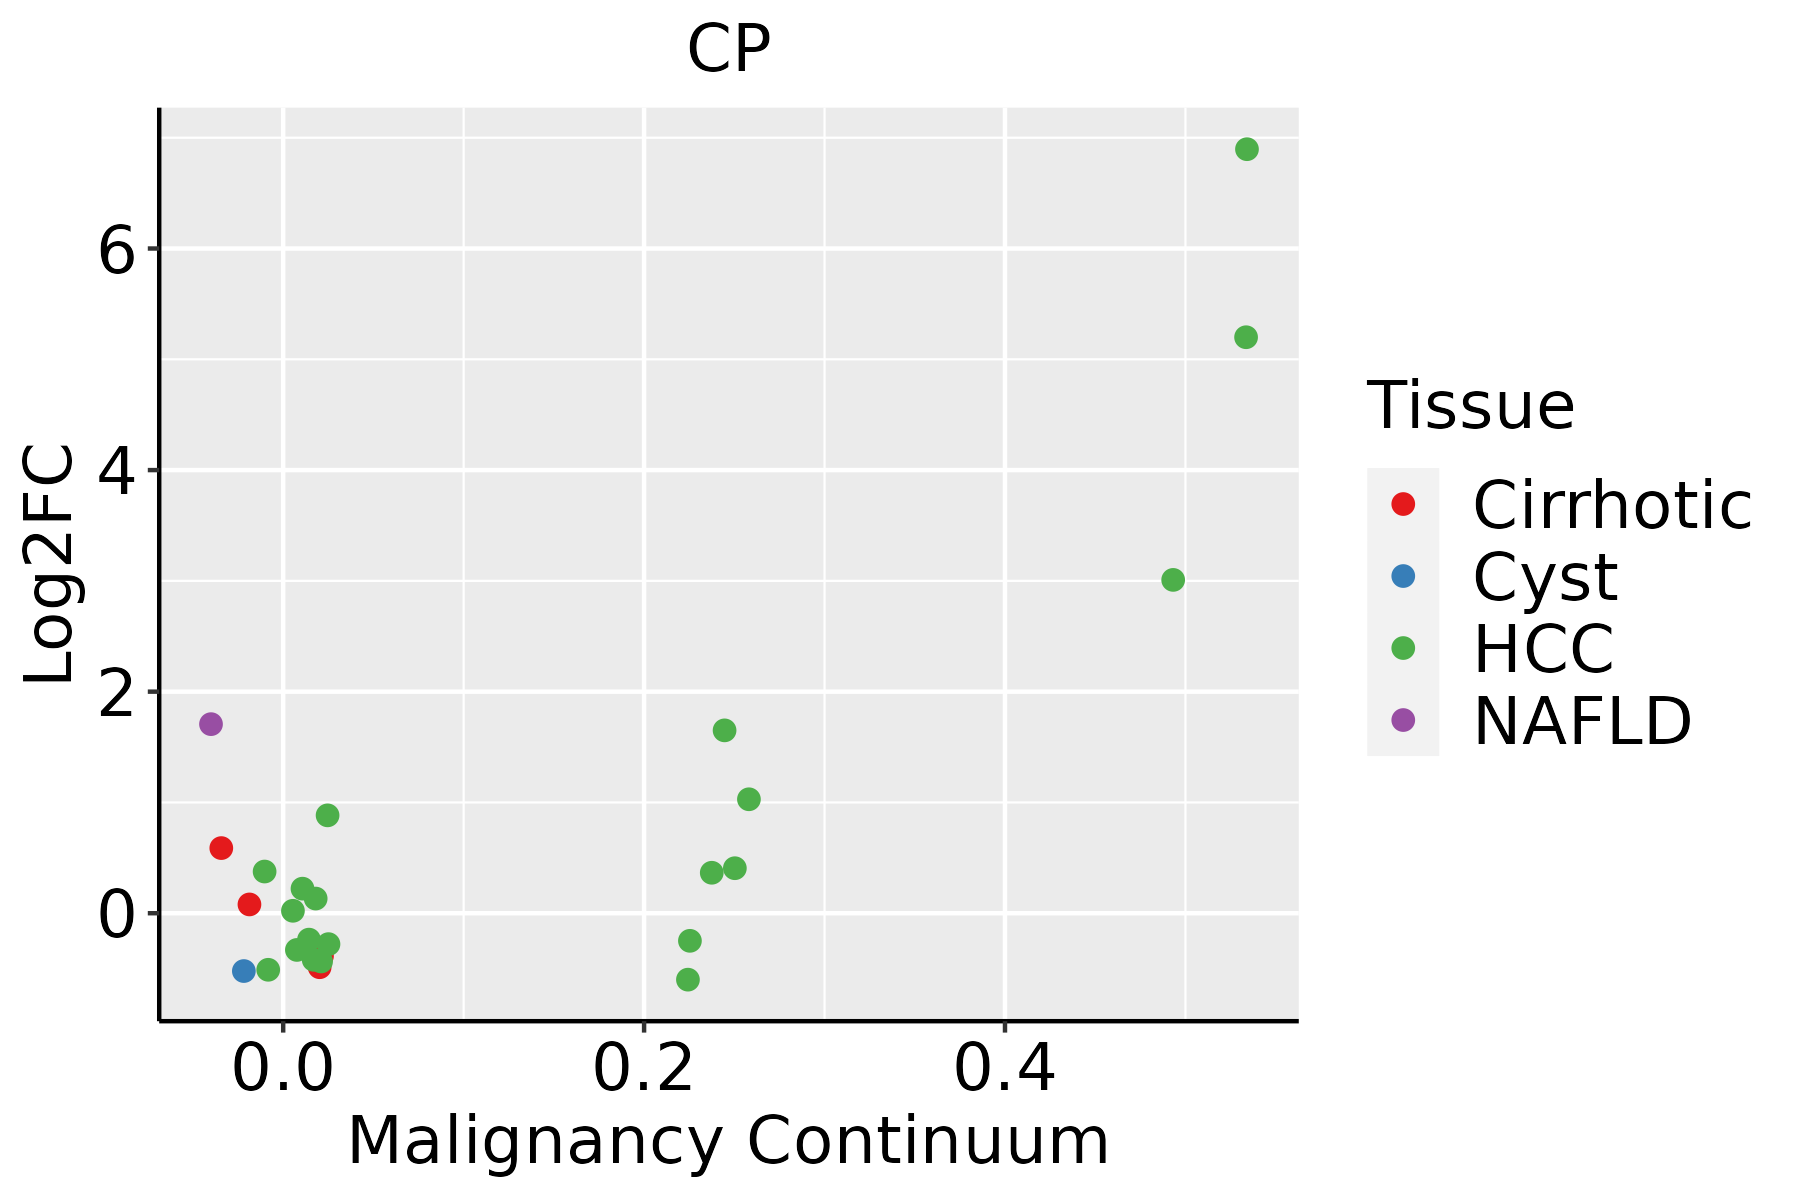 | HCC: Hepatocellular carcinoma |
| NAFLD: Non-alcoholic fatty liver disease | ||
| Lung | 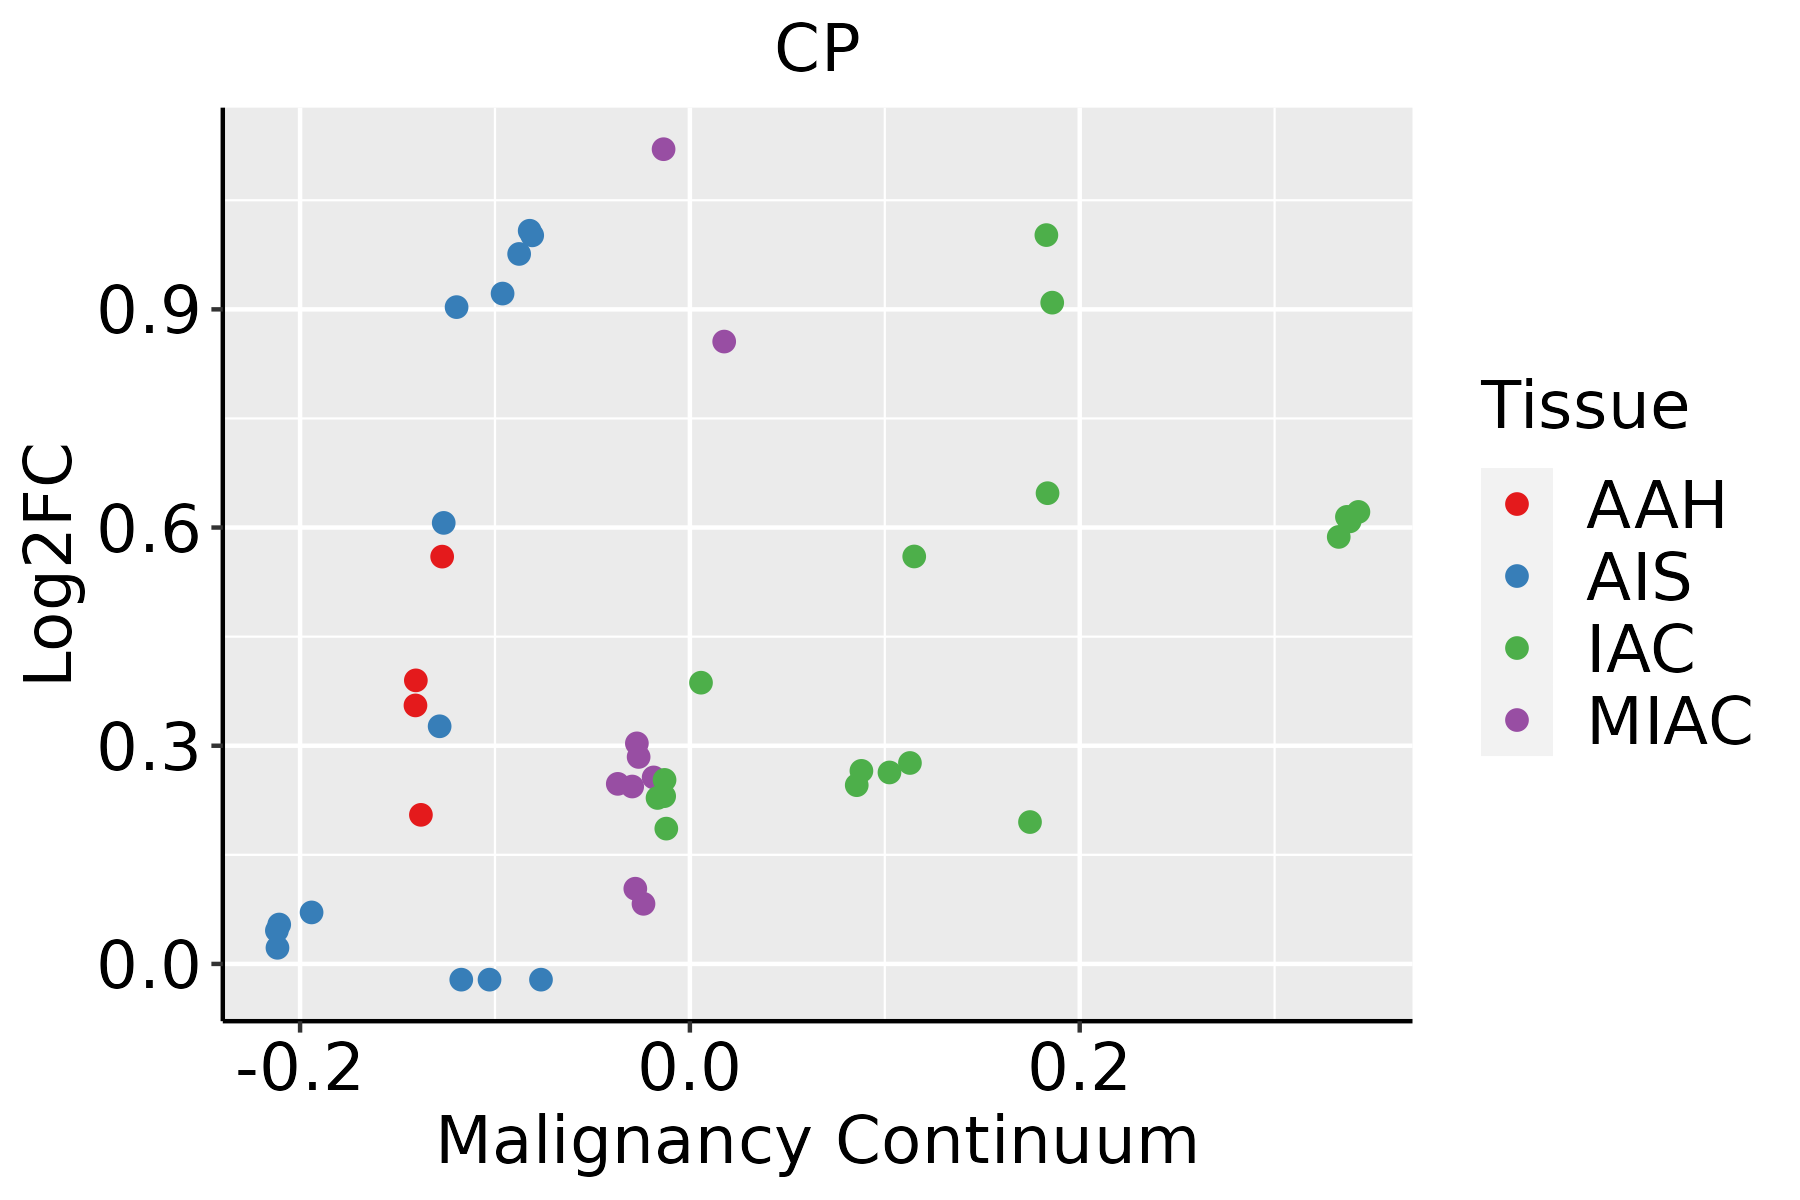 | AAH: Atypical adenomatous hyperplasia |
| AIS: Adenocarcinoma in situ | ||
| IAC: Invasive lung adenocarcinoma | ||
| MIA: Minimally invasive adenocarcinoma | ||
| Oral Cavity | 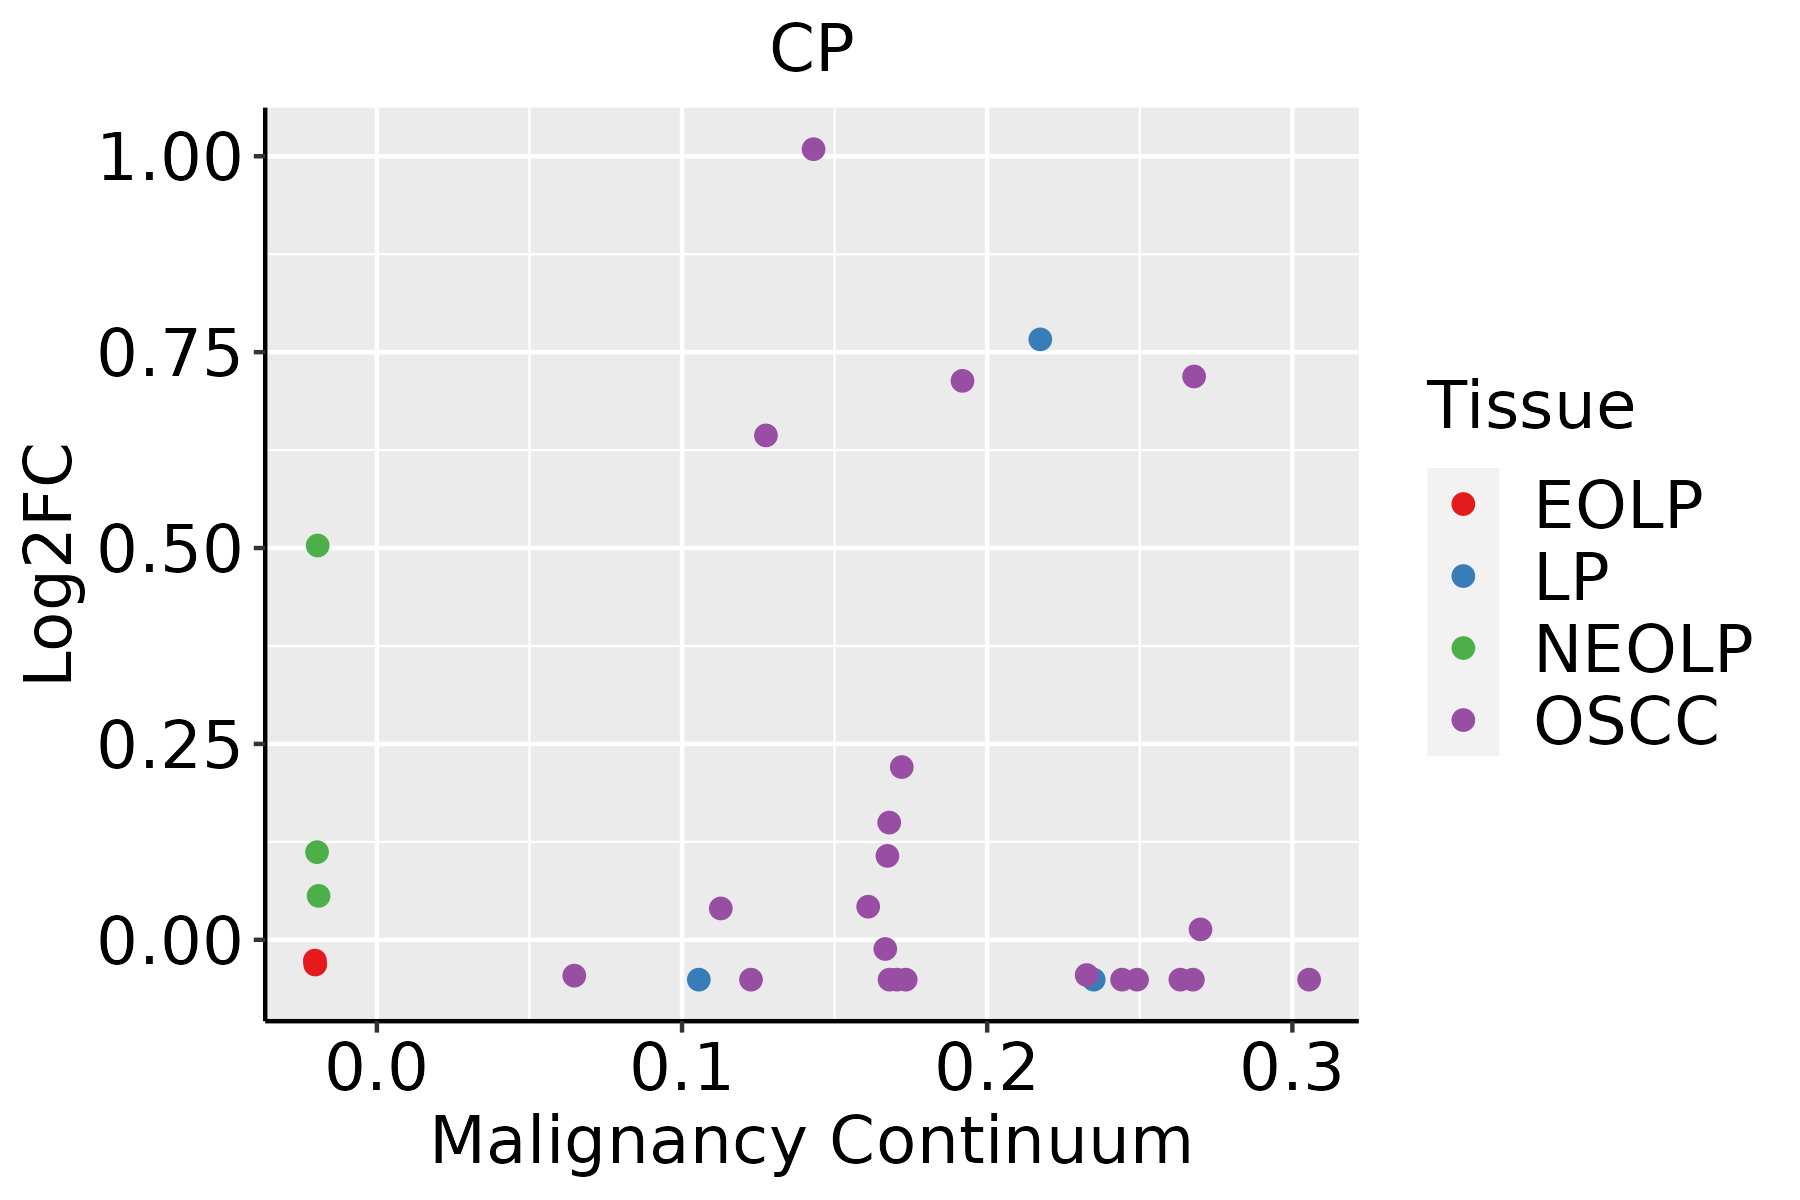 | EOLP: Erosive Oral lichen planus |
| LP: leukoplakia | ||
| NEOLP: Non-erosive oral lichen planus | ||
| OSCC: Oral squamous cell carcinoma | ||
| Prostate | 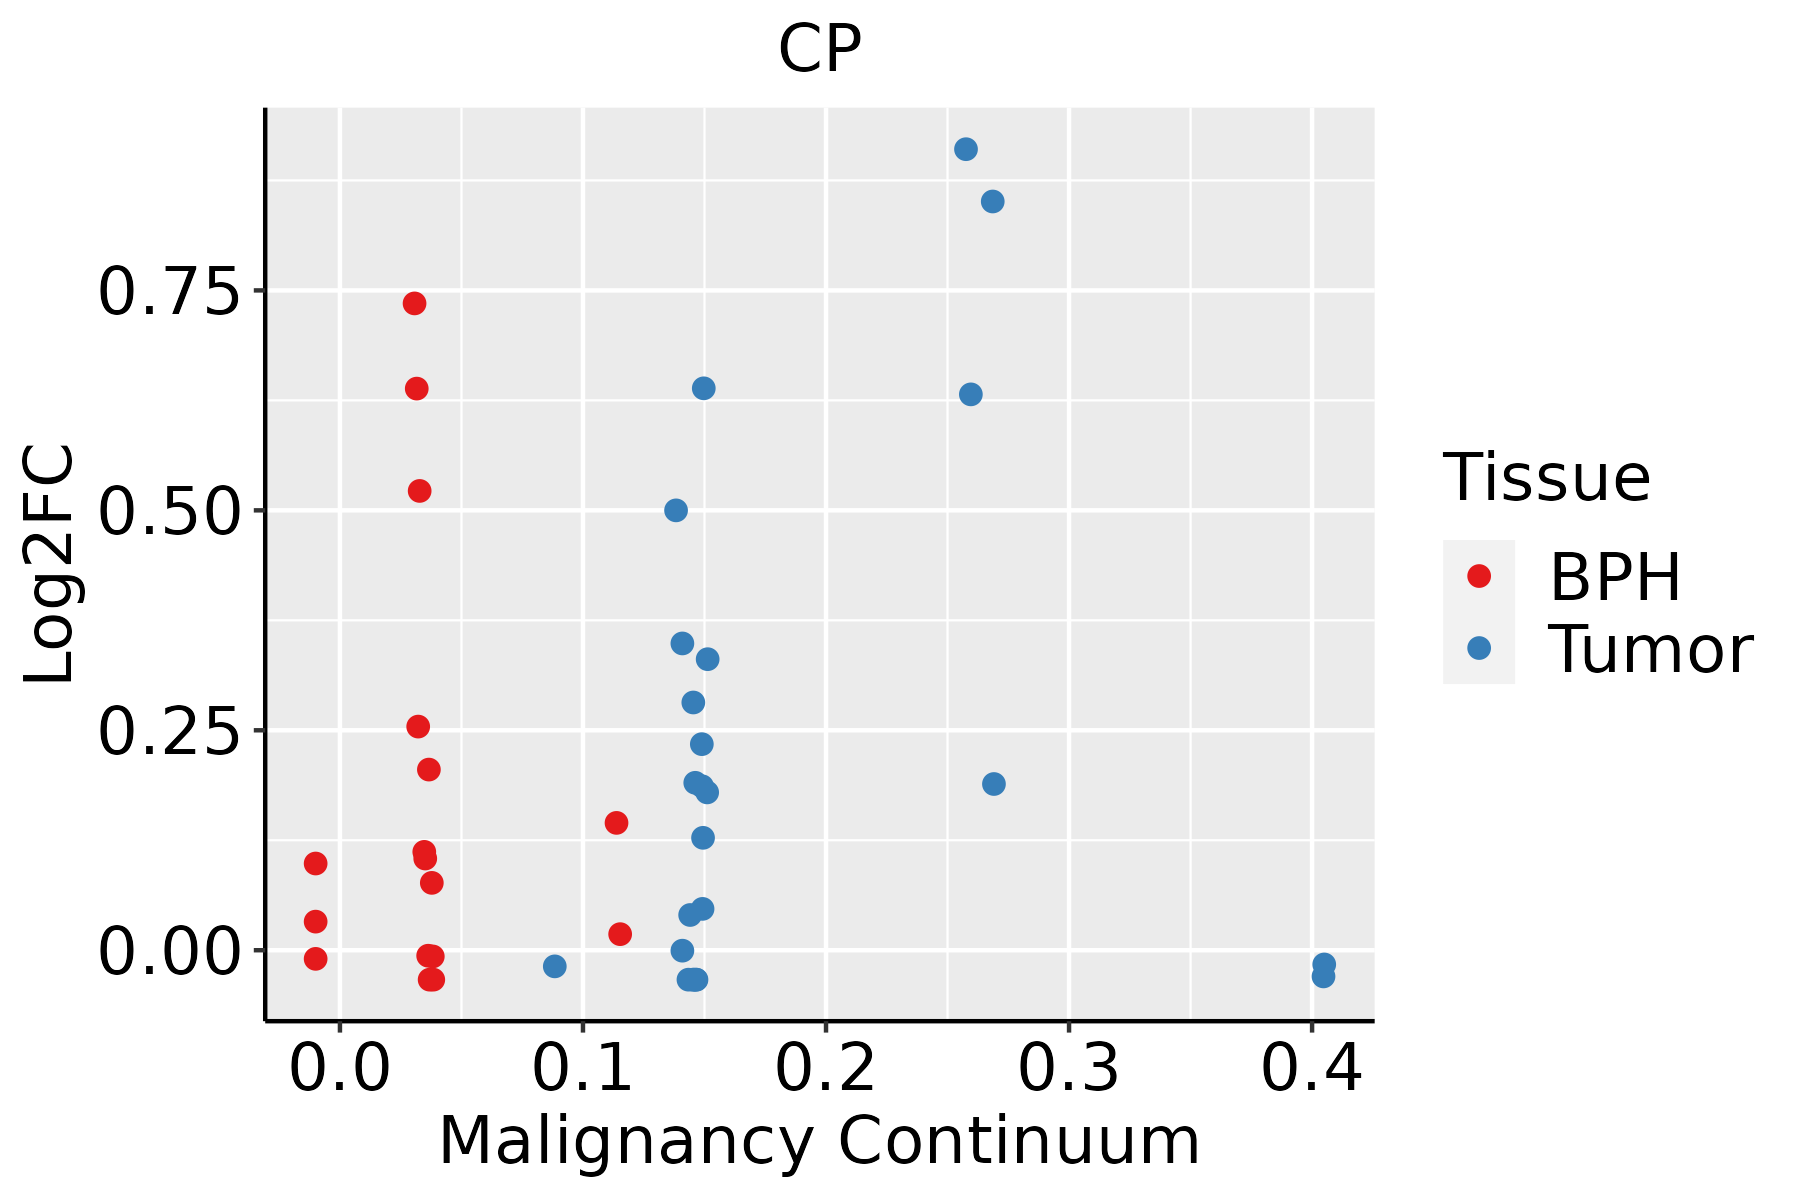 | BPH: Benign Prostatic Hyperplasia |
| ∗log2FC in expression of this searched gene in stem-like cells from each diseased tissue sample relative to stem-like cells in normal samples in each tissue plotted against the malignancy continuum. Samples are colored based on if they are from different disease stage. |
Top |
Malignant transformation related pathway analysis |
| Find out the enriched GO biological processes and KEGG pathways involved in transition from healthy to precancer to cancer |
| Tissue | Disease Stage | Enriched GO biological Processes |
| Colorectum | AD |  |
| Colorectum | SER |  |
| Colorectum | MSS |  |
| Colorectum | MSI-H |  |
| Colorectum | FAP |  |
| ∗Top 15 enriched GO BP terms are showed in the bar plot of each disease state in each tissue. Each row represents a significant GO biological process which is colored according to the -log10(p.adjust). |
| Page: 1 2 3 4 5 6 7 8 9 |
| GO ID | Tissue | Disease Stage | Description | Gene Ratio | Bg Ratio | pvalue | p.adjust | Count |
| GO:00460349 | Breast | Precancer | ATP metabolic process | 82/1080 | 277/18723 | 1.94e-36 | 5.19e-33 | 82 |
| GO:00061199 | Breast | Precancer | oxidative phosphorylation | 53/1080 | 141/18723 | 1.15e-29 | 2.04e-26 | 53 |
| GO:00090608 | Breast | Precancer | aerobic respiration | 58/1080 | 189/18723 | 5.69e-27 | 7.62e-24 | 58 |
| GO:00060918 | Breast | Precancer | generation of precursor metabolites and energy | 94/1080 | 490/18723 | 1.54e-25 | 1.64e-22 | 94 |
| GO:00453338 | Breast | Precancer | cellular respiration | 59/1080 | 230/18723 | 5.97e-23 | 5.32e-20 | 59 |
| GO:00159808 | Breast | Precancer | energy derivation by oxidation of organic compounds | 70/1080 | 318/18723 | 8.33e-23 | 6.37e-20 | 70 |
| GO:00718269 | Breast | Precancer | ribonucleoprotein complex subunit organization | 48/1080 | 227/18723 | 2.68e-15 | 8.45e-13 | 48 |
| GO:19026008 | Breast | Precancer | proton transmembrane transport | 39/1080 | 157/18723 | 4.18e-15 | 1.18e-12 | 39 |
| GO:00069799 | Breast | Precancer | response to oxidative stress | 70/1080 | 446/18723 | 1.59e-14 | 4.26e-12 | 70 |
| GO:00525479 | Breast | Precancer | regulation of peptidase activity | 71/1080 | 461/18723 | 2.72e-14 | 6.94e-12 | 71 |
| GO:00525489 | Breast | Precancer | regulation of endopeptidase activity | 67/1080 | 432/18723 | 1.06e-13 | 2.36e-11 | 67 |
| GO:00064578 | Breast | Precancer | protein folding | 43/1080 | 212/18723 | 3.48e-13 | 7.45e-11 | 43 |
| GO:00067547 | Breast | Precancer | ATP biosynthetic process | 21/1080 | 57/18723 | 2.31e-12 | 4.26e-10 | 21 |
| GO:00362939 | Breast | Precancer | response to decreased oxygen levels | 53/1080 | 322/18723 | 4.09e-12 | 6.84e-10 | 53 |
| GO:00016669 | Breast | Precancer | response to hypoxia | 51/1080 | 307/18723 | 7.33e-12 | 1.11e-09 | 51 |
| GO:00704829 | Breast | Precancer | response to oxygen levels | 55/1080 | 347/18723 | 7.47e-12 | 1.11e-09 | 55 |
| GO:20001169 | Breast | Precancer | regulation of cysteine-type endopeptidase activity | 43/1080 | 235/18723 | 1.30e-11 | 1.83e-09 | 43 |
| GO:00068398 | Breast | Precancer | mitochondrial transport | 45/1080 | 254/18723 | 1.37e-11 | 1.88e-09 | 45 |
| GO:00092067 | Breast | Precancer | purine ribonucleoside triphosphate biosynthetic process | 22/1080 | 68/18723 | 1.41e-11 | 1.88e-09 | 22 |
| GO:00432819 | Breast | Precancer | regulation of cysteine-type endopeptidase activity involved in apoptotic process | 40/1080 | 209/18723 | 1.59e-11 | 2.07e-09 | 40 |
| Pathway ID | Tissue | Disease Stage | Description | Gene Ratio | Bg Ratio | pvalue | p.adjust | qvalue | Count |
| hsa0421642 | Breast | DCIS | Ferroptosis | 12/846 | 41/8465 | 4.69e-04 | 3.69e-03 | 2.72e-03 | 12 |
| hsa0421652 | Breast | DCIS | Ferroptosis | 12/846 | 41/8465 | 4.69e-04 | 3.69e-03 | 2.72e-03 | 12 |
| hsa0421614 | Cervix | CC | Ferroptosis | 14/1267 | 41/8465 | 1.75e-03 | 7.21e-03 | 4.26e-03 | 14 |
| hsa0421615 | Cervix | CC | Ferroptosis | 14/1267 | 41/8465 | 1.75e-03 | 7.21e-03 | 4.26e-03 | 14 |
| hsa0421629 | Esophagus | ESCC | Ferroptosis | 33/4205 | 41/8465 | 4.58e-05 | 1.99e-04 | 1.02e-04 | 33 |
| hsa0421638 | Esophagus | ESCC | Ferroptosis | 33/4205 | 41/8465 | 4.58e-05 | 1.99e-04 | 1.02e-04 | 33 |
| hsa042168 | Liver | NAFLD | Ferroptosis | 12/1043 | 41/8465 | 2.98e-03 | 2.96e-02 | 2.39e-02 | 12 |
| hsa0421611 | Liver | NAFLD | Ferroptosis | 12/1043 | 41/8465 | 2.98e-03 | 2.96e-02 | 2.39e-02 | 12 |
| hsa0421621 | Liver | Cirrhotic | Ferroptosis | 23/2530 | 41/8465 | 4.09e-04 | 2.57e-03 | 1.58e-03 | 23 |
| hsa0421631 | Liver | Cirrhotic | Ferroptosis | 23/2530 | 41/8465 | 4.09e-04 | 2.57e-03 | 1.58e-03 | 23 |
| hsa0421641 | Liver | HCC | Ferroptosis | 33/4020 | 41/8465 | 1.42e-05 | 9.88e-05 | 5.50e-05 | 33 |
| hsa0421651 | Liver | HCC | Ferroptosis | 33/4020 | 41/8465 | 1.42e-05 | 9.88e-05 | 5.50e-05 | 33 |
| hsa042169 | Lung | IAC | Ferroptosis | 11/1053 | 41/8465 | 9.62e-03 | 3.68e-02 | 2.44e-02 | 11 |
| hsa0421612 | Lung | IAC | Ferroptosis | 11/1053 | 41/8465 | 9.62e-03 | 3.68e-02 | 2.44e-02 | 11 |
| hsa0421620 | Oral cavity | OSCC | Ferroptosis | 29/3704 | 41/8465 | 4.26e-04 | 1.30e-03 | 6.60e-04 | 29 |
| hsa04216110 | Oral cavity | OSCC | Ferroptosis | 29/3704 | 41/8465 | 4.26e-04 | 1.30e-03 | 6.60e-04 | 29 |
| hsa0421643 | Oral cavity | NEOLP | Ferroptosis | 14/1112 | 41/8465 | 4.69e-04 | 2.71e-03 | 1.71e-03 | 14 |
| hsa0421653 | Oral cavity | NEOLP | Ferroptosis | 14/1112 | 41/8465 | 4.69e-04 | 2.71e-03 | 1.71e-03 | 14 |
| hsa0421618 | Prostate | BPH | Ferroptosis | 22/1718 | 41/8465 | 2.24e-06 | 2.00e-05 | 1.24e-05 | 22 |
| hsa0421619 | Prostate | BPH | Ferroptosis | 22/1718 | 41/8465 | 2.24e-06 | 2.00e-05 | 1.24e-05 | 22 |
| Page: 1 2 |
Top |
Cell-cell communication analysis |
| Identification of potential cell-cell interactions between two cell types and their ligand-receptor pairs for different disease states |
| Ligand | Receptor | LRpair | Pathway | Tissue | Disease Stage |
| Page: 1 |
Top |
Single-cell gene regulatory network inference analysis |
| Find out the significant the regulons (TFs) and the target genes of each regulon across cell types for different disease states |
| TF | Cell Type | Tissue | Disease Stage | Target Gene | RSS | Regulon Activity |
| ∗The dot plots of a searched regulon are shown for all cell subpopulations in each disease state of each tissue based on the regulon specific score inferred using pySCENIC and by calculating the average expression. |
| Page: 1 |
Top |
Somatic mutation of malignant transformation related genes |
| Annotation of somatic variants for genes involved in malignant transformation |
| Hugo Symbol | Variant Class | Variant Classification | dbSNP RS | HGVSc | HGVSp | HGVSp Short | SWISSPROT | BIOTYPE | SIFT | PolyPhen | Tumor Sample Barcode | Tissue | Histology | Sex | Age | Stage | Therapy Types | Drugs | Outcome |
| CP | SNV | Missense_Mutation | novel | c.1843N>A | p.Gln615Lys | p.Q615K | P00450 | protein_coding | tolerated(0.28) | possibly_damaging(0.521) | TCGA-A2-A25A-01 | Breast | breast invasive carcinoma | Female | <65 | I/II | Unspecific | Cytoxan | SD |
| CP | SNV | Missense_Mutation | c.204G>T | p.Lys68Asn | p.K68N | P00450 | protein_coding | deleterious(0) | probably_damaging(0.992) | TCGA-A2-A25C-01 | Breast | breast invasive carcinoma | Female | <65 | I/II | Chemotherapy | taxotere | SD | |
| CP | SNV | Missense_Mutation | c.2285A>C | p.Asn762Thr | p.N762T | P00450 | protein_coding | deleterious(0.04) | benign(0.061) | TCGA-A8-A08R-01 | Breast | breast invasive carcinoma | Female | <65 | I/II | Unknown | Unknown | SD | |
| CP | SNV | Missense_Mutation | c.1468N>C | p.Tyr490His | p.Y490H | P00450 | protein_coding | tolerated(0.5) | benign(0.003) | TCGA-AO-A128-01 | Breast | breast invasive carcinoma | Female | <65 | I/II | Chemotherapy | doxorubicin | SD | |
| CP | SNV | Missense_Mutation | c.616G>A | p.Asp206Asn | p.D206N | P00450 | protein_coding | tolerated(0.38) | benign(0.052) | TCGA-C8-A8HQ-01 | Breast | breast invasive carcinoma | Female | <65 | I/II | Unknown | Unknown | SD | |
| CP | SNV | Missense_Mutation | c.2254N>A | p.Glu752Lys | p.E752K | P00450 | protein_coding | deleterious(0.03) | probably_damaging(1) | TCGA-D8-A27G-01 | Breast | breast invasive carcinoma | Female | >=65 | I/II | Unknown | Unknown | SD | |
| CP | insertion | Nonsense_Mutation | novel | c.208_209insACTCATCGGACCTTTAATAATCTGTAAAAAAGGTACAT | p.Ala70AspfsTer6 | p.A70Dfs*6 | P00450 | protein_coding | TCGA-BH-A0BJ-01 | Breast | breast invasive carcinoma | Female | <65 | I/II | Chemotherapy | doxorubicin | SD | ||
| CP | SNV | Missense_Mutation | novel | c.224A>G | p.Tyr75Cys | p.Y75C | P00450 | protein_coding | deleterious(0) | probably_damaging(0.994) | TCGA-2W-A8YY-01 | Cervix | cervical & endocervical cancer | Female | <65 | I/II | Chemotherapy | cisplatin | CR |
| CP | SNV | Missense_Mutation | c.550N>A | p.Asp184Asn | p.D184N | P00450 | protein_coding | tolerated(0.09) | possibly_damaging(0.803) | TCGA-C5-A1MJ-01 | Cervix | cervical & endocervical cancer | Female | <65 | I/II | Unknown | Unknown | SD | |
| CP | SNV | Missense_Mutation | c.572N>T | p.Ser191Leu | p.S191L | P00450 | protein_coding | deleterious(0) | possibly_damaging(0.88) | TCGA-DR-A0ZM-01 | Cervix | cervical & endocervical cancer | Female | <65 | III/IV | Unspecific | Cisplatin | SD |
| Page: 1 2 3 4 5 6 7 8 9 10 11 12 |
Top |
Related drugs of malignant transformation related genes |
| Identification of chemicals and drugs interact with genes involved in malignant transfromation |
| (DGIdb 4.0) |
| Entrez ID | Symbol | Category | Interaction Types | Drug Claim Name | Drug Name | PMIDs |
| 1356 | CP | DRUGGABLE GENOME, ENZYME | DEXRAZOXANE | DEXRAZOXANE | 8285144 | |
| 1356 | CP | DRUGGABLE GENOME, ENZYME | IMMUNOSUPPRESSIVE | 8406056 | ||
| 1356 | CP | DRUGGABLE GENOME, ENZYME | AMPICILLIN | AMPICILLIN | 1427966 | |
| 1356 | CP | DRUGGABLE GENOME, ENZYME | SODIUM MOLYBDATE | 7504610 | ||
| 1356 | CP | DRUGGABLE GENOME, ENZYME | TUMOR NECROSIS FACTOR | 2439635 | ||
| 1356 | CP | DRUGGABLE GENOME, ENZYME | ORAL CONTRACEPTIVE | 12616983 | ||
| 1356 | CP | DRUGGABLE GENOME, ENZYME | CLOMIPHENE CITRATE | 1692793 | ||
| 1356 | CP | DRUGGABLE GENOME, ENZYME | CELL SURFACE ANTIGEN | 9242695 | ||
| 1356 | CP | DRUGGABLE GENOME, ENZYME | PENICILLAMINE | PENICILLAMINE | 11721763 | |
| 1356 | CP | DRUGGABLE GENOME, ENZYME | PROGESTERONE | PROGESTERONE | 8619904 |
| Page: 1 2 3 |

Copyright 2023-Present -The University of Texas Health Science Center at Houston |