
|
|||||
|
 | |
| |
| |
| |
| |
| |
|
Gene: COX7B2 |
Gene summary for COX7B2 |
| Gene information | Species | Human | Gene symbol | COX7B2 | Gene ID | 170712 |
| Gene name | cytochrome c oxidase subunit 7B2 | |
| Gene Alias | COX7B2 | |
| Cytomap | 4p12 | |
| Gene Type | protein-coding | GO ID | GO:0006091 | UniProtAcc | Q8TF08 |
Top |
Malignant transformation analysis |
| Identification of the aberrant gene expression in precancerous and cancerous lesions by comparing the gene expression of stem-like cells in diseased tissues with normal stem cells |
| Entrez ID | Symbol | Replicates | Species | Organ | Tissue | Adj P-value | Log2FC | Malignancy |
| 170712 | COX7B2 | HCC1_Meng | Human | Liver | HCC | 6.99e-41 | 2.07e-01 | 0.0246 |
| 170712 | COX7B2 | HCC1 | Human | Liver | HCC | 1.33e-05 | 2.72e+00 | 0.5336 |
| 170712 | COX7B2 | HCC2 | Human | Liver | HCC | 8.19e-10 | 1.65e+00 | 0.5341 |
| 170712 | COX7B2 | S014 | Human | Liver | HCC | 3.28e-08 | 2.96e-01 | 0.2254 |
| 170712 | COX7B2 | S015 | Human | Liver | HCC | 2.18e-03 | 2.17e-01 | 0.2375 |
| 170712 | COX7B2 | S016 | Human | Liver | HCC | 1.12e-11 | 2.92e-01 | 0.2243 |
| 170712 | COX7B2 | S028 | Human | Liver | HCC | 4.91e-06 | 1.96e-01 | 0.2503 |
| Page: 1 |
| Tissue | Expression Dynamics | Abbreviation |
| Liver | 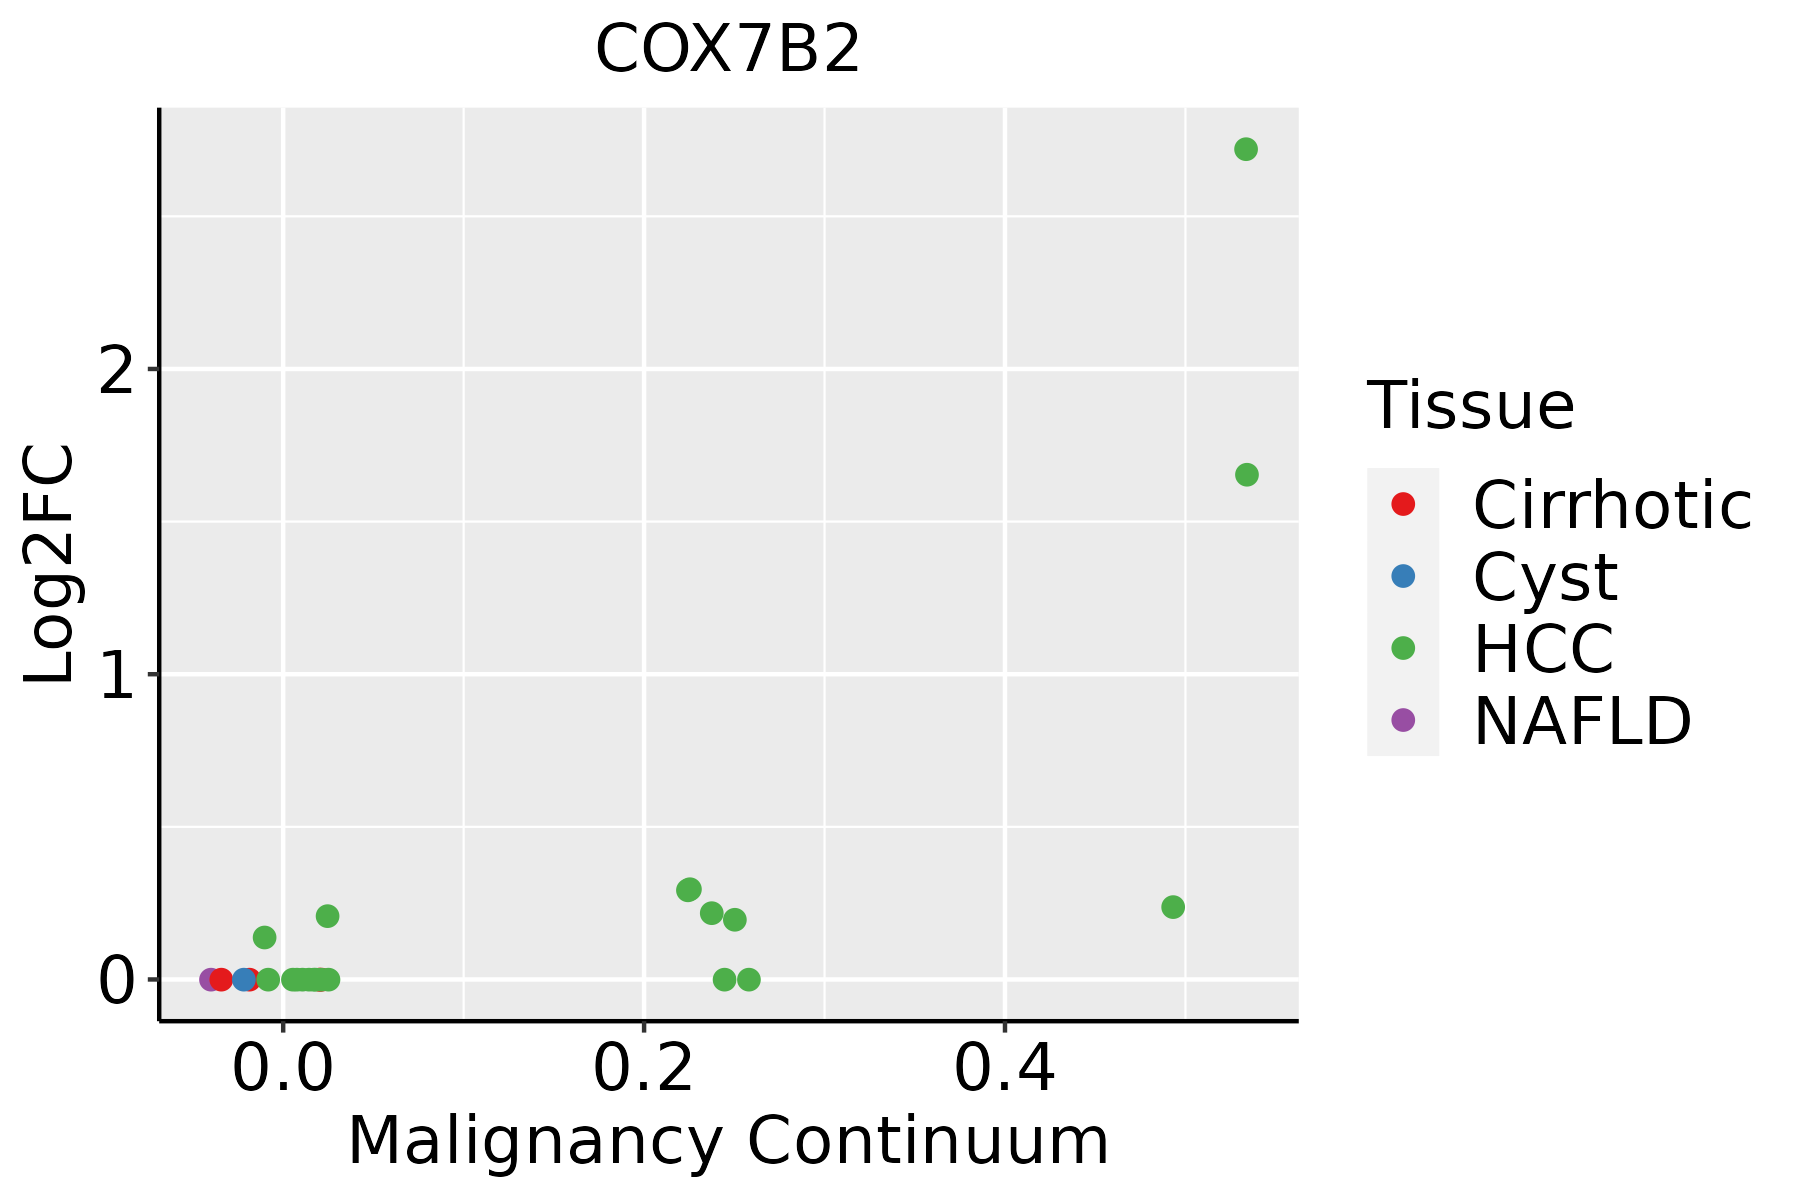 | HCC: Hepatocellular carcinoma |
| NAFLD: Non-alcoholic fatty liver disease |
| ∗log2FC in expression of this searched gene in stem-like cells from each diseased tissue sample relative to stem-like cells in normal samples in each tissue plotted against the malignancy continuum. Samples are colored based on if they are from different disease stage. |
Top |
Malignant transformation related pathway analysis |
| Find out the enriched GO biological processes and KEGG pathways involved in transition from healthy to precancer to cancer |
| Tissue | Disease Stage | Enriched GO biological Processes |
| Colorectum | AD |  |
| Colorectum | SER |  |
| Colorectum | MSS |  |
| Colorectum | MSI-H |  |
| Colorectum | FAP |  |
| ∗Top 15 enriched GO BP terms are showed in the bar plot of each disease state in each tissue. Each row represents a significant GO biological process which is colored according to the -log10(p.adjust). |
| Page: 1 2 3 4 5 6 7 8 9 |
| GO ID | Tissue | Disease Stage | Description | Gene Ratio | Bg Ratio | pvalue | p.adjust | Count |
| GO:000609122 | Liver | HCC | generation of precursor metabolites and energy | 340/7958 | 490/18723 | 4.04e-34 | 2.85e-31 | 340 |
| GO:000906012 | Liver | HCC | aerobic respiration | 147/7958 | 189/18723 | 3.13e-23 | 6.61e-21 | 147 |
| GO:004533312 | Liver | HCC | cellular respiration | 171/7958 | 230/18723 | 6.35e-23 | 1.26e-20 | 171 |
| GO:004603422 | Liver | HCC | ATP metabolic process | 198/7958 | 277/18723 | 8.30e-23 | 1.55e-20 | 198 |
| GO:001598022 | Liver | HCC | energy derivation by oxidation of organic compounds | 221/7958 | 318/18723 | 1.02e-22 | 1.86e-20 | 221 |
| GO:002290022 | Liver | HCC | electron transport chain | 134/7958 | 175/18723 | 3.32e-20 | 4.68e-18 | 134 |
| GO:000611912 | Liver | HCC | oxidative phosphorylation | 110/7958 | 141/18723 | 6.58e-18 | 7.45e-16 | 110 |
| GO:19026007 | Liver | HCC | proton transmembrane transport | 87/7958 | 157/18723 | 7.27e-04 | 4.42e-03 | 87 |
| Page: 1 |
| Pathway ID | Tissue | Disease Stage | Description | Gene Ratio | Bg Ratio | pvalue | p.adjust | qvalue | Count |
| hsa0501222 | Liver | HCC | Parkinson disease | 198/4020 | 266/8465 | 9.40e-20 | 1.58e-17 | 8.76e-18 | 198 |
| hsa0501622 | Liver | HCC | Huntington disease | 219/4020 | 306/8465 | 3.06e-18 | 3.42e-16 | 1.90e-16 | 219 |
| hsa0501422 | Liver | HCC | Amyotrophic lateral sclerosis | 252/4020 | 364/8465 | 8.85e-18 | 7.41e-16 | 4.12e-16 | 252 |
| hsa0520842 | Liver | HCC | Chemical carcinogenesis - reactive oxygen species | 167/4020 | 223/8465 | 2.85e-17 | 1.91e-15 | 1.06e-15 | 167 |
| hsa0493242 | Liver | HCC | Non-alcoholic fatty liver disease | 124/4020 | 155/8465 | 4.54e-17 | 2.54e-15 | 1.41e-15 | 124 |
| hsa0502022 | Liver | HCC | Prion disease | 195/4020 | 273/8465 | 3.26e-16 | 1.56e-14 | 8.67e-15 | 195 |
| hsa0471422 | Liver | HCC | Thermogenesis | 170/4020 | 232/8465 | 5.36e-16 | 2.25e-14 | 1.25e-14 | 170 |
| hsa0541522 | Liver | HCC | Diabetic cardiomyopathy | 151/4020 | 203/8465 | 2.72e-15 | 1.01e-13 | 5.63e-14 | 151 |
| hsa0501022 | Liver | HCC | Alzheimer disease | 254/4020 | 384/8465 | 3.75e-14 | 8.97e-13 | 4.99e-13 | 254 |
| hsa0019022 | Liver | HCC | Oxidative phosphorylation | 103/4020 | 134/8465 | 2.39e-12 | 5.01e-11 | 2.79e-11 | 103 |
| hsa0502222 | Liver | HCC | Pathways of neurodegeneration - multiple diseases | 298/4020 | 476/8465 | 6.59e-12 | 1.30e-10 | 7.22e-11 | 298 |
| hsa0501232 | Liver | HCC | Parkinson disease | 198/4020 | 266/8465 | 9.40e-20 | 1.58e-17 | 8.76e-18 | 198 |
| hsa0501632 | Liver | HCC | Huntington disease | 219/4020 | 306/8465 | 3.06e-18 | 3.42e-16 | 1.90e-16 | 219 |
| hsa0501432 | Liver | HCC | Amyotrophic lateral sclerosis | 252/4020 | 364/8465 | 8.85e-18 | 7.41e-16 | 4.12e-16 | 252 |
| hsa0520852 | Liver | HCC | Chemical carcinogenesis - reactive oxygen species | 167/4020 | 223/8465 | 2.85e-17 | 1.91e-15 | 1.06e-15 | 167 |
| hsa0493252 | Liver | HCC | Non-alcoholic fatty liver disease | 124/4020 | 155/8465 | 4.54e-17 | 2.54e-15 | 1.41e-15 | 124 |
| hsa0502032 | Liver | HCC | Prion disease | 195/4020 | 273/8465 | 3.26e-16 | 1.56e-14 | 8.67e-15 | 195 |
| hsa0471432 | Liver | HCC | Thermogenesis | 170/4020 | 232/8465 | 5.36e-16 | 2.25e-14 | 1.25e-14 | 170 |
| hsa0541532 | Liver | HCC | Diabetic cardiomyopathy | 151/4020 | 203/8465 | 2.72e-15 | 1.01e-13 | 5.63e-14 | 151 |
| hsa0501032 | Liver | HCC | Alzheimer disease | 254/4020 | 384/8465 | 3.75e-14 | 8.97e-13 | 4.99e-13 | 254 |
| Page: 1 2 |
Top |
Cell-cell communication analysis |
| Identification of potential cell-cell interactions between two cell types and their ligand-receptor pairs for different disease states |
| Ligand | Receptor | LRpair | Pathway | Tissue | Disease Stage |
| Page: 1 |
Top |
Single-cell gene regulatory network inference analysis |
| Find out the significant the regulons (TFs) and the target genes of each regulon across cell types for different disease states |
| TF | Cell Type | Tissue | Disease Stage | Target Gene | RSS | Regulon Activity |
| ∗The dot plots of a searched regulon are shown for all cell subpopulations in each disease state of each tissue based on the regulon specific score inferred using pySCENIC and by calculating the average expression. |
| Page: 1 |
Top |
Somatic mutation of malignant transformation related genes |
| Annotation of somatic variants for genes involved in malignant transformation |
| Hugo Symbol | Variant Class | Variant Classification | dbSNP RS | HGVSc | HGVSp | HGVSp Short | SWISSPROT | BIOTYPE | SIFT | PolyPhen | Tumor Sample Barcode | Tissue | Histology | Sex | Age | Stage | Therapy Types | Drugs | Outcome |
| COX7B2 | SNV | Missense_Mutation | c.107N>G | p.Asp36Gly | p.D36G | Q8TF08 | protein_coding | deleterious(0.03) | probably_damaging(0.999) | TCGA-A8-A07R-01 | Breast | breast invasive carcinoma | Female | >=65 | III/IV | Ancillary | zoledronic | SD | |
| COX7B2 | SNV | Missense_Mutation | c.199N>A | p.Leu67Ile | p.L67I | Q8TF08 | protein_coding | tolerated(0.05) | possibly_damaging(0.812) | TCGA-A5-A1OF-01 | Endometrium | uterine corpus endometrioid carcinoma | Female | <65 | I/II | Unknown | Unknown | SD | |
| COX7B2 | SNV | Missense_Mutation | rs538139494 | c.221C>T | p.Thr74Ile | p.T74I | Q8TF08 | protein_coding | tolerated(0.09) | benign(0.247) | TCGA-B5-A11W-01 | Endometrium | uterine corpus endometrioid carcinoma | Female | <65 | I/II | Unknown | Unknown | SD |
| COX7B2 | SNV | Missense_Mutation | rs758050453 | c.131N>T | p.Ala44Val | p.A44V | Q8TF08 | protein_coding | tolerated(0.85) | benign(0.043) | TCGA-D1-A175-01 | Endometrium | uterine corpus endometrioid carcinoma | Female | <65 | I/II | Chemotherapy | paclitaxel | SD |
| COX7B2 | SNV | Missense_Mutation | novel | c.42N>T | p.Lys14Asn | p.K14N | Q8TF08 | protein_coding | tolerated(0.26) | benign(0.072) | TCGA-EY-A1GI-01 | Endometrium | uterine corpus endometrioid carcinoma | Female | <65 | I/II | Unknown | Unknown | SD |
| COX7B2 | SNV | Missense_Mutation | c.190G>C | p.Glu64Gln | p.E64Q | Q8TF08 | protein_coding | tolerated(0.12) | benign(0.037) | TCGA-49-AARE-01 | Lung | lung adenocarcinoma | Female | <65 | I/II | Unknown | Unknown | PD | |
| COX7B2 | SNV | Missense_Mutation | rs373085380 | c.121N>A | p.Ala41Thr | p.A41T | Q8TF08 | protein_coding | tolerated(0.59) | benign(0.001) | TCGA-50-5946-01 | Lung | lung adenocarcinoma | Male | <65 | I/II | Unknown | Unknown | PD |
| COX7B2 | SNV | Missense_Mutation | c.215N>T | p.Arg72Ile | p.R72I | Q8TF08 | protein_coding | deleterious(0) | probably_damaging(0.999) | TCGA-18-3414-01 | Lung | lung squamous cell carcinoma | Male | >=65 | III/IV | Unknown | Unknown | SD | |
| COX7B2 | SNV | Missense_Mutation | novel | c.223N>A | p.Pro75Thr | p.P75T | Q8TF08 | protein_coding | deleterious(0.01) | probably_damaging(0.935) | TCGA-39-5016-01 | Lung | lung squamous cell carcinoma | Male | <65 | I/II | Unknown | Unknown | SD |
| COX7B2 | SNV | Missense_Mutation | c.43N>T | p.Ile15Phe | p.I15F | Q8TF08 | protein_coding | tolerated(0.25) | benign(0.346) | TCGA-63-5131-01 | Lung | lung squamous cell carcinoma | Male | Unknown | I/II | Unknown | Unknown | SD |
| Page: 1 2 |
Top |
Related drugs of malignant transformation related genes |
| Identification of chemicals and drugs interact with genes involved in malignant transfromation |
| (DGIdb 4.0) |
| Entrez ID | Symbol | Category | Interaction Types | Drug Claim Name | Drug Name | PMIDs |
| Page: 1 |

Copyright 2023-Present -The University of Texas Health Science Center at Houston |