
|
|||||
|
 | |
| |
| |
| |
| |
| |
|
Gene: COX7A2L |
Gene summary for COX7A2L |
| Gene information | Species | Human | Gene symbol | COX7A2L | Gene ID | 9167 |
| Gene name | cytochrome c oxidase subunit 7A2 like | |
| Gene Alias | COX7AR | |
| Cytomap | 2p21 | |
| Gene Type | protein-coding | GO ID | GO:0002082 | UniProtAcc | O14548 |
Top |
Malignant transformation analysis |
| Identification of the aberrant gene expression in precancerous and cancerous lesions by comparing the gene expression of stem-like cells in diseased tissues with normal stem cells |
| Entrez ID | Symbol | Replicates | Species | Organ | Tissue | Adj P-value | Log2FC | Malignancy |
| 9167 | COX7A2L | HTA11_3410_2000001011 | Human | Colorectum | AD | 2.09e-03 | 2.17e-01 | 0.0155 |
| 9167 | COX7A2L | HTA11_1938_2000001011 | Human | Colorectum | AD | 1.87e-07 | 5.43e-01 | -0.0811 |
| 9167 | COX7A2L | HTA11_78_2000001011 | Human | Colorectum | AD | 2.16e-04 | 4.86e-01 | -0.1088 |
| 9167 | COX7A2L | HTA11_347_2000001011 | Human | Colorectum | AD | 4.36e-18 | 6.72e-01 | -0.1954 |
| 9167 | COX7A2L | HTA11_83_2000001011 | Human | Colorectum | SER | 8.59e-04 | 4.40e-01 | -0.1526 |
| 9167 | COX7A2L | HTA11_1391_2000001011 | Human | Colorectum | AD | 8.94e-08 | 5.69e-01 | -0.059 |
| 9167 | COX7A2L | HTA11_7862_2000001011 | Human | Colorectum | AD | 3.02e-06 | 6.56e-01 | -0.0179 |
| 9167 | COX7A2L | HTA11_866_3004761011 | Human | Colorectum | AD | 4.41e-05 | 4.37e-01 | 0.096 |
| 9167 | COX7A2L | HTA11_4255_2000001011 | Human | Colorectum | SER | 2.35e-02 | 5.54e-01 | 0.0446 |
| 9167 | COX7A2L | HTA11_7663_2000001011 | Human | Colorectum | SER | 1.02e-03 | 6.86e-01 | 0.0131 |
| 9167 | COX7A2L | HTA11_6801_2000001011 | Human | Colorectum | SER | 4.74e-08 | 1.17e+00 | 0.0171 |
| 9167 | COX7A2L | HTA11_7696_3000711011 | Human | Colorectum | AD | 1.43e-05 | 3.77e-01 | 0.0674 |
| 9167 | COX7A2L | HTA11_7469_2000001011 | Human | Colorectum | AD | 2.52e-03 | 7.52e-01 | -0.0124 |
| 9167 | COX7A2L | HTA11_99999970781_79442 | Human | Colorectum | MSS | 1.24e-17 | 7.83e-01 | 0.294 |
| 9167 | COX7A2L | HTA11_99999965104_69814 | Human | Colorectum | MSS | 4.39e-10 | 7.52e-01 | 0.281 |
| 9167 | COX7A2L | HTA11_99999971662_82457 | Human | Colorectum | MSS | 1.95e-23 | 9.24e-01 | 0.3859 |
| 9167 | COX7A2L | HTA11_99999974143_84620 | Human | Colorectum | MSS | 9.92e-03 | 1.76e-01 | 0.3005 |
| 9167 | COX7A2L | A015-C-203 | Human | Colorectum | FAP | 1.87e-06 | -2.58e-01 | -0.1294 |
| 9167 | COX7A2L | A001-C-119 | Human | Colorectum | FAP | 7.43e-05 | -3.67e-01 | -0.1557 |
| 9167 | COX7A2L | A001-C-108 | Human | Colorectum | FAP | 1.97e-05 | -2.79e-01 | -0.0272 |
| Page: 1 2 3 4 5 6 7 8 9 10 11 12 |
| Tissue | Expression Dynamics | Abbreviation |
| Colorectum (GSE201348) |  | FAP: Familial adenomatous polyposis |
| CRC: Colorectal cancer | ||
| Colorectum (HTA11) |  | AD: Adenomas |
| SER: Sessile serrated lesions | ||
| MSI-H: Microsatellite-high colorectal cancer | ||
| MSS: Microsatellite stable colorectal cancer | ||
| Endometrium |  | AEH: Atypical endometrial hyperplasia |
| EEC: Endometrioid Cancer | ||
| Esophagus | 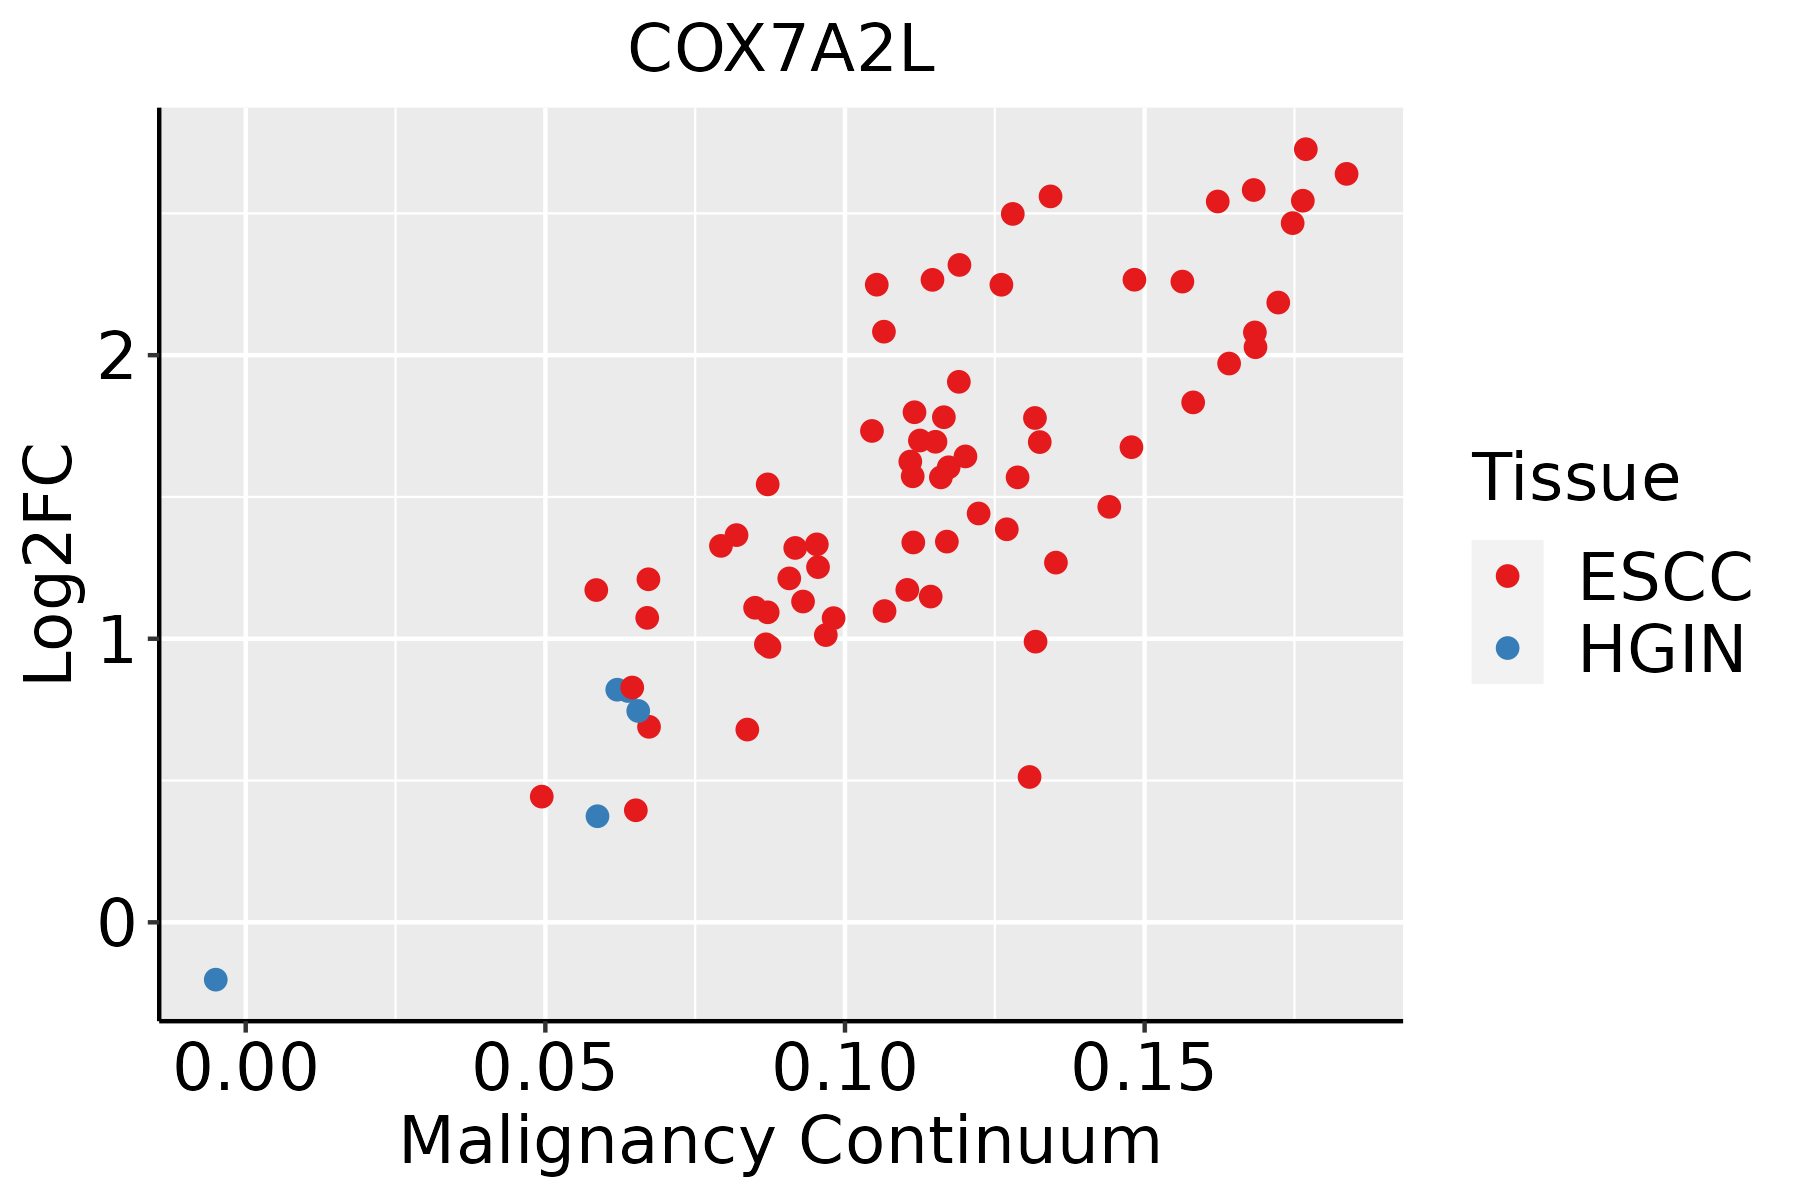 | ESCC: Esophageal squamous cell carcinoma |
| HGIN: High-grade intraepithelial neoplasias | ||
| LGIN: Low-grade intraepithelial neoplasias | ||
| GC | 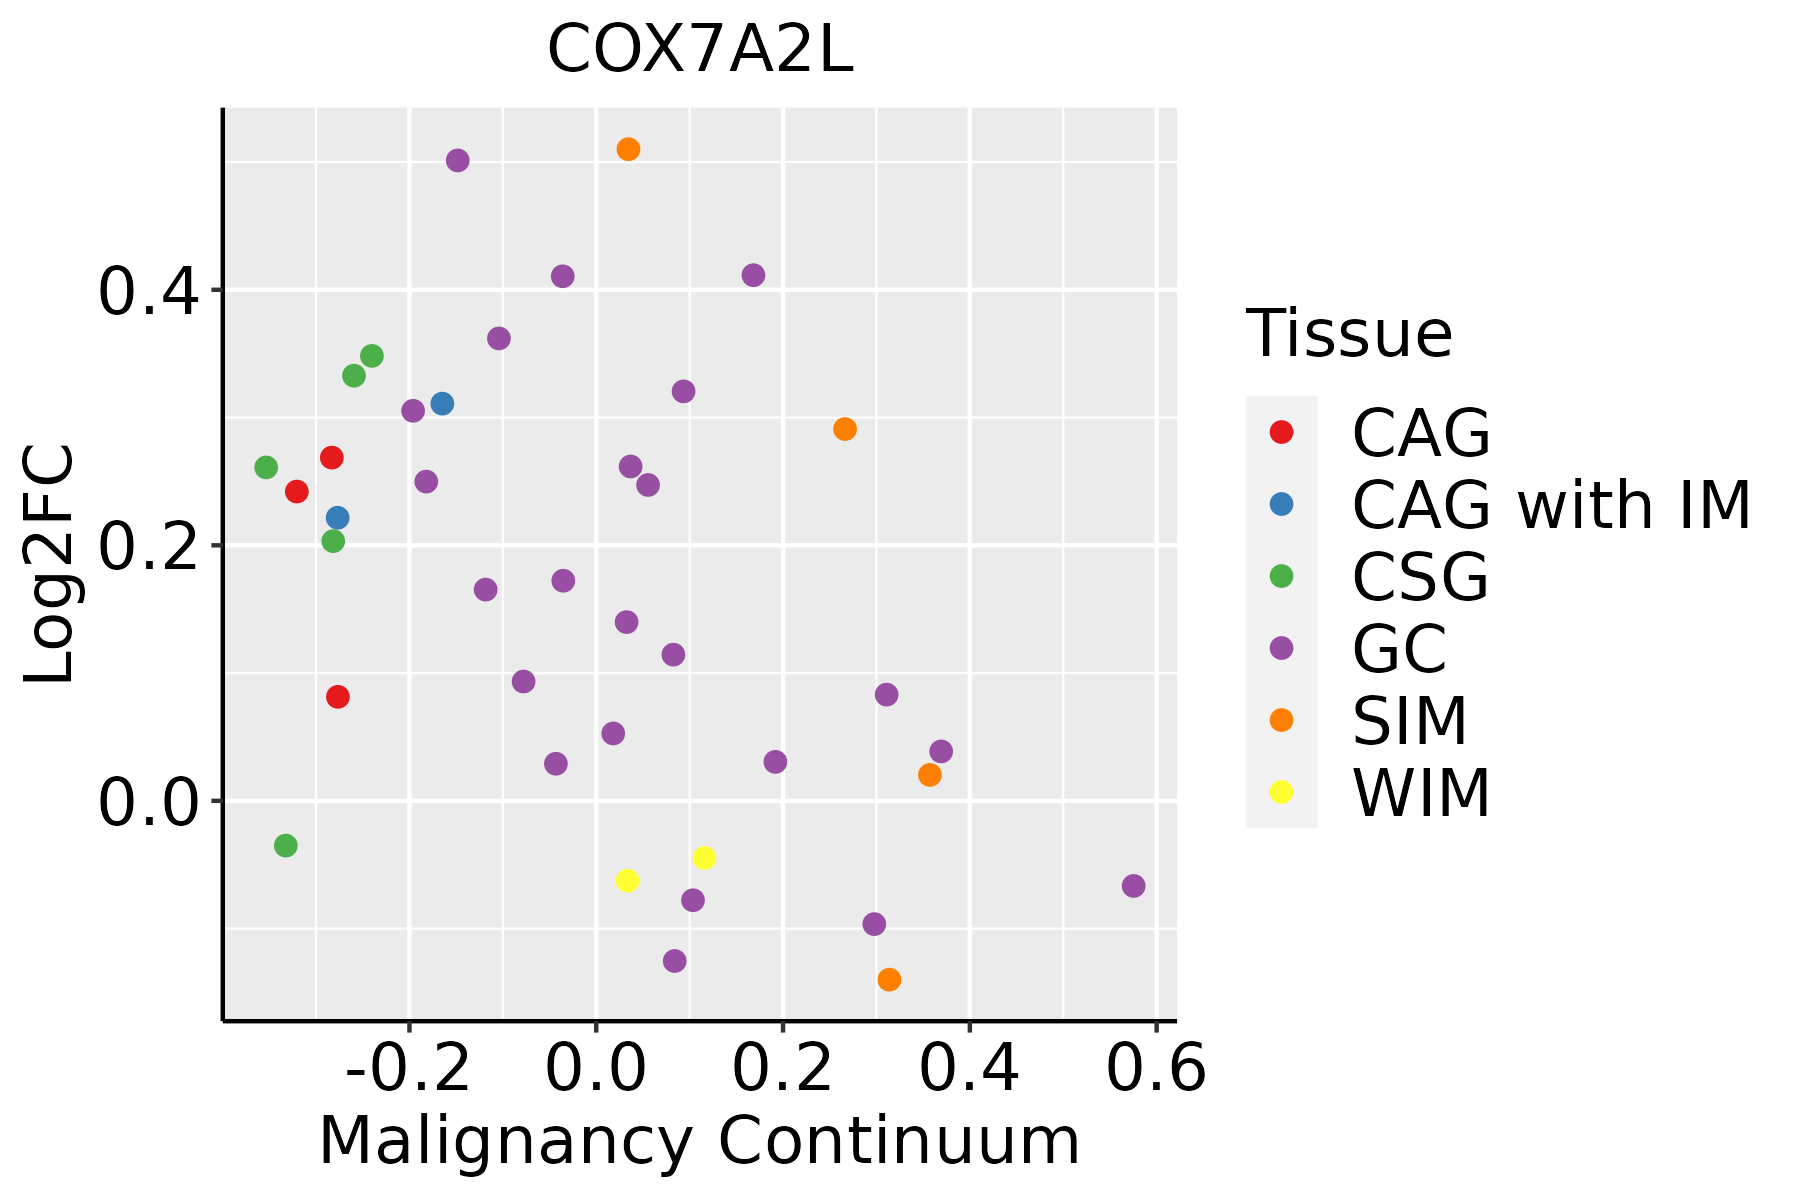 | CAG: Chronic atrophic gastritis |
| CAG with IM: Chronic atrophic gastritis with intestinal metaplasia | ||
| CSG: Chronic superficial gastritis | ||
| GC: Gastric cancer | ||
| SIM: Severe intestinal metaplasia | ||
| WIM: Wild intestinal metaplasia | ||
| Liver |  | HCC: Hepatocellular carcinoma |
| NAFLD: Non-alcoholic fatty liver disease | ||
| Oral Cavity | 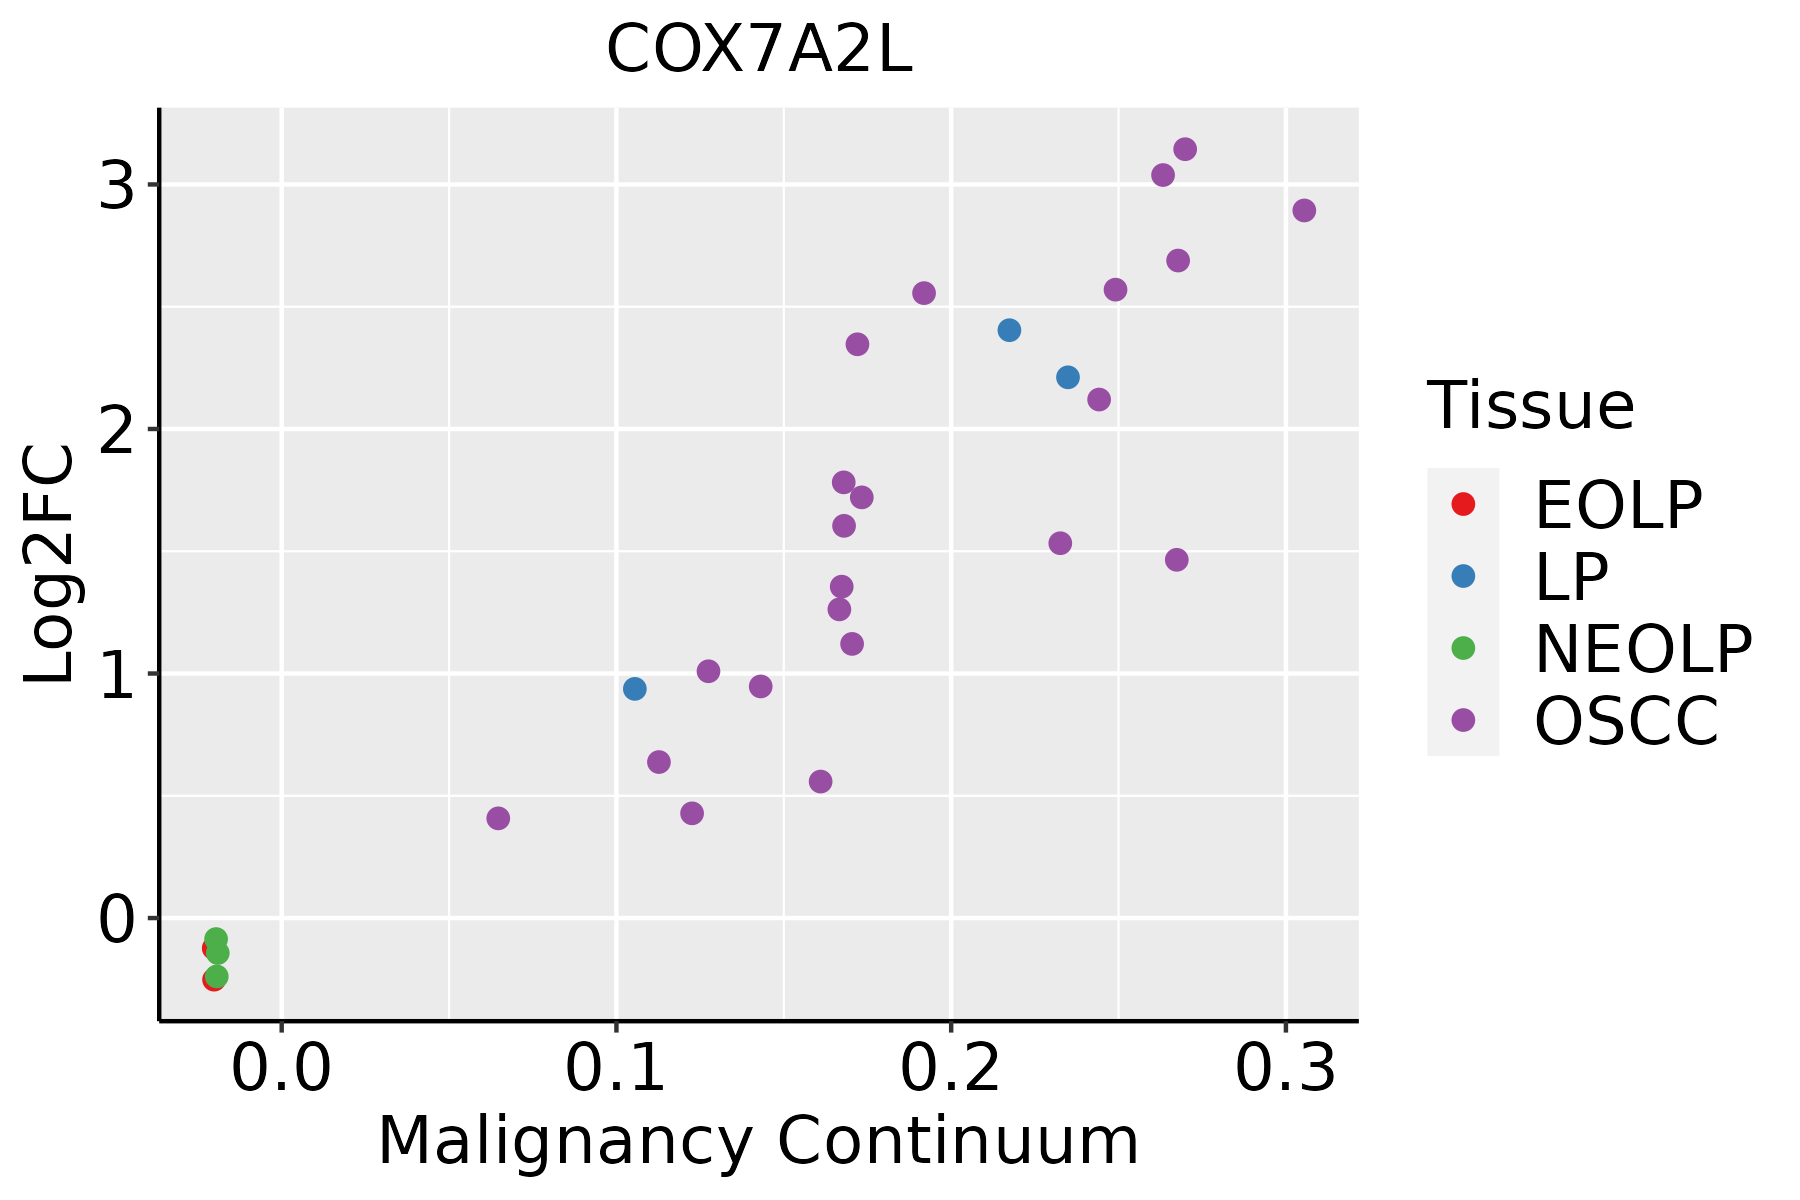 | EOLP: Erosive Oral lichen planus |
| LP: leukoplakia | ||
| NEOLP: Non-erosive oral lichen planus | ||
| OSCC: Oral squamous cell carcinoma | ||
| Prostate |  | BPH: Benign Prostatic Hyperplasia |
| Skin | 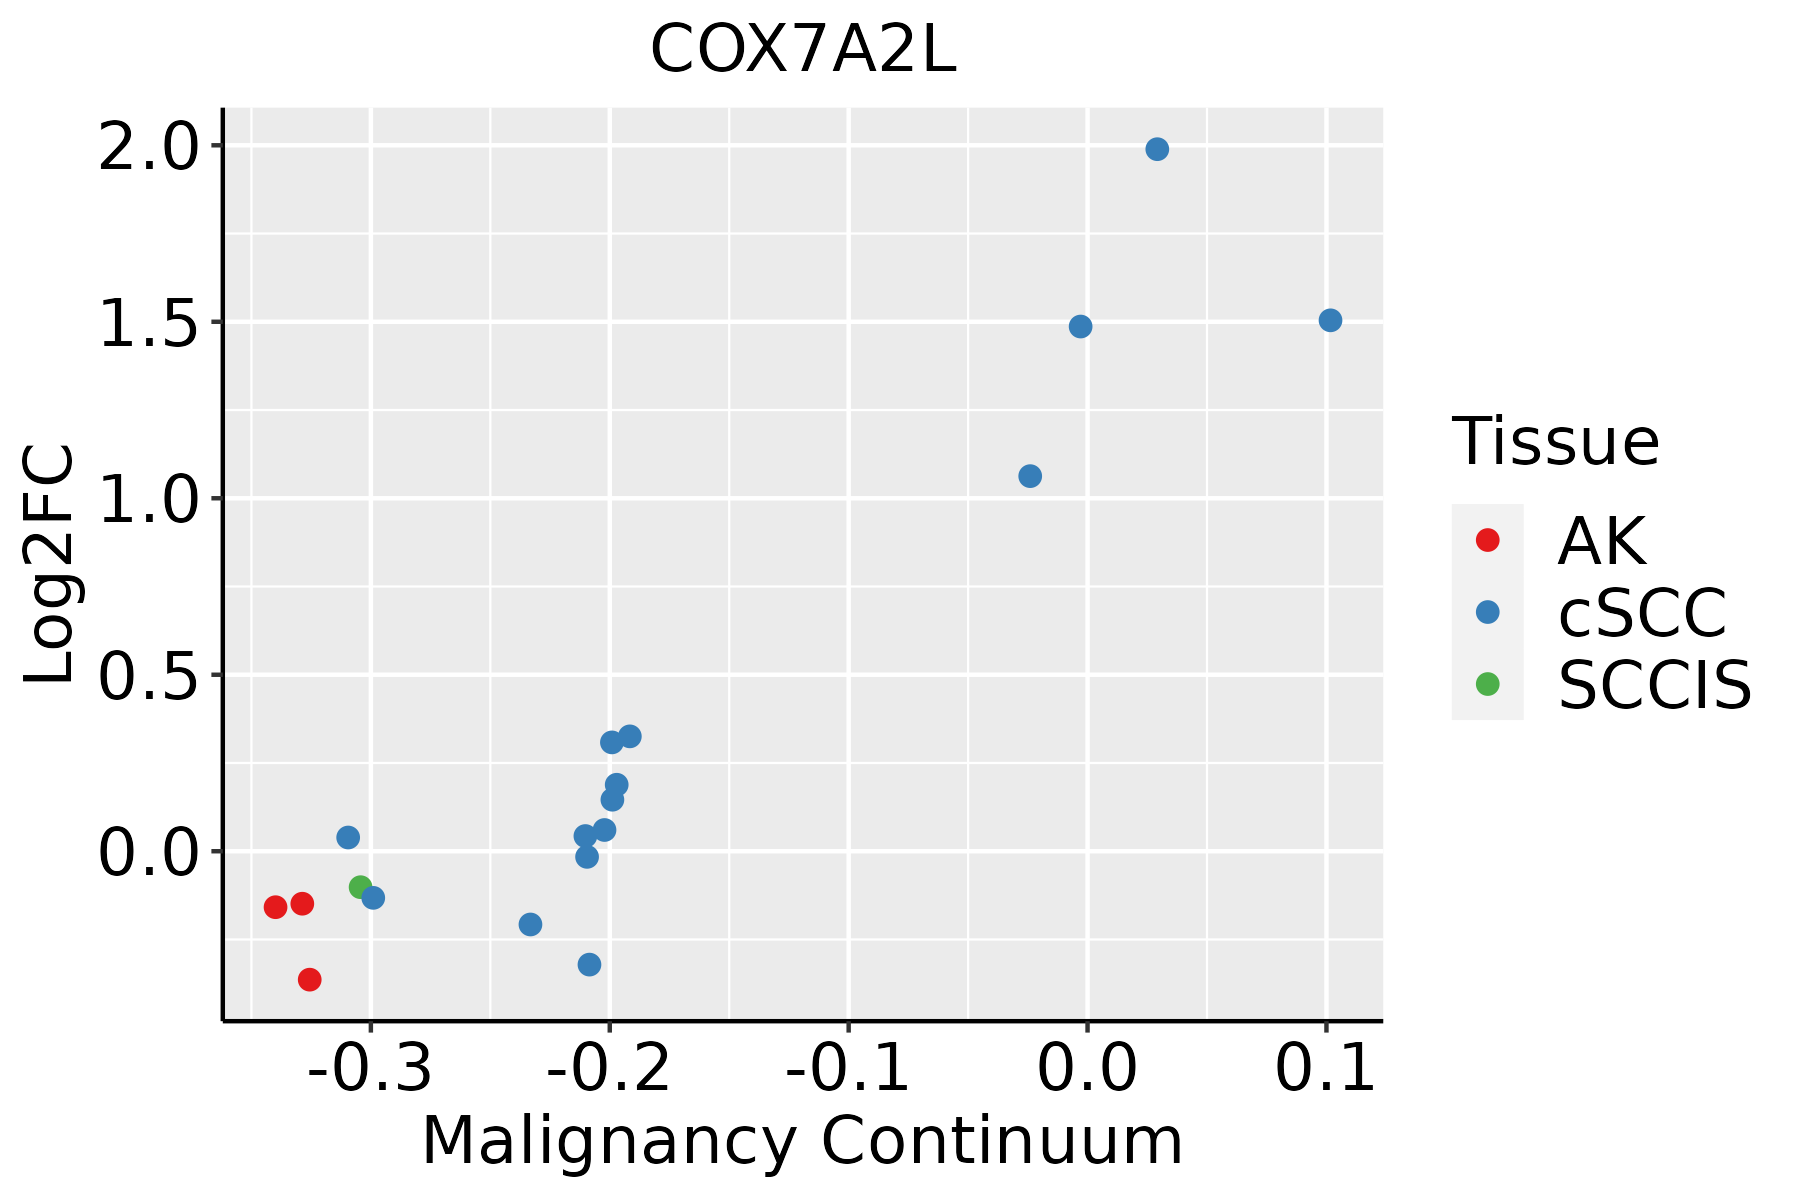 | AK: Actinic keratosis |
| cSCC: Cutaneous squamous cell carcinoma | ||
| SCCIS:squamous cell carcinoma in situ | ||
| Thyroid | 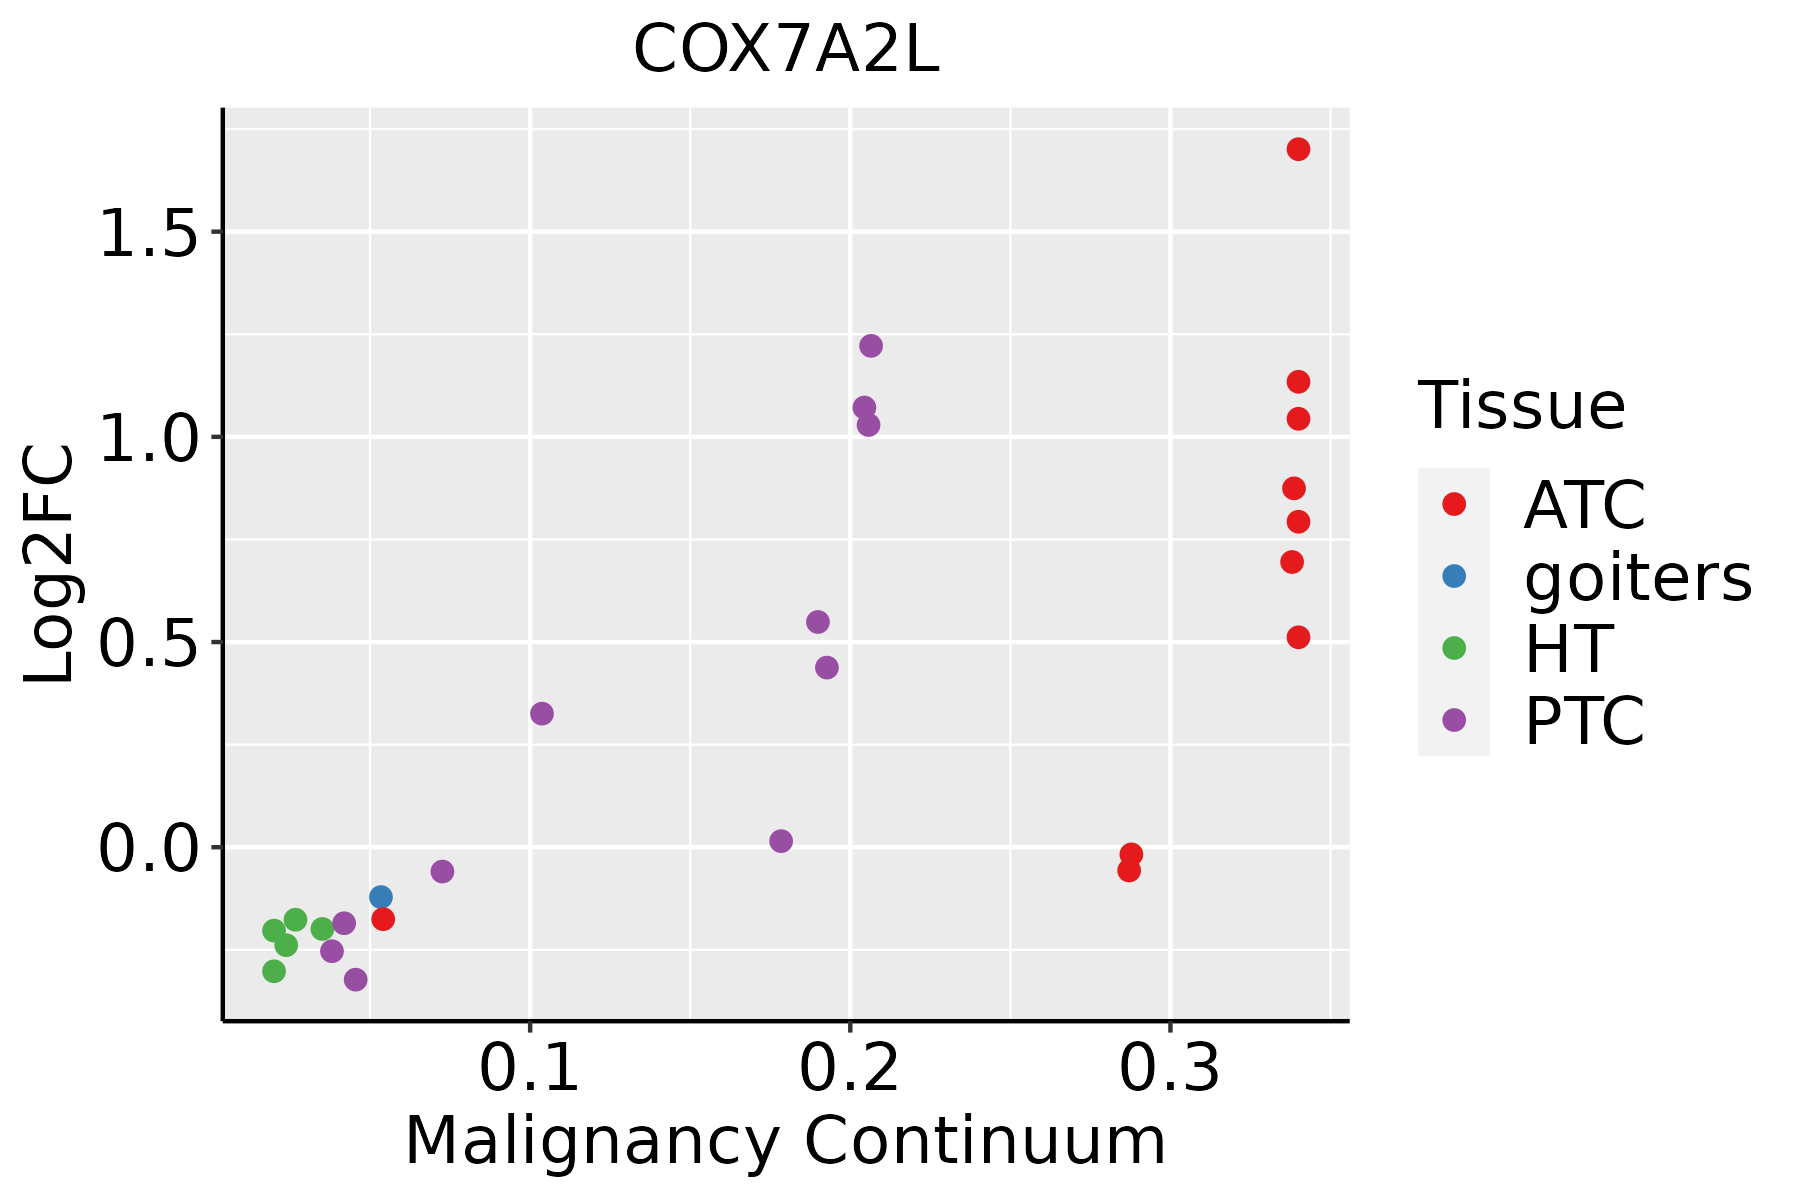 | ATC: Anaplastic thyroid cancer |
| HT: Hashimoto's thyroiditis | ||
| PTC: Papillary thyroid cancer |
| ∗log2FC in expression of this searched gene in stem-like cells from each diseased tissue sample relative to stem-like cells in normal samples in each tissue plotted against the malignancy continuum. Samples are colored based on if they are from different disease stage. |
Top |
Malignant transformation related pathway analysis |
| Find out the enriched GO biological processes and KEGG pathways involved in transition from healthy to precancer to cancer |
| Tissue | Disease Stage | Enriched GO biological Processes |
| Colorectum | AD |  |
| Colorectum | SER |  |
| Colorectum | MSS |  |
| Colorectum | MSI-H |  |
| Colorectum | FAP |  |
| ∗Top 15 enriched GO BP terms are showed in the bar plot of each disease state in each tissue. Each row represents a significant GO biological process which is colored according to the -log10(p.adjust). |
| Page: 1 2 3 4 5 6 7 8 9 |
| GO ID | Tissue | Disease Stage | Description | Gene Ratio | Bg Ratio | pvalue | p.adjust | Count |
| GO:0046034 | Colorectum | AD | ATP metabolic process | 142/3918 | 277/18723 | 2.64e-29 | 8.26e-26 | 142 |
| GO:0006091 | Colorectum | AD | generation of precursor metabolites and energy | 209/3918 | 490/18723 | 3.17e-28 | 6.61e-25 | 209 |
| GO:0009060 | Colorectum | AD | aerobic respiration | 108/3918 | 189/18723 | 9.14e-28 | 1.43e-24 | 108 |
| GO:0045333 | Colorectum | AD | cellular respiration | 119/3918 | 230/18723 | 3.21e-25 | 4.02e-22 | 119 |
| GO:0006119 | Colorectum | AD | oxidative phosphorylation | 83/3918 | 141/18723 | 7.95e-23 | 8.30e-20 | 83 |
| GO:0015980 | Colorectum | AD | energy derivation by oxidation of organic compounds | 143/3918 | 318/18723 | 2.78e-22 | 2.49e-19 | 143 |
| GO:0022900 | Colorectum | AD | electron transport chain | 89/3918 | 175/18723 | 1.42e-18 | 8.91e-16 | 89 |
| GO:0019646 | Colorectum | AD | aerobic electron transport chain | 53/3918 | 87/18723 | 5.58e-16 | 2.16e-13 | 53 |
| GO:0042773 | Colorectum | AD | ATP synthesis coupled electron transport | 56/3918 | 95/18723 | 6.76e-16 | 2.22e-13 | 56 |
| GO:0042775 | Colorectum | AD | mitochondrial ATP synthesis coupled electron transport | 56/3918 | 95/18723 | 6.76e-16 | 2.22e-13 | 56 |
| GO:0022904 | Colorectum | AD | respiratory electron transport chain | 63/3918 | 114/18723 | 8.23e-16 | 2.45e-13 | 63 |
| GO:1902600 | Colorectum | AD | proton transmembrane transport | 66/3918 | 157/18723 | 1.59e-09 | 1.17e-07 | 66 |
| GO:0043467 | Colorectum | AD | regulation of generation of precursor metabolites and energy | 49/3918 | 130/18723 | 8.33e-06 | 1.99e-04 | 49 |
| GO:1903578 | Colorectum | AD | regulation of ATP metabolic process | 34/3918 | 87/18723 | 8.30e-05 | 1.30e-03 | 34 |
| GO:0043457 | Colorectum | AD | regulation of cellular respiration | 20/3918 | 49/18723 | 1.23e-03 | 1.09e-02 | 20 |
| GO:1903715 | Colorectum | AD | regulation of aerobic respiration | 15/3918 | 33/18723 | 1.36e-03 | 1.18e-02 | 15 |
| GO:0006123 | Colorectum | AD | mitochondrial electron transport, cytochrome c to oxygen | 10/3918 | 21/18723 | 5.71e-03 | 3.64e-02 | 10 |
| GO:00090601 | Colorectum | SER | aerobic respiration | 96/2897 | 189/18723 | 5.53e-30 | 1.70e-26 | 96 |
| GO:00460341 | Colorectum | SER | ATP metabolic process | 117/2897 | 277/18723 | 5.54e-27 | 1.13e-23 | 117 |
| GO:00453331 | Colorectum | SER | cellular respiration | 103/2897 | 230/18723 | 2.35e-26 | 3.61e-23 | 103 |
| Page: 1 2 3 4 5 6 7 8 9 10 11 12 13 14 15 16 17 18 19 20 |
| Pathway ID | Tissue | Disease Stage | Description | Gene Ratio | Bg Ratio | pvalue | p.adjust | qvalue | Count |
| hsa05012 | Colorectum | AD | Parkinson disease | 147/2092 | 266/8465 | 2.53e-27 | 8.48e-25 | 5.41e-25 | 147 |
| hsa05208 | Colorectum | AD | Chemical carcinogenesis - reactive oxygen species | 126/2092 | 223/8465 | 1.01e-24 | 1.68e-22 | 1.07e-22 | 126 |
| hsa00190 | Colorectum | AD | Oxidative phosphorylation | 86/2092 | 134/8465 | 2.47e-22 | 2.76e-20 | 1.76e-20 | 86 |
| hsa05415 | Colorectum | AD | Diabetic cardiomyopathy | 114/2092 | 203/8465 | 3.65e-22 | 3.06e-20 | 1.95e-20 | 114 |
| hsa05010 | Colorectum | AD | Alzheimer disease | 174/2092 | 384/8465 | 1.82e-19 | 9.26e-18 | 5.91e-18 | 174 |
| hsa05016 | Colorectum | AD | Huntington disease | 147/2092 | 306/8465 | 1.93e-19 | 9.26e-18 | 5.91e-18 | 147 |
| hsa04714 | Colorectum | AD | Thermogenesis | 120/2092 | 232/8465 | 2.76e-19 | 1.16e-17 | 7.37e-18 | 120 |
| hsa04932 | Colorectum | AD | Non-alcoholic fatty liver disease | 90/2092 | 155/8465 | 4.83e-19 | 1.80e-17 | 1.15e-17 | 90 |
| hsa05020 | Colorectum | AD | Prion disease | 133/2092 | 273/8465 | 2.47e-18 | 8.29e-17 | 5.29e-17 | 133 |
| hsa05014 | Colorectum | AD | Amyotrophic lateral sclerosis | 164/2092 | 364/8465 | 4.28e-18 | 1.27e-16 | 8.09e-17 | 164 |
| hsa05022 | Colorectum | AD | Pathways of neurodegeneration - multiple diseases | 201/2092 | 476/8465 | 4.54e-18 | 1.27e-16 | 8.09e-17 | 201 |
| hsa04260 | Colorectum | AD | Cardiac muscle contraction | 32/2092 | 87/8465 | 7.92e-03 | 3.13e-02 | 2.00e-02 | 32 |
| hsa050121 | Colorectum | AD | Parkinson disease | 147/2092 | 266/8465 | 2.53e-27 | 8.48e-25 | 5.41e-25 | 147 |
| hsa052081 | Colorectum | AD | Chemical carcinogenesis - reactive oxygen species | 126/2092 | 223/8465 | 1.01e-24 | 1.68e-22 | 1.07e-22 | 126 |
| hsa001901 | Colorectum | AD | Oxidative phosphorylation | 86/2092 | 134/8465 | 2.47e-22 | 2.76e-20 | 1.76e-20 | 86 |
| hsa054151 | Colorectum | AD | Diabetic cardiomyopathy | 114/2092 | 203/8465 | 3.65e-22 | 3.06e-20 | 1.95e-20 | 114 |
| hsa050101 | Colorectum | AD | Alzheimer disease | 174/2092 | 384/8465 | 1.82e-19 | 9.26e-18 | 5.91e-18 | 174 |
| hsa050161 | Colorectum | AD | Huntington disease | 147/2092 | 306/8465 | 1.93e-19 | 9.26e-18 | 5.91e-18 | 147 |
| hsa047141 | Colorectum | AD | Thermogenesis | 120/2092 | 232/8465 | 2.76e-19 | 1.16e-17 | 7.37e-18 | 120 |
| hsa049321 | Colorectum | AD | Non-alcoholic fatty liver disease | 90/2092 | 155/8465 | 4.83e-19 | 1.80e-17 | 1.15e-17 | 90 |
| Page: 1 2 3 4 5 6 7 8 9 10 11 12 13 14 15 16 17 18 19 20 21 22 23 |
Top |
Cell-cell communication analysis |
| Identification of potential cell-cell interactions between two cell types and their ligand-receptor pairs for different disease states |
| Ligand | Receptor | LRpair | Pathway | Tissue | Disease Stage |
| Page: 1 |
Top |
Single-cell gene regulatory network inference analysis |
| Find out the significant the regulons (TFs) and the target genes of each regulon across cell types for different disease states |
| TF | Cell Type | Tissue | Disease Stage | Target Gene | RSS | Regulon Activity |
| ∗The dot plots of a searched regulon are shown for all cell subpopulations in each disease state of each tissue based on the regulon specific score inferred using pySCENIC and by calculating the average expression. |
| Page: 1 |
Top |
Somatic mutation of malignant transformation related genes |
| Annotation of somatic variants for genes involved in malignant transformation |
| Hugo Symbol | Variant Class | Variant Classification | dbSNP RS | HGVSc | HGVSp | HGVSp Short | SWISSPROT | BIOTYPE | SIFT | PolyPhen | Tumor Sample Barcode | Tissue | Histology | Sex | Age | Stage | Therapy Types | Drugs | Outcome |
| COX7A2L | SNV | Missense_Mutation | c.298N>C | p.Tyr100His | p.Y100H | O14548 | protein_coding | deleterious(0) | probably_damaging(0.995) | TCGA-D8-A1XQ-01 | Breast | breast invasive carcinoma | Female | >=65 | I/II | Unknown | Unknown | SD | |
| COX7A2L | SNV | Missense_Mutation | novel | c.263N>A | p.Arg88Gln | p.R88Q | O14548 | protein_coding | tolerated(0.05) | benign(0.104) | TCGA-Q1-A73P-01 | Cervix | cervical & endocervical cancer | Female | <65 | I/II | Unknown | Unknown | SD |
| COX7A2L | SNV | Missense_Mutation | novel | c.236N>A | p.Arg79Gln | p.R79Q | O14548 | protein_coding | tolerated(0.2) | benign(0.062) | TCGA-A6-2672-01 | Colorectum | colon adenocarcinoma | Female | >=65 | III/IV | Unknown | Unknown | SD |
| COX7A2L | SNV | Missense_Mutation | novel | c.247N>A | p.Asp83Asn | p.D83N | O14548 | protein_coding | deleterious(0.02) | possibly_damaging(0.583) | TCGA-A5-A0G2-01 | Endometrium | uterine corpus endometrioid carcinoma | Female | <65 | III/IV | Unknown | Unknown | SD |
| COX7A2L | SNV | Missense_Mutation | rs752710138 | c.310N>A | p.Ala104Thr | p.A104T | O14548 | protein_coding | tolerated(0.14) | possibly_damaging(0.683) | TCGA-AP-A1DV-01 | Endometrium | uterine corpus endometrioid carcinoma | Female | <65 | I/II | Unknown | Unknown | SD |
| COX7A2L | SNV | Missense_Mutation | rs759362219 | c.326N>T | p.Ser109Leu | p.S109L | O14548 | protein_coding | deleterious(0.01) | benign(0.36) | TCGA-AX-A05Y-01 | Endometrium | uterine corpus endometrioid carcinoma | Female | <65 | I/II | Unknown | Unknown | PD |
| COX7A2L | SNV | Missense_Mutation | novel | c.158N>G | p.Asp53Gly | p.D53G | O14548 | protein_coding | tolerated(0.14) | benign(0.055) | TCGA-B5-A3FA-01 | Endometrium | uterine corpus endometrioid carcinoma | Female | >=65 | I/II | Unknown | Unknown | SD |
| COX7A2L | SNV | Missense_Mutation | c.14N>G | p.Phe5Cys | p.F5C | O14548 | protein_coding | deleterious(0) | possibly_damaging(0.838) | TCGA-BS-A0UF-01 | Endometrium | uterine corpus endometrioid carcinoma | Female | >=65 | I/II | Unknown | Unknown | SD | |
| COX7A2L | SNV | Missense_Mutation | novel | c.325N>C | p.Ser109Pro | p.S109P | O14548 | protein_coding | deleterious(0.02) | possibly_damaging(0.782) | TCGA-D1-A175-01 | Endometrium | uterine corpus endometrioid carcinoma | Female | <65 | I/II | Chemotherapy | paclitaxel | SD |
| COX7A2L | SNV | Missense_Mutation | c.268N>T | p.Thr90Ser | p.T90S | O14548 | protein_coding | deleterious(0.01) | possibly_damaging(0.901) | TCGA-55-1592-01 | Lung | lung adenocarcinoma | Male | >=65 | I/II | Unknown | Unknown | PD |
| Page: 1 2 |
Top |
Related drugs of malignant transformation related genes |
| Identification of chemicals and drugs interact with genes involved in malignant transfromation |
| (DGIdb 4.0) |
| Entrez ID | Symbol | Category | Interaction Types | Drug Claim Name | Drug Name | PMIDs |
| Page: 1 |

Copyright 2023-Present -The University of Texas Health Science Center at Houston |