
|
|||||
|
 | |
| |
| |
| |
| |
| |
|
Gene: COX7A1 |
Gene summary for COX7A1 |
| Gene information | Species | Human | Gene symbol | COX7A1 | Gene ID | 1346 |
| Gene name | cytochrome c oxidase subunit 7A1 | |
| Gene Alias | COX7A | |
| Cytomap | 19q13.12 | |
| Gene Type | protein-coding | GO ID | GO:0002082 | UniProtAcc | P24310 |
Top |
Malignant transformation analysis |
| Identification of the aberrant gene expression in precancerous and cancerous lesions by comparing the gene expression of stem-like cells in diseased tissues with normal stem cells |
| Entrez ID | Symbol | Replicates | Species | Organ | Tissue | Adj P-value | Log2FC | Malignancy |
| 1346 | COX7A1 | C21 | Human | Oral cavity | OSCC | 2.84e-03 | -4.95e-01 | 0.2678 |
| 1346 | COX7A1 | C43 | Human | Oral cavity | OSCC | 8.91e-18 | -5.26e-01 | 0.1704 |
| 1346 | COX7A1 | C46 | Human | Oral cavity | OSCC | 4.82e-09 | -5.14e-01 | 0.1673 |
| 1346 | COX7A1 | C57 | Human | Oral cavity | OSCC | 4.26e-08 | -5.26e-01 | 0.1679 |
| 1346 | COX7A1 | C08 | Human | Oral cavity | OSCC | 8.39e-14 | -5.08e-01 | 0.1919 |
| 1346 | COX7A1 | C09 | Human | Oral cavity | OSCC | 1.74e-24 | 1.32e+00 | 0.1431 |
| 1346 | COX7A1 | LN46 | Human | Oral cavity | OSCC | 6.41e-03 | -5.13e-01 | 0.1666 |
| 1346 | COX7A1 | EOLP-1 | Human | Oral cavity | EOLP | 8.79e-03 | -3.15e-01 | -0.0202 |
| 1346 | COX7A1 | NEOLP-2 | Human | Oral cavity | NEOLP | 3.94e-04 | 7.73e-02 | -0.0196 |
| 1346 | COX7A1 | NEOLP-3 | Human | Oral cavity | NEOLP | 1.29e-06 | -1.72e-02 | -0.0191 |
| 1346 | COX7A1 | SYSMH1 | Human | Oral cavity | OSCC | 2.03e-17 | -5.17e-01 | 0.1127 |
| 1346 | COX7A1 | SYSMH2 | Human | Oral cavity | OSCC | 2.03e-11 | -4.91e-01 | 0.2326 |
| 1346 | COX7A1 | SYSMH3 | Human | Oral cavity | OSCC | 8.72e-15 | -3.90e-01 | 0.2442 |
| 1346 | COX7A1 | SYSMH4 | Human | Oral cavity | OSCC | 2.74e-07 | -3.33e-01 | 0.1226 |
| 1346 | COX7A1 | SYSMH5 | Human | Oral cavity | OSCC | 7.44e-09 | 9.55e-01 | 0.0647 |
| 1346 | COX7A1 | Adj_PTCwithHT_6 | Human | Thyroid | HT | 5.43e-04 | -2.72e-01 | 0.02 |
| 1346 | COX7A1 | male-WTA | Human | Thyroid | PTC | 8.28e-06 | -2.16e-01 | 0.1037 |
| 1346 | COX7A1 | PTC01 | Human | Thyroid | PTC | 5.55e-03 | -2.61e-01 | 0.1899 |
| 1346 | COX7A1 | PTC05 | Human | Thyroid | PTC | 6.80e-06 | 2.59e-01 | 0.2065 |
| 1346 | COX7A1 | PTC07 | Human | Thyroid | PTC | 7.61e-17 | 3.43e-01 | 0.2044 |
| Page: 1 2 |
| Tissue | Expression Dynamics | Abbreviation |
| Oral Cavity |  | EOLP: Erosive Oral lichen planus |
| LP: leukoplakia | ||
| NEOLP: Non-erosive oral lichen planus | ||
| OSCC: Oral squamous cell carcinoma | ||
| Thyroid | 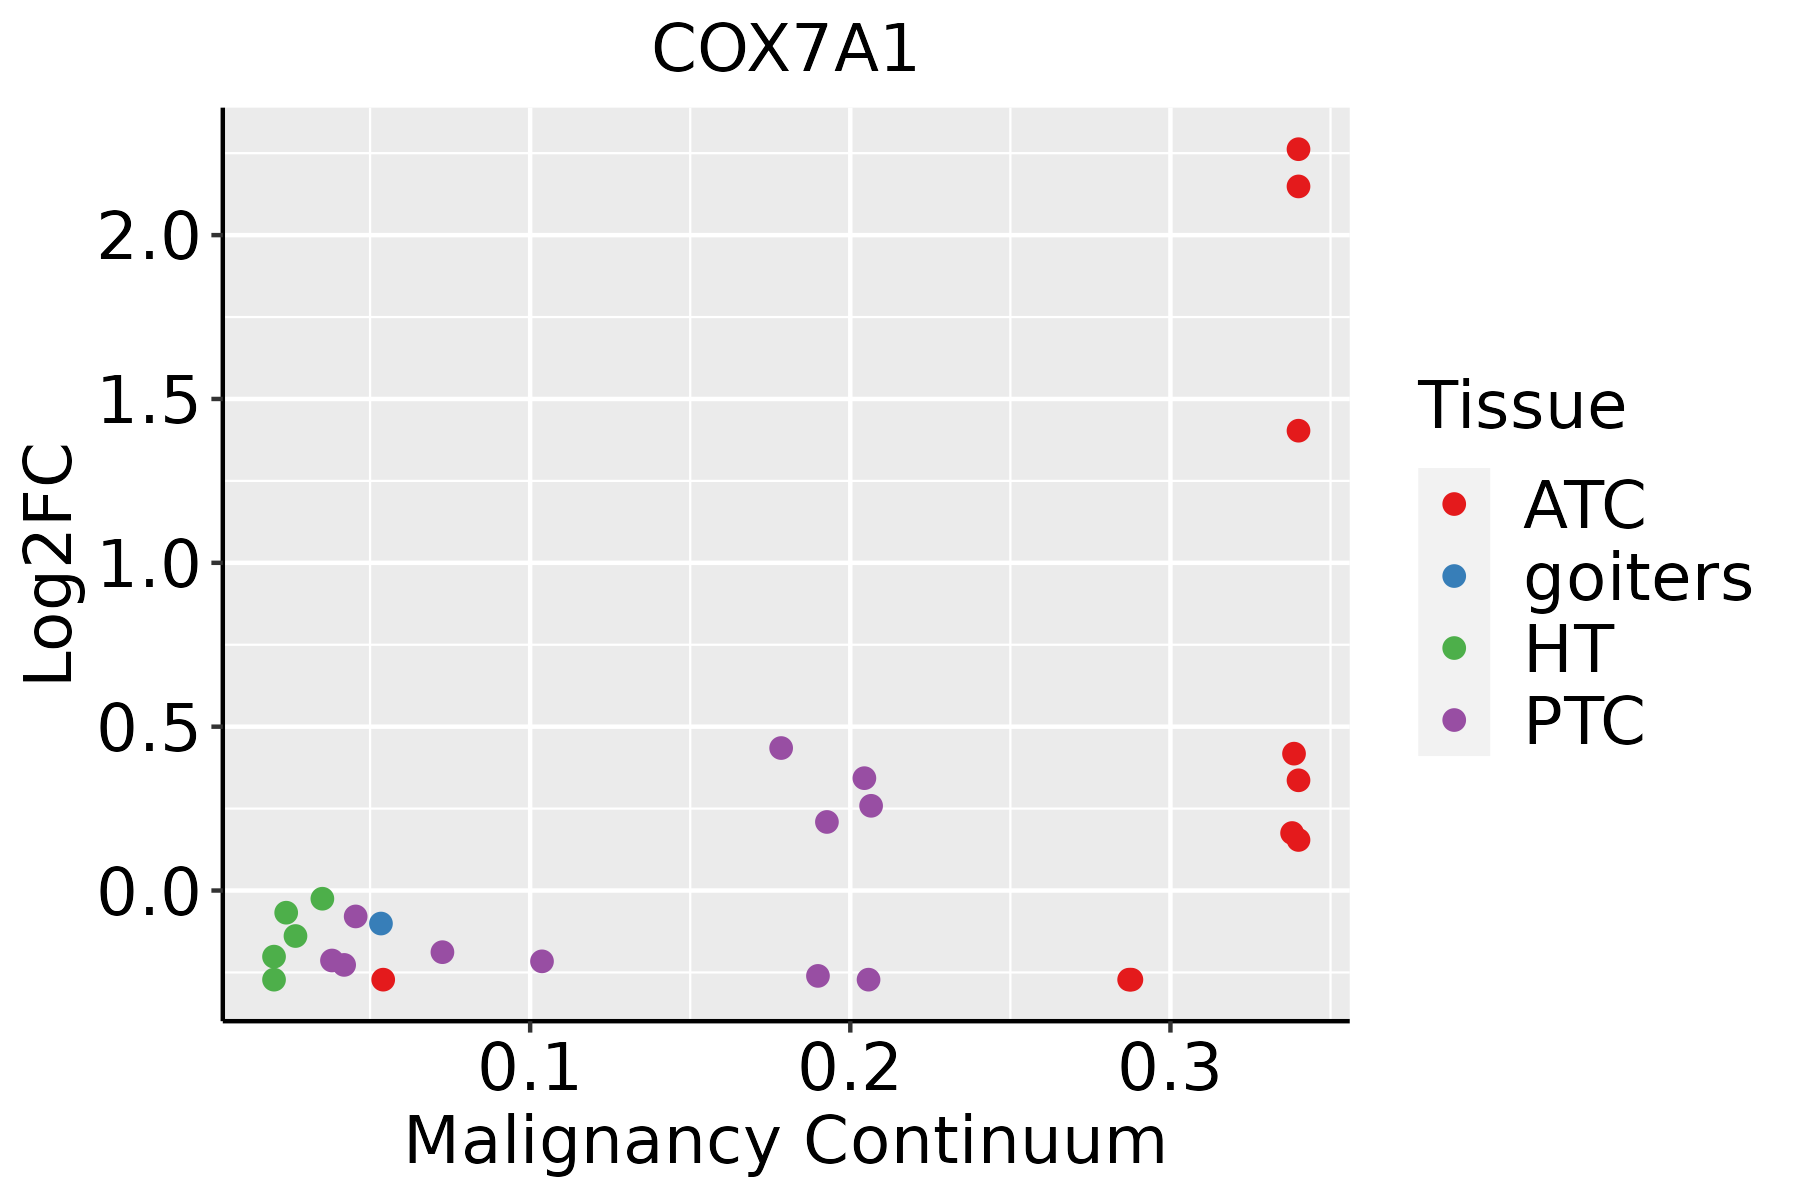 | ATC: Anaplastic thyroid cancer |
| HT: Hashimoto's thyroiditis | ||
| PTC: Papillary thyroid cancer |
| ∗log2FC in expression of this searched gene in stem-like cells from each diseased tissue sample relative to stem-like cells in normal samples in each tissue plotted against the malignancy continuum. Samples are colored based on if they are from different disease stage. |
Top |
Malignant transformation related pathway analysis |
| Find out the enriched GO biological processes and KEGG pathways involved in transition from healthy to precancer to cancer |
| Tissue | Disease Stage | Enriched GO biological Processes |
| Colorectum | AD |  |
| Colorectum | SER |  |
| Colorectum | MSS |  |
| Colorectum | MSI-H |  |
| Colorectum | FAP |  |
| ∗Top 15 enriched GO BP terms are showed in the bar plot of each disease state in each tissue. Each row represents a significant GO biological process which is colored according to the -log10(p.adjust). |
| Page: 1 2 3 4 5 6 7 8 9 |
| GO ID | Tissue | Disease Stage | Description | Gene Ratio | Bg Ratio | pvalue | p.adjust | Count |
| GO:002290018 | Oral cavity | OSCC | electron transport chain | 126/7305 | 175/18723 | 6.65e-19 | 8.42e-17 | 126 |
| GO:000609118 | Oral cavity | OSCC | generation of precursor metabolites and energy | 286/7305 | 490/18723 | 1.45e-18 | 1.71e-16 | 286 |
| GO:000906018 | Oral cavity | OSCC | aerobic respiration | 133/7305 | 189/18723 | 1.79e-18 | 2.02e-16 | 133 |
| GO:004533318 | Oral cavity | OSCC | cellular respiration | 153/7305 | 230/18723 | 2.07e-17 | 1.87e-15 | 153 |
| GO:004277318 | Oral cavity | OSCC | ATP synthesis coupled electron transport | 75/7305 | 95/18723 | 1.95e-15 | 1.33e-13 | 75 |
| GO:004277518 | Oral cavity | OSCC | mitochondrial ATP synthesis coupled electron transport | 75/7305 | 95/18723 | 1.95e-15 | 1.33e-13 | 75 |
| GO:002290418 | Oral cavity | OSCC | respiratory electron transport chain | 86/7305 | 114/18723 | 2.43e-15 | 1.63e-13 | 86 |
| GO:001598018 | Oral cavity | OSCC | energy derivation by oxidation of organic compounds | 190/7305 | 318/18723 | 4.10e-14 | 2.26e-12 | 190 |
| GO:001964618 | Oral cavity | OSCC | aerobic electron transport chain | 68/7305 | 87/18723 | 9.88e-14 | 5.17e-12 | 68 |
| GO:004603420 | Oral cavity | OSCC | ATP metabolic process | 166/7305 | 277/18723 | 1.16e-12 | 5.12e-11 | 166 |
| GO:000611919 | Oral cavity | OSCC | oxidative phosphorylation | 96/7305 | 141/18723 | 2.33e-12 | 9.75e-11 | 96 |
| GO:004346716 | Oral cavity | OSCC | regulation of generation of precursor metabolites and energy | 71/7305 | 130/18723 | 2.15e-04 | 1.41e-03 | 71 |
| GO:19037158 | Oral cavity | OSCC | regulation of aerobic respiration | 23/7305 | 33/18723 | 3.47e-04 | 2.12e-03 | 23 |
| GO:00434577 | Oral cavity | OSCC | regulation of cellular respiration | 31/7305 | 49/18723 | 5.04e-04 | 2.95e-03 | 31 |
| GO:190357819 | Oral cavity | OSCC | regulation of ATP metabolic process | 46/7305 | 87/18723 | 5.93e-03 | 2.26e-02 | 46 |
| GO:00020823 | Oral cavity | OSCC | regulation of oxidative phosphorylation | 15/7305 | 23/18723 | 9.84e-03 | 3.46e-02 | 15 |
| GO:004603426 | Oral cavity | EOLP | ATP metabolic process | 68/2218 | 277/18723 | 2.72e-09 | 1.71e-07 | 68 |
| GO:001964625 | Oral cavity | EOLP | aerobic electron transport chain | 26/2218 | 87/18723 | 5.15e-06 | 1.04e-04 | 26 |
| GO:004277325 | Oral cavity | EOLP | ATP synthesis coupled electron transport | 27/2218 | 95/18723 | 9.68e-06 | 1.75e-04 | 27 |
| GO:004277525 | Oral cavity | EOLP | mitochondrial ATP synthesis coupled electron transport | 27/2218 | 95/18723 | 9.68e-06 | 1.75e-04 | 27 |
| Page: 1 2 3 4 5 |
| Pathway ID | Tissue | Disease Stage | Description | Gene Ratio | Bg Ratio | pvalue | p.adjust | qvalue | Count |
| hsa0501428 | Oral cavity | OSCC | Amyotrophic lateral sclerosis | 246/3704 | 364/8465 | 6.65e-21 | 1.11e-18 | 5.67e-19 | 246 |
| hsa0493228 | Oral cavity | OSCC | Non-alcoholic fatty liver disease | 124/3704 | 155/8465 | 1.22e-20 | 1.37e-18 | 6.96e-19 | 124 |
| hsa0501230 | Oral cavity | OSCC | Parkinson disease | 188/3704 | 266/8465 | 1.82e-19 | 1.52e-17 | 7.75e-18 | 188 |
| hsa0501628 | Oral cavity | OSCC | Huntington disease | 204/3704 | 306/8465 | 1.70e-16 | 7.13e-15 | 3.63e-15 | 204 |
| hsa0501028 | Oral cavity | OSCC | Alzheimer disease | 244/3704 | 384/8465 | 1.18e-15 | 3.60e-14 | 1.83e-14 | 244 |
| hsa0502228 | Oral cavity | OSCC | Pathways of neurodegeneration - multiple diseases | 292/3704 | 476/8465 | 1.60e-15 | 4.47e-14 | 2.28e-14 | 292 |
| hsa0502028 | Oral cavity | OSCC | Prion disease | 181/3704 | 273/8465 | 2.05e-14 | 5.30e-13 | 2.70e-13 | 181 |
| hsa0520830 | Oral cavity | OSCC | Chemical carcinogenesis - reactive oxygen species | 150/3704 | 223/8465 | 6.45e-13 | 1.20e-11 | 6.11e-12 | 150 |
| hsa0541529 | Oral cavity | OSCC | Diabetic cardiomyopathy | 131/3704 | 203/8465 | 1.33e-09 | 1.49e-08 | 7.57e-09 | 131 |
| hsa0019028 | Oral cavity | OSCC | Oxidative phosphorylation | 88/3704 | 134/8465 | 2.15e-07 | 1.44e-06 | 7.32e-07 | 88 |
| hsa0471430 | Oral cavity | OSCC | Thermogenesis | 138/3704 | 232/8465 | 7.67e-07 | 4.35e-06 | 2.22e-06 | 138 |
| hsa05014112 | Oral cavity | OSCC | Amyotrophic lateral sclerosis | 246/3704 | 364/8465 | 6.65e-21 | 1.11e-18 | 5.67e-19 | 246 |
| hsa04932112 | Oral cavity | OSCC | Non-alcoholic fatty liver disease | 124/3704 | 155/8465 | 1.22e-20 | 1.37e-18 | 6.96e-19 | 124 |
| hsa05012113 | Oral cavity | OSCC | Parkinson disease | 188/3704 | 266/8465 | 1.82e-19 | 1.52e-17 | 7.75e-18 | 188 |
| hsa05016112 | Oral cavity | OSCC | Huntington disease | 204/3704 | 306/8465 | 1.70e-16 | 7.13e-15 | 3.63e-15 | 204 |
| hsa05010112 | Oral cavity | OSCC | Alzheimer disease | 244/3704 | 384/8465 | 1.18e-15 | 3.60e-14 | 1.83e-14 | 244 |
| hsa05022112 | Oral cavity | OSCC | Pathways of neurodegeneration - multiple diseases | 292/3704 | 476/8465 | 1.60e-15 | 4.47e-14 | 2.28e-14 | 292 |
| hsa05020112 | Oral cavity | OSCC | Prion disease | 181/3704 | 273/8465 | 2.05e-14 | 5.30e-13 | 2.70e-13 | 181 |
| hsa05208114 | Oral cavity | OSCC | Chemical carcinogenesis - reactive oxygen species | 150/3704 | 223/8465 | 6.45e-13 | 1.20e-11 | 6.11e-12 | 150 |
| hsa05415113 | Oral cavity | OSCC | Diabetic cardiomyopathy | 131/3704 | 203/8465 | 1.33e-09 | 1.49e-08 | 7.57e-09 | 131 |
| Page: 1 2 3 4 |
Top |
Cell-cell communication analysis |
| Identification of potential cell-cell interactions between two cell types and their ligand-receptor pairs for different disease states |
| Ligand | Receptor | LRpair | Pathway | Tissue | Disease Stage |
| Page: 1 |
Top |
Single-cell gene regulatory network inference analysis |
| Find out the significant the regulons (TFs) and the target genes of each regulon across cell types for different disease states |
| TF | Cell Type | Tissue | Disease Stage | Target Gene | RSS | Regulon Activity |
| ∗The dot plots of a searched regulon are shown for all cell subpopulations in each disease state of each tissue based on the regulon specific score inferred using pySCENIC and by calculating the average expression. |
| Page: 1 |
Top |
Somatic mutation of malignant transformation related genes |
| Annotation of somatic variants for genes involved in malignant transformation |
| Hugo Symbol | Variant Class | Variant Classification | dbSNP RS | HGVSc | HGVSp | HGVSp Short | SWISSPROT | BIOTYPE | SIFT | PolyPhen | Tumor Sample Barcode | Tissue | Histology | Sex | Age | Stage | Therapy Types | Drugs | Outcome |
| COX7A1 | SNV | Missense_Mutation | c.142N>A | p.Val48Ile | p.V48I | P24310 | protein_coding | tolerated(0.15) | benign(0.003) | TCGA-AP-A0LT-01 | Endometrium | uterine corpus endometrioid carcinoma | Female | <65 | I/II | Unknown | Unknown | SD | |
| COX7A1 | SNV | Missense_Mutation | novel | c.105G>T | p.Glu35Asp | p.E35D | P24310 | protein_coding | deleterious(0.03) | benign(0.174) | TCGA-AP-A1DK-01 | Endometrium | uterine corpus endometrioid carcinoma | Female | <65 | I/II | Unknown | Unknown | SD |
| COX7A1 | SNV | Missense_Mutation | c.26N>A | p.Ala9Glu | p.A9E | P24310 | protein_coding | tolerated(0.4) | benign(0.237) | TCGA-D1-A163-01 | Endometrium | uterine corpus endometrioid carcinoma | Female | <65 | III/IV | Chemotherapy | taxol | SD | |
| COX7A1 | SNV | Missense_Mutation | c.79C>T | p.Arg27Cys | p.R27C | P24310 | protein_coding | deleterious(0) | benign(0.289) | TCGA-D1-A16F-01 | Endometrium | uterine corpus endometrioid carcinoma | Female | <65 | I/II | Unknown | Unknown | SD | |
| COX7A1 | SNV | Missense_Mutation | novel | c.190A>G | p.Thr64Ala | p.T64A | P24310 | protein_coding | tolerated(0.05) | benign(0.134) | TCGA-EO-A22U-01 | Endometrium | uterine corpus endometrioid carcinoma | Female | >=65 | I/II | Unknown | Unknown | SD |
| COX7A1 | SNV | Missense_Mutation | c.26N>T | p.Ala9Val | p.A9V | P24310 | protein_coding | tolerated(0.61) | benign(0.006) | TCGA-VQ-A8PX-01 | Stomach | stomach adenocarcinoma | Male | <65 | I/II | Unknown | Unknown | SD |
| Page: 1 |
Top |
Related drugs of malignant transformation related genes |
| Identification of chemicals and drugs interact with genes involved in malignant transfromation |
| (DGIdb 4.0) |
| Entrez ID | Symbol | Category | Interaction Types | Drug Claim Name | Drug Name | PMIDs |
| Page: 1 |

Copyright 2023-Present -The University of Texas Health Science Center at Houston |