
|
|||||
|
 | |
| |
| |
| |
| |
| |
|
Gene: COX11 |
Gene summary for COX11 |
| Gene information | Species | Human | Gene symbol | COX11 | Gene ID | 1353 |
| Gene name | cytochrome c oxidase copper chaperone COX11 | |
| Gene Alias | COX11P | |
| Cytomap | 17q22 | |
| Gene Type | protein-coding | GO ID | GO:0005975 | UniProtAcc | B4DEY8 |
Top |
Malignant transformation analysis |
| Identification of the aberrant gene expression in precancerous and cancerous lesions by comparing the gene expression of stem-like cells in diseased tissues with normal stem cells |
| Entrez ID | Symbol | Replicates | Species | Organ | Tissue | Adj P-value | Log2FC | Malignancy |
| 1353 | COX11 | LZE4T | Human | Esophagus | ESCC | 3.08e-09 | 1.70e-01 | 0.0811 |
| 1353 | COX11 | LZE7T | Human | Esophagus | ESCC | 1.51e-02 | 3.47e-01 | 0.0667 |
| 1353 | COX11 | LZE8T | Human | Esophagus | ESCC | 3.49e-11 | 1.46e-01 | 0.067 |
| 1353 | COX11 | LZE24T | Human | Esophagus | ESCC | 1.27e-10 | 4.32e-01 | 0.0596 |
| 1353 | COX11 | P2T-E | Human | Esophagus | ESCC | 2.84e-20 | 5.22e-01 | 0.1177 |
| 1353 | COX11 | P4T-E | Human | Esophagus | ESCC | 1.12e-21 | 7.29e-01 | 0.1323 |
| 1353 | COX11 | P5T-E | Human | Esophagus | ESCC | 9.82e-03 | 6.47e-02 | 0.1327 |
| 1353 | COX11 | P8T-E | Human | Esophagus | ESCC | 3.11e-08 | 1.86e-01 | 0.0889 |
| 1353 | COX11 | P9T-E | Human | Esophagus | ESCC | 1.40e-10 | 2.15e-01 | 0.1131 |
| 1353 | COX11 | P10T-E | Human | Esophagus | ESCC | 1.39e-32 | 6.29e-01 | 0.116 |
| 1353 | COX11 | P11T-E | Human | Esophagus | ESCC | 2.02e-06 | 3.36e-01 | 0.1426 |
| 1353 | COX11 | P12T-E | Human | Esophagus | ESCC | 5.10e-24 | 5.57e-01 | 0.1122 |
| 1353 | COX11 | P15T-E | Human | Esophagus | ESCC | 7.44e-19 | 2.76e-01 | 0.1149 |
| 1353 | COX11 | P16T-E | Human | Esophagus | ESCC | 3.77e-22 | 4.76e-01 | 0.1153 |
| 1353 | COX11 | P19T-E | Human | Esophagus | ESCC | 1.22e-03 | 4.43e-01 | 0.1662 |
| 1353 | COX11 | P20T-E | Human | Esophagus | ESCC | 2.48e-11 | 3.59e-01 | 0.1124 |
| 1353 | COX11 | P21T-E | Human | Esophagus | ESCC | 3.00e-27 | 5.37e-01 | 0.1617 |
| 1353 | COX11 | P22T-E | Human | Esophagus | ESCC | 8.78e-24 | 6.09e-01 | 0.1236 |
| 1353 | COX11 | P23T-E | Human | Esophagus | ESCC | 1.30e-16 | 6.19e-01 | 0.108 |
| 1353 | COX11 | P24T-E | Human | Esophagus | ESCC | 1.19e-12 | 2.29e-01 | 0.1287 |
| Page: 1 2 3 4 5 |
| Tissue | Expression Dynamics | Abbreviation |
| Esophagus | 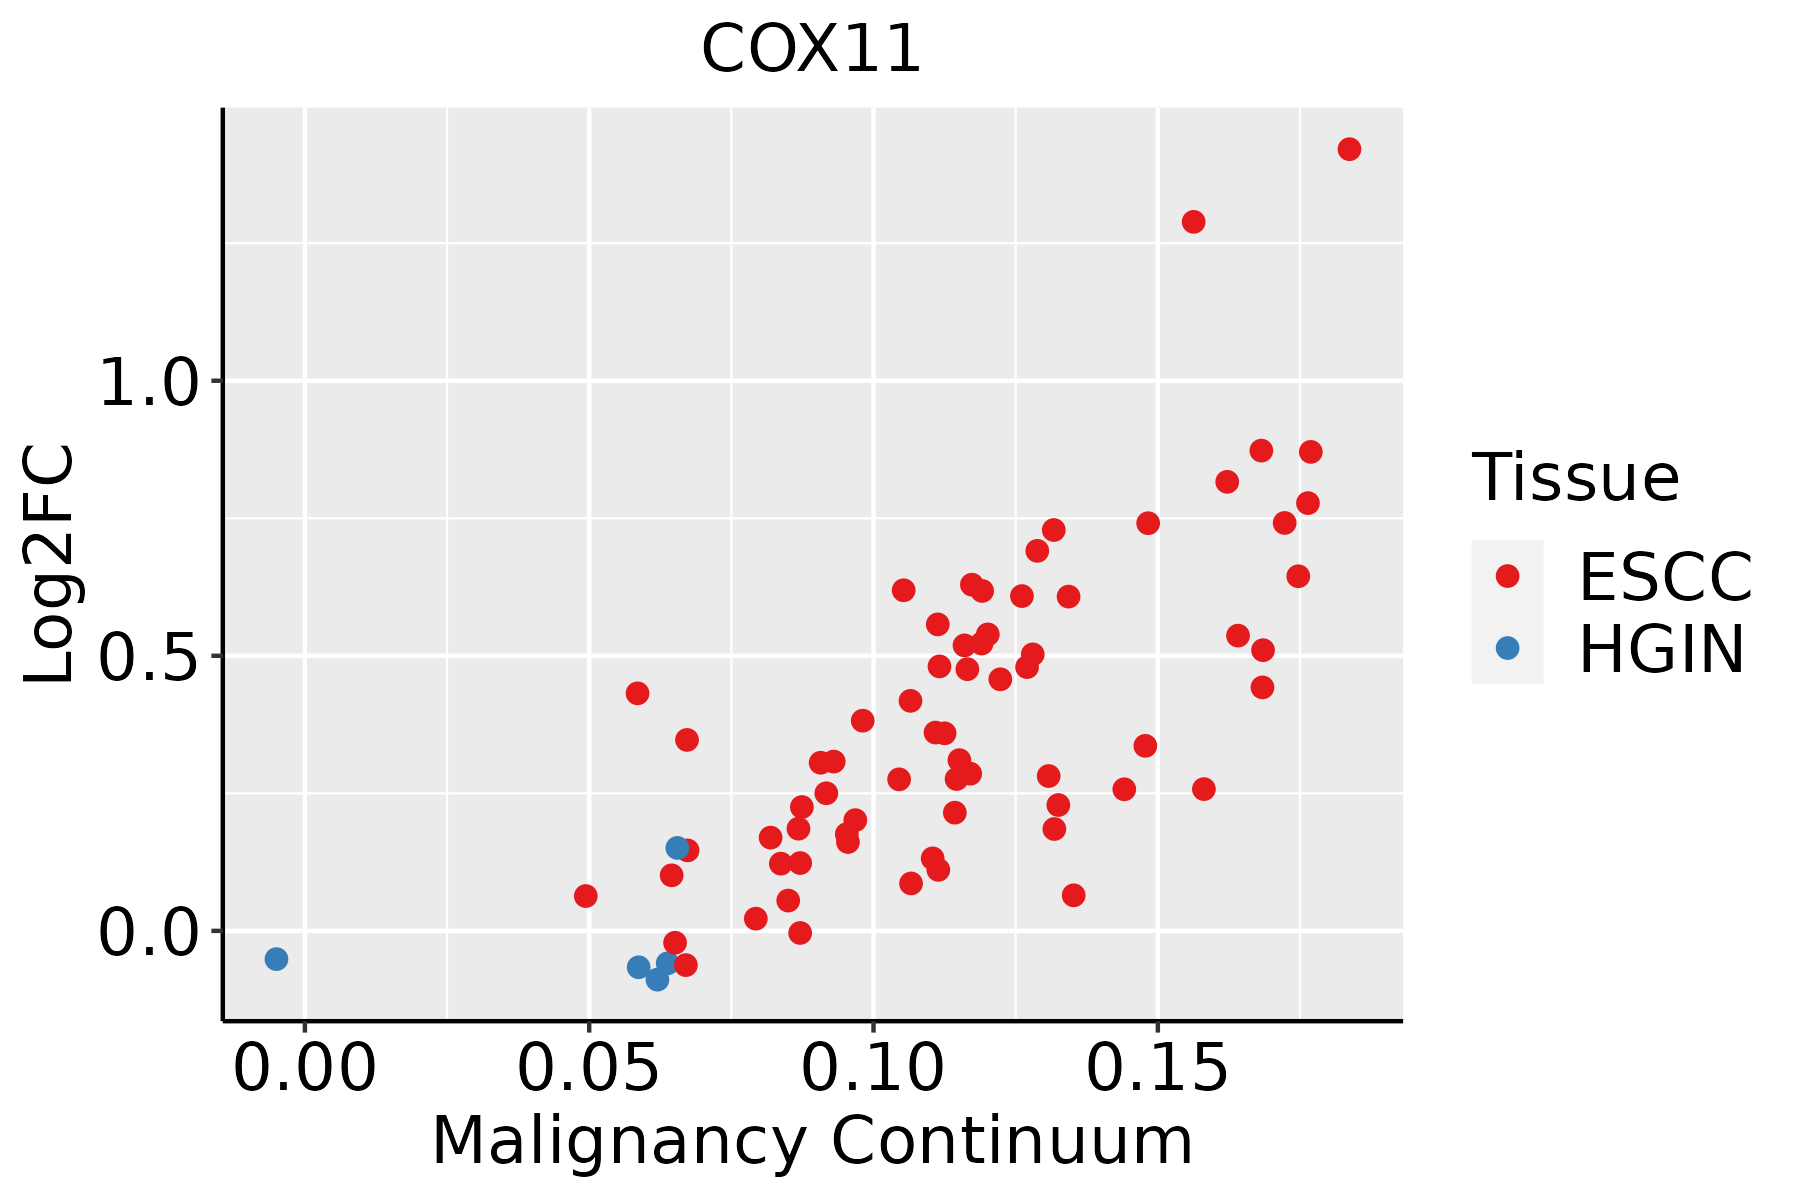 | ESCC: Esophageal squamous cell carcinoma |
| HGIN: High-grade intraepithelial neoplasias | ||
| LGIN: Low-grade intraepithelial neoplasias | ||
| Liver |  | HCC: Hepatocellular carcinoma |
| NAFLD: Non-alcoholic fatty liver disease | ||
| Oral Cavity |  | EOLP: Erosive Oral lichen planus |
| LP: leukoplakia | ||
| NEOLP: Non-erosive oral lichen planus | ||
| OSCC: Oral squamous cell carcinoma | ||
| Skin |  | AK: Actinic keratosis |
| cSCC: Cutaneous squamous cell carcinoma | ||
| SCCIS:squamous cell carcinoma in situ |
| ∗log2FC in expression of this searched gene in stem-like cells from each diseased tissue sample relative to stem-like cells in normal samples in each tissue plotted against the malignancy continuum. Samples are colored based on if they are from different disease stage. |
Top |
Malignant transformation related pathway analysis |
| Find out the enriched GO biological processes and KEGG pathways involved in transition from healthy to precancer to cancer |
| Tissue | Disease Stage | Enriched GO biological Processes |
| Colorectum | AD |  |
| Colorectum | SER |  |
| Colorectum | MSS |  |
| Colorectum | MSI-H |  |
| Colorectum | FAP |  |
| ∗Top 15 enriched GO BP terms are showed in the bar plot of each disease state in each tissue. Each row represents a significant GO biological process which is colored according to the -log10(p.adjust). |
| Page: 1 2 3 4 5 6 7 8 9 |
| GO ID | Tissue | Disease Stage | Description | Gene Ratio | Bg Ratio | pvalue | p.adjust | Count |
| GO:0006091110 | Esophagus | ESCC | generation of precursor metabolites and energy | 331/8552 | 490/18723 | 3.86e-23 | 8.45e-21 | 331 |
| GO:0022900110 | Esophagus | ESCC | electron transport chain | 133/8552 | 175/18723 | 2.18e-16 | 1.67e-14 | 133 |
| GO:0010563111 | Esophagus | ESCC | negative regulation of phosphorus metabolic process | 274/8552 | 442/18723 | 2.32e-12 | 9.41e-11 | 274 |
| GO:0045936111 | Esophagus | ESCC | negative regulation of phosphate metabolic process | 273/8552 | 441/18723 | 3.18e-12 | 1.25e-10 | 273 |
| GO:0051348111 | Esophagus | ESCC | negative regulation of transferase activity | 177/8552 | 268/18723 | 1.08e-11 | 4.00e-10 | 177 |
| GO:0042326111 | Esophagus | ESCC | negative regulation of phosphorylation | 237/8552 | 385/18723 | 1.86e-10 | 5.33e-09 | 237 |
| GO:003367319 | Esophagus | ESCC | negative regulation of kinase activity | 154/8552 | 237/18723 | 1.38e-09 | 3.27e-08 | 154 |
| GO:00059969 | Esophagus | ESCC | monosaccharide metabolic process | 159/8552 | 257/18723 | 1.11e-07 | 1.81e-06 | 159 |
| GO:00193189 | Esophagus | ESCC | hexose metabolic process | 147/8552 | 237/18723 | 2.63e-07 | 3.94e-06 | 147 |
| GO:00060069 | Esophagus | ESCC | glucose metabolic process | 119/8552 | 196/18723 | 1.51e-05 | 1.36e-04 | 119 |
| GO:00442626 | Esophagus | ESCC | cellular carbohydrate metabolic process | 160/8552 | 283/18723 | 1.43e-04 | 9.66e-04 | 160 |
| GO:00620129 | Esophagus | ESCC | regulation of small molecule metabolic process | 184/8552 | 334/18723 | 3.11e-04 | 1.85e-03 | 184 |
| GO:00109065 | Esophagus | ESCC | regulation of glucose metabolic process | 71/8552 | 119/18723 | 1.46e-03 | 6.92e-03 | 71 |
| GO:00061096 | Esophagus | ESCC | regulation of carbohydrate metabolic process | 101/8552 | 178/18723 | 1.89e-03 | 8.52e-03 | 101 |
| GO:00106755 | Esophagus | ESCC | regulation of cellular carbohydrate metabolic process | 83/8552 | 146/18723 | 4.24e-03 | 1.69e-02 | 83 |
| GO:000609112 | Liver | Cirrhotic | generation of precursor metabolites and energy | 238/4634 | 490/18723 | 6.85e-31 | 1.07e-27 | 238 |
| GO:002290012 | Liver | Cirrhotic | electron transport chain | 111/4634 | 175/18723 | 1.94e-27 | 1.52e-24 | 111 |
| GO:000599612 | Liver | Cirrhotic | monosaccharide metabolic process | 104/4634 | 257/18723 | 1.74e-08 | 6.32e-07 | 104 |
| GO:001931812 | Liver | Cirrhotic | hexose metabolic process | 97/4634 | 237/18723 | 2.67e-08 | 9.16e-07 | 97 |
| GO:000600611 | Liver | Cirrhotic | glucose metabolic process | 82/4634 | 196/18723 | 1.01e-07 | 2.93e-06 | 82 |
| Page: 1 2 3 4 5 |
| Pathway ID | Tissue | Disease Stage | Description | Gene Ratio | Bg Ratio | pvalue | p.adjust | qvalue | Count |
| hsa00190210 | Esophagus | ESCC | Oxidative phosphorylation | 104/4205 | 134/8465 | 2.04e-11 | 2.98e-10 | 1.53e-10 | 104 |
| hsa04714211 | Esophagus | ESCC | Thermogenesis | 163/4205 | 232/8465 | 9.22e-11 | 1.14e-09 | 5.86e-10 | 163 |
| hsa0019038 | Esophagus | ESCC | Oxidative phosphorylation | 104/4205 | 134/8465 | 2.04e-11 | 2.98e-10 | 1.53e-10 | 104 |
| hsa04714310 | Esophagus | ESCC | Thermogenesis | 163/4205 | 232/8465 | 9.22e-11 | 1.14e-09 | 5.86e-10 | 163 |
| hsa0471414 | Liver | Cirrhotic | Thermogenesis | 121/2530 | 232/8465 | 5.70e-13 | 1.36e-11 | 8.36e-12 | 121 |
| hsa0471415 | Liver | Cirrhotic | Thermogenesis | 121/2530 | 232/8465 | 5.70e-13 | 1.36e-11 | 8.36e-12 | 121 |
| hsa0471422 | Liver | HCC | Thermogenesis | 170/4020 | 232/8465 | 5.36e-16 | 2.25e-14 | 1.25e-14 | 170 |
| hsa0019022 | Liver | HCC | Oxidative phosphorylation | 103/4020 | 134/8465 | 2.39e-12 | 5.01e-11 | 2.79e-11 | 103 |
| hsa0471432 | Liver | HCC | Thermogenesis | 170/4020 | 232/8465 | 5.36e-16 | 2.25e-14 | 1.25e-14 | 170 |
| hsa0019032 | Liver | HCC | Oxidative phosphorylation | 103/4020 | 134/8465 | 2.39e-12 | 5.01e-11 | 2.79e-11 | 103 |
| hsa0019028 | Oral cavity | OSCC | Oxidative phosphorylation | 88/3704 | 134/8465 | 2.15e-07 | 1.44e-06 | 7.32e-07 | 88 |
| hsa0471430 | Oral cavity | OSCC | Thermogenesis | 138/3704 | 232/8465 | 7.67e-07 | 4.35e-06 | 2.22e-06 | 138 |
| hsa00190112 | Oral cavity | OSCC | Oxidative phosphorylation | 88/3704 | 134/8465 | 2.15e-07 | 1.44e-06 | 7.32e-07 | 88 |
| hsa04714113 | Oral cavity | OSCC | Thermogenesis | 138/3704 | 232/8465 | 7.67e-07 | 4.35e-06 | 2.22e-06 | 138 |
| hsa0019029 | Oral cavity | LP | Oxidative phosphorylation | 81/2418 | 134/8465 | 9.58e-15 | 2.45e-13 | 1.58e-13 | 81 |
| hsa04714210 | Oral cavity | LP | Thermogenesis | 105/2418 | 232/8465 | 3.14e-08 | 4.98e-07 | 3.21e-07 | 105 |
| hsa0019037 | Oral cavity | LP | Oxidative phosphorylation | 81/2418 | 134/8465 | 9.58e-15 | 2.45e-13 | 1.58e-13 | 81 |
| hsa0471438 | Oral cavity | LP | Thermogenesis | 105/2418 | 232/8465 | 3.14e-08 | 4.98e-07 | 3.21e-07 | 105 |
| Page: 1 |
Top |
Cell-cell communication analysis |
| Identification of potential cell-cell interactions between two cell types and their ligand-receptor pairs for different disease states |
| Ligand | Receptor | LRpair | Pathway | Tissue | Disease Stage |
| Page: 1 |
Top |
Single-cell gene regulatory network inference analysis |
| Find out the significant the regulons (TFs) and the target genes of each regulon across cell types for different disease states |
| TF | Cell Type | Tissue | Disease Stage | Target Gene | RSS | Regulon Activity |
| ∗The dot plots of a searched regulon are shown for all cell subpopulations in each disease state of each tissue based on the regulon specific score inferred using pySCENIC and by calculating the average expression. |
| Page: 1 |
Top |
Somatic mutation of malignant transformation related genes |
| Annotation of somatic variants for genes involved in malignant transformation |
| Hugo Symbol | Variant Class | Variant Classification | dbSNP RS | HGVSc | HGVSp | HGVSp Short | SWISSPROT | BIOTYPE | SIFT | PolyPhen | Tumor Sample Barcode | Tissue | Histology | Sex | Age | Stage | Therapy Types | Drugs | Outcome |
| COX11 | SNV | Missense_Mutation | novel | c.307G>T | p.Ala103Ser | p.A103S | Q9Y6N1 | protein_coding | tolerated(0.1) | benign(0.119) | TCGA-VS-A9UL-01 | Cervix | cervical & endocervical cancer | Female | >=65 | III/IV | Unknown | Unknown | PD |
| COX11 | SNV | Missense_Mutation | c.548N>T | p.Ala183Val | p.A183V | Q9Y6N1 | protein_coding | deleterious(0.01) | probably_damaging(0.954) | TCGA-AA-3811-01 | Colorectum | colon adenocarcinoma | Female | >=65 | III/IV | Unknown | Unknown | PD | |
| COX11 | SNV | Missense_Mutation | novel | c.252N>T | p.Gln84His | p.Q84H | Q9Y6N1 | protein_coding | tolerated(0.16) | benign(0) | TCGA-F5-6814-01 | Colorectum | rectum adenocarcinoma | Male | <65 | I/II | Unknown | Unknown | SD |
| COX11 | insertion | Frame_Shift_Ins | novel | c.547_548insAAGAAATT | p.Ala183GlufsTer16 | p.A183Efs*16 | Q9Y6N1 | protein_coding | TCGA-AM-5820-01 | Colorectum | colon adenocarcinoma | Female | <65 | I/II | Unknown | Unknown | SD | ||
| COX11 | SNV | Missense_Mutation | novel | c.374N>A | p.Gly125Glu | p.G125E | Q9Y6N1 | protein_coding | deleterious(0) | probably_damaging(0.997) | TCGA-A5-A1OF-01 | Endometrium | uterine corpus endometrioid carcinoma | Female | <65 | I/II | Unknown | Unknown | SD |
| COX11 | SNV | Missense_Mutation | novel | c.104N>G | p.Phe35Cys | p.F35C | Q9Y6N1 | protein_coding | tolerated_low_confidence(0.26) | benign(0) | TCGA-A5-A2K5-01 | Endometrium | uterine corpus endometrioid carcinoma | Female | >=65 | I/II | Unknown | Unknown | SD |
| COX11 | SNV | Missense_Mutation | novel | c.421N>C | p.Asn141His | p.N141H | Q9Y6N1 | protein_coding | tolerated(0.11) | benign(0.088) | TCGA-AJ-A3EL-01 | Endometrium | uterine corpus endometrioid carcinoma | Female | <65 | I/II | Unknown | Unknown | SD |
| COX11 | SNV | Missense_Mutation | novel | c.802N>T | p.His268Tyr | p.H268Y | Q9Y6N1 | protein_coding | tolerated(1) | benign(0) | TCGA-AP-A1DK-01 | Endometrium | uterine corpus endometrioid carcinoma | Female | <65 | I/II | Unknown | Unknown | SD |
| COX11 | SNV | Missense_Mutation | novel | c.467N>T | p.Ala156Val | p.A156V | Q9Y6N1 | protein_coding | deleterious(0) | probably_damaging(0.992) | TCGA-AX-A1CE-01 | Endometrium | uterine corpus endometrioid carcinoma | Female | <65 | I/II | Unspecific | Paclitaxel | SD |
| COX11 | SNV | Missense_Mutation | novel | c.743G>T | p.Arg248Ile | p.R248I | Q9Y6N1 | protein_coding | deleterious(0.03) | benign(0.405) | TCGA-B5-A1MX-01 | Endometrium | uterine corpus endometrioid carcinoma | Female | <65 | I/II | Hormone Therapy | megace | SD |
| Page: 1 2 3 |
Top |
Related drugs of malignant transformation related genes |
| Identification of chemicals and drugs interact with genes involved in malignant transfromation |
| (DGIdb 4.0) |
| Entrez ID | Symbol | Category | Interaction Types | Drug Claim Name | Drug Name | PMIDs |
| Page: 1 |

Copyright 2023-Present -The University of Texas Health Science Center at Houston |