
|
|||||
|
 | |
| |
| |
| |
| |
| |
|
Gene: CORO6 |
Gene summary for CORO6 |
| Gene information | Species | Human | Gene symbol | CORO6 | Gene ID | 84940 |
| Gene name | coronin 6 | |
| Gene Alias | CORO6 | |
| Cytomap | 17q11.2 | |
| Gene Type | protein-coding | GO ID | GO:0006928 | UniProtAcc | B3KRY9 |
Top |
Malignant transformation analysis |
| Identification of the aberrant gene expression in precancerous and cancerous lesions by comparing the gene expression of stem-like cells in diseased tissues with normal stem cells |
| Entrez ID | Symbol | Replicates | Species | Organ | Tissue | Adj P-value | Log2FC | Malignancy |
| 84940 | CORO6 | C04 | Human | Oral cavity | OSCC | 4.81e-05 | 2.81e-01 | 0.2633 |
| 84940 | CORO6 | C21 | Human | Oral cavity | OSCC | 9.79e-15 | 5.79e-01 | 0.2678 |
| 84940 | CORO6 | C30 | Human | Oral cavity | OSCC | 1.19e-03 | 3.08e-01 | 0.3055 |
| 84940 | CORO6 | C51 | Human | Oral cavity | OSCC | 2.06e-19 | 7.31e-01 | 0.2674 |
| 84940 | CORO6 | SYSMH1 | Human | Oral cavity | OSCC | 1.97e-04 | 7.65e-02 | 0.1127 |
| 84940 | CORO6 | SYSMH3 | Human | Oral cavity | OSCC | 1.40e-03 | 2.07e-01 | 0.2442 |
| 84940 | CORO6 | SYSMH5 | Human | Oral cavity | OSCC | 3.17e-03 | 3.10e-01 | 0.0647 |
| 84940 | CORO6 | male-WTA | Human | Thyroid | PTC | 1.00e-50 | 7.19e-01 | 0.1037 |
| 84940 | CORO6 | PTC03 | Human | Thyroid | PTC | 7.07e-04 | 2.18e-01 | 0.1784 |
| 84940 | CORO6 | PTC04 | Human | Thyroid | PTC | 5.27e-18 | 4.23e-01 | 0.1927 |
| 84940 | CORO6 | PTC05 | Human | Thyroid | PTC | 7.52e-10 | 4.75e-01 | 0.2065 |
| 84940 | CORO6 | PTC07 | Human | Thyroid | PTC | 2.66e-20 | 5.31e-01 | 0.2044 |
| Page: 1 |
| Tissue | Expression Dynamics | Abbreviation |
| Oral Cavity | 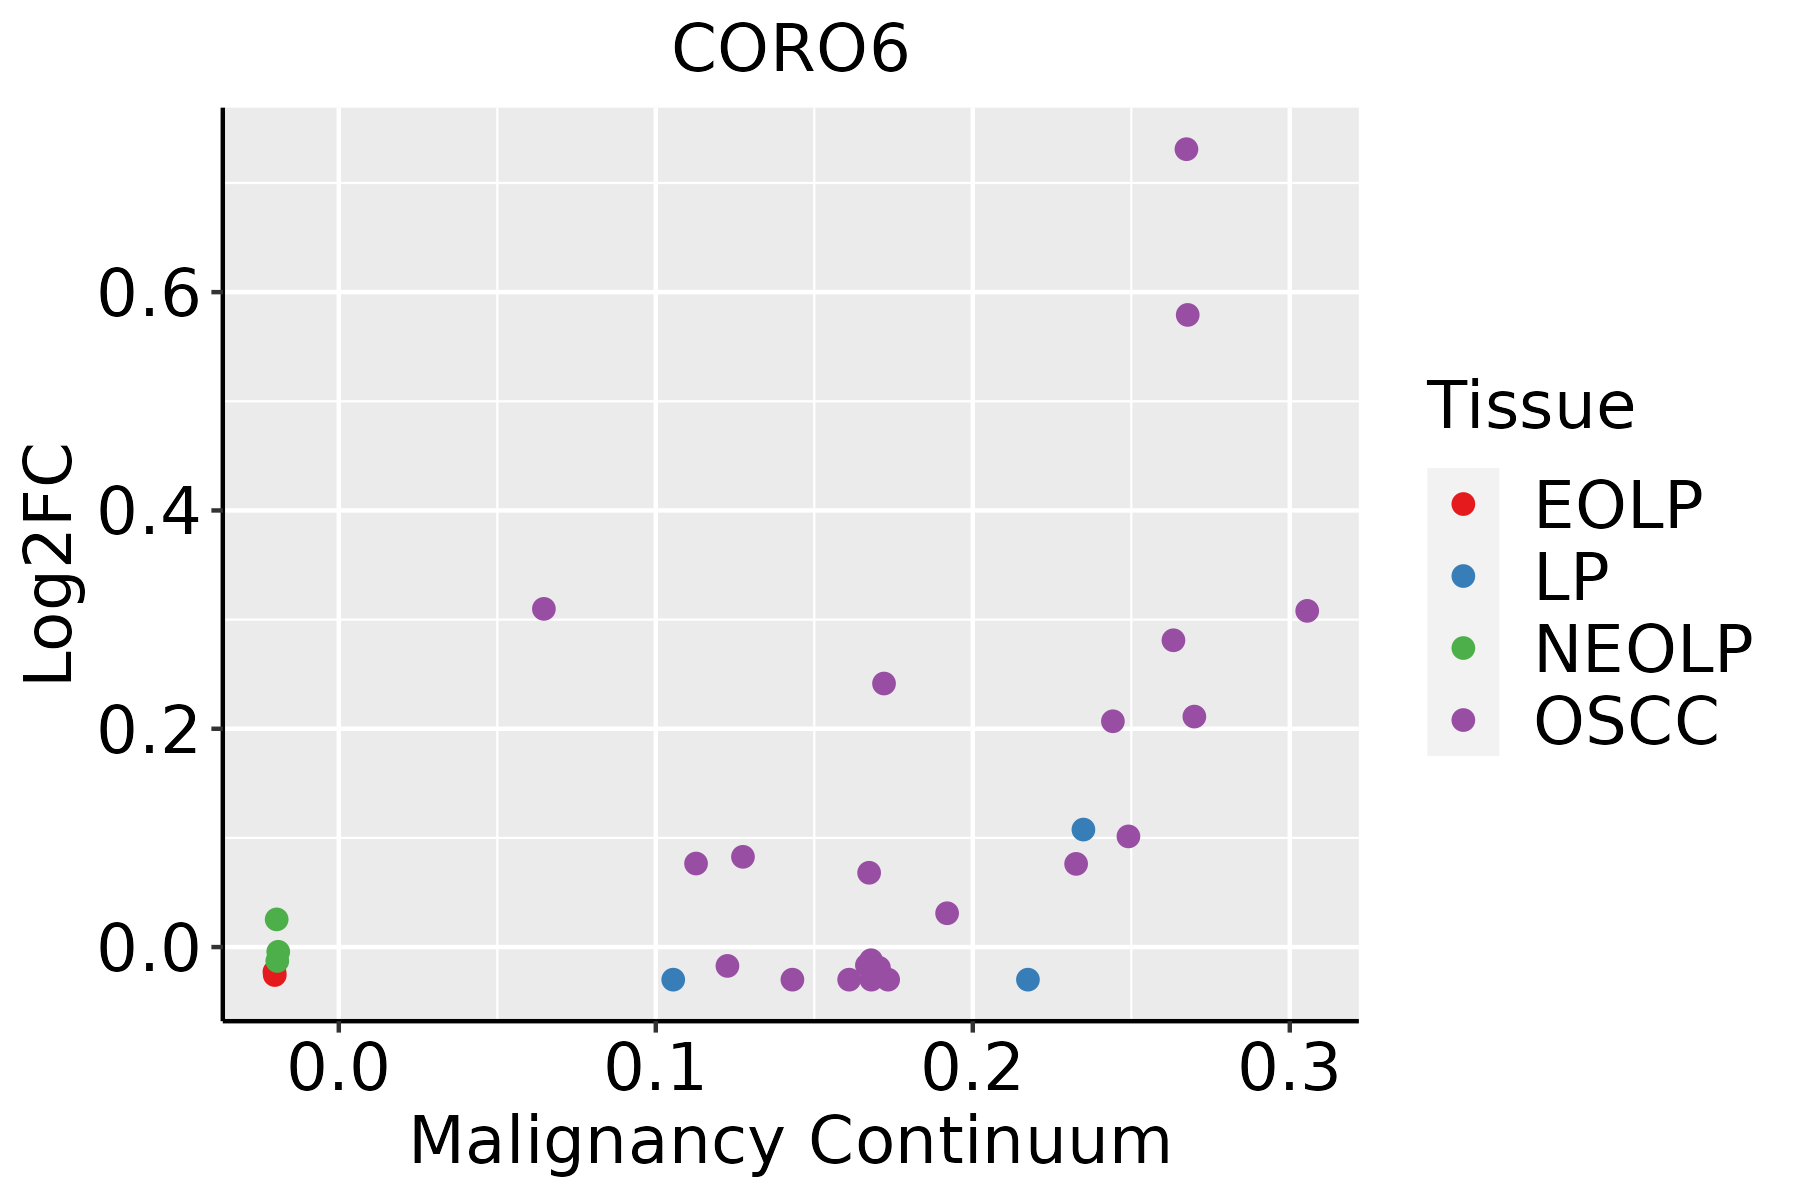 | EOLP: Erosive Oral lichen planus |
| LP: leukoplakia | ||
| NEOLP: Non-erosive oral lichen planus | ||
| OSCC: Oral squamous cell carcinoma | ||
| Thyroid | 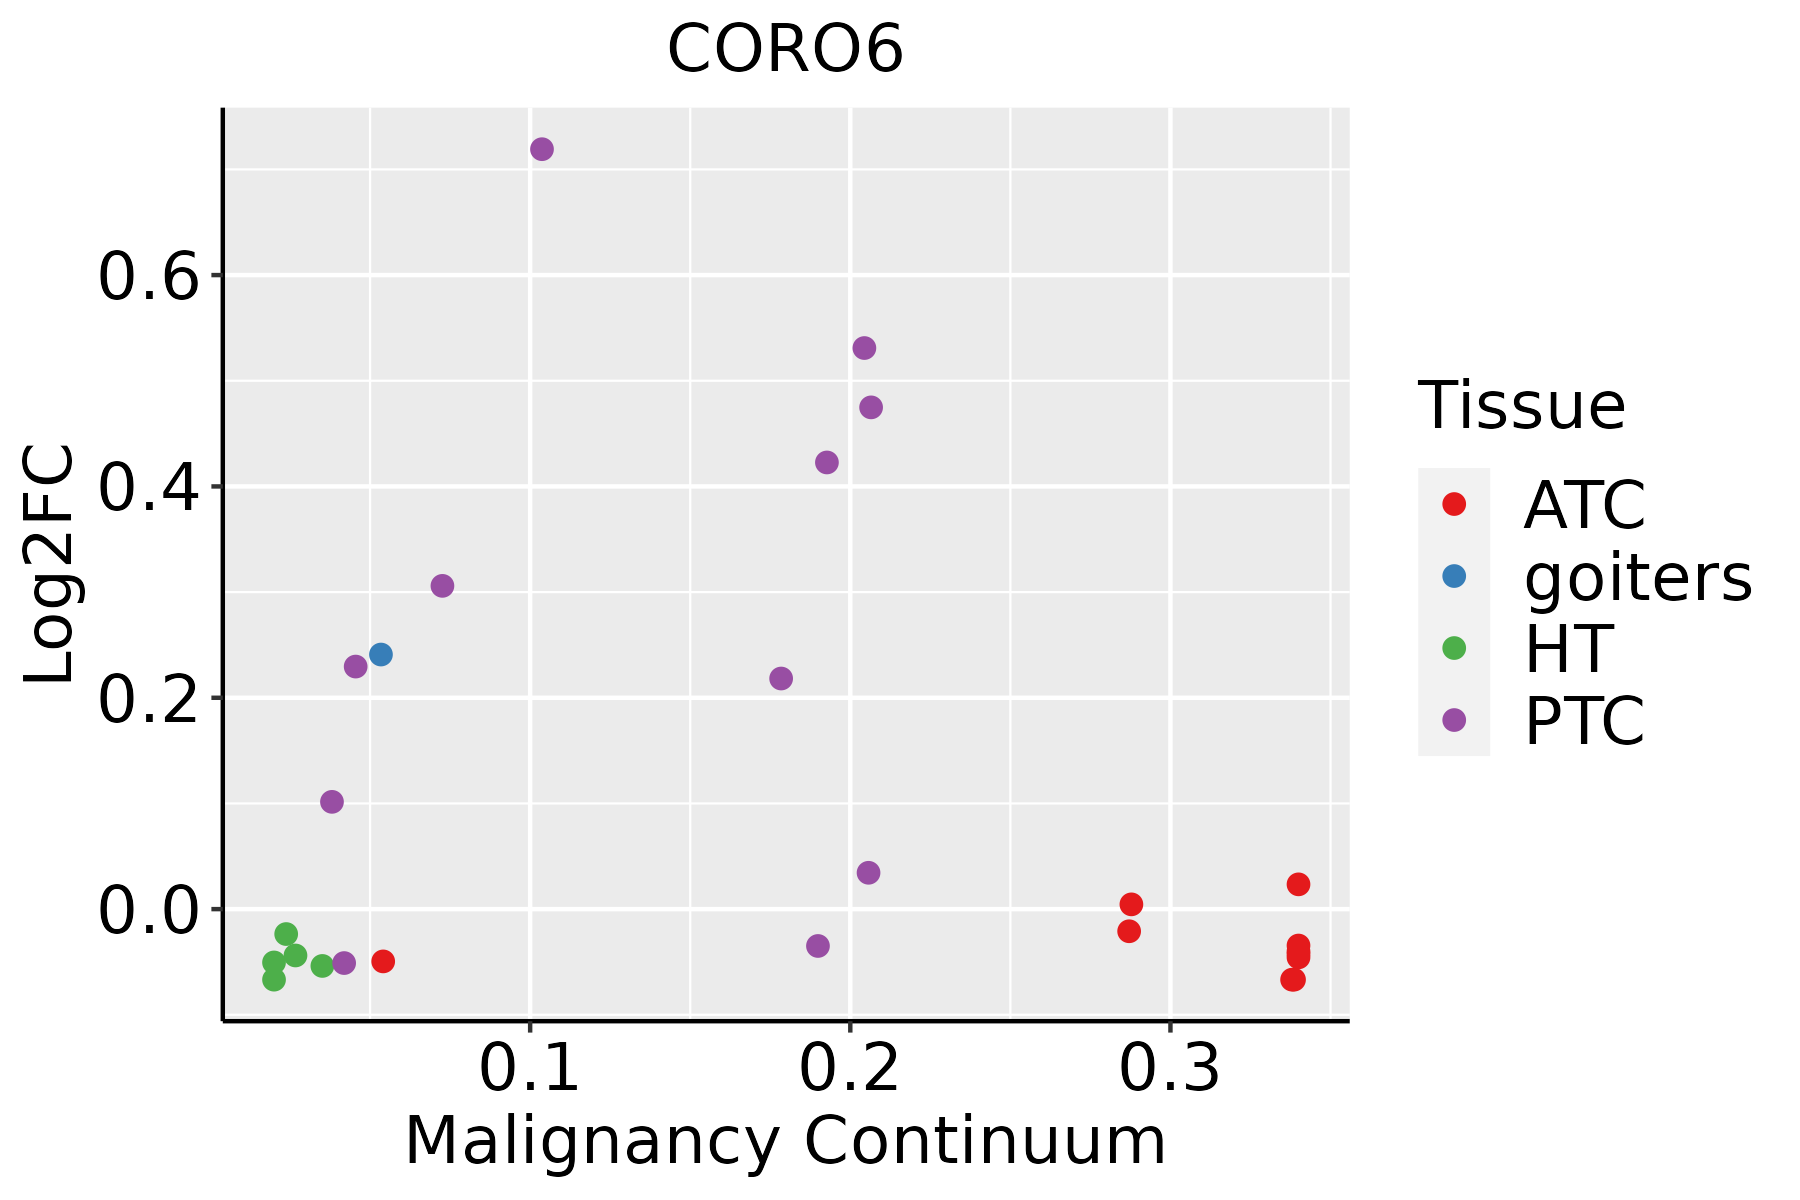 | ATC: Anaplastic thyroid cancer |
| HT: Hashimoto's thyroiditis | ||
| PTC: Papillary thyroid cancer |
| ∗log2FC in expression of this searched gene in stem-like cells from each diseased tissue sample relative to stem-like cells in normal samples in each tissue plotted against the malignancy continuum. Samples are colored based on if they are from different disease stage. |
Top |
Malignant transformation related pathway analysis |
| Find out the enriched GO biological processes and KEGG pathways involved in transition from healthy to precancer to cancer |
| Tissue | Disease Stage | Enriched GO biological Processes |
| Colorectum | AD |  |
| Colorectum | SER |  |
| Colorectum | MSS |  |
| Colorectum | MSI-H |  |
| Colorectum | FAP |  |
| ∗Top 15 enriched GO BP terms are showed in the bar plot of each disease state in each tissue. Each row represents a significant GO biological process which is colored according to the -log10(p.adjust). |
| Page: 1 2 3 4 5 6 7 8 9 |
| GO ID | Tissue | Disease Stage | Description | Gene Ratio | Bg Ratio | pvalue | p.adjust | Count |
| GO:000701520 | Oral cavity | OSCC | actin filament organization | 230/7305 | 442/18723 | 1.37e-08 | 2.77e-07 | 230 |
| GO:0007015112 | Thyroid | PTC | actin filament organization | 225/5968 | 442/18723 | 3.76e-17 | 3.44e-15 | 225 |
| Page: 1 |
| Pathway ID | Tissue | Disease Stage | Description | Gene Ratio | Bg Ratio | pvalue | p.adjust | qvalue | Count |
| Page: 1 |
Top |
Cell-cell communication analysis |
| Identification of potential cell-cell interactions between two cell types and their ligand-receptor pairs for different disease states |
| Ligand | Receptor | LRpair | Pathway | Tissue | Disease Stage |
| Page: 1 |
Top |
Single-cell gene regulatory network inference analysis |
| Find out the significant the regulons (TFs) and the target genes of each regulon across cell types for different disease states |
| TF | Cell Type | Tissue | Disease Stage | Target Gene | RSS | Regulon Activity |
| ∗The dot plots of a searched regulon are shown for all cell subpopulations in each disease state of each tissue based on the regulon specific score inferred using pySCENIC and by calculating the average expression. |
| Page: 1 |
Top |
Somatic mutation of malignant transformation related genes |
| Annotation of somatic variants for genes involved in malignant transformation |
| Hugo Symbol | Variant Class | Variant Classification | dbSNP RS | HGVSc | HGVSp | HGVSp Short | SWISSPROT | BIOTYPE | SIFT | PolyPhen | Tumor Sample Barcode | Tissue | Histology | Sex | Age | Stage | Therapy Types | Drugs | Outcome |
| CORO6 | SNV | Missense_Mutation | c.182N>G | p.Val61Gly | p.V61G | Q6QEF8 | protein_coding | deleterious(0) | probably_damaging(1) | TCGA-A8-A06P-01 | Breast | breast invasive carcinoma | Female | <65 | III/IV | Unspecific | SD | ||
| CORO6 | SNV | Missense_Mutation | c.946C>T | p.Arg316Trp | p.R316W | Q6QEF8 | protein_coding | deleterious(0) | possibly_damaging(0.807) | TCGA-EW-A6SA-01 | Breast | breast invasive carcinoma | Male | <65 | I/II | Unknown | Unknown | SD | |
| CORO6 | insertion | Nonsense_Mutation | novel | c.180_181insTAATTATAGCCAT | p.Val61Ter | p.V61* | Q6QEF8 | protein_coding | TCGA-A8-A06P-01 | Breast | breast invasive carcinoma | Female | <65 | III/IV | Unspecific | SD | |||
| CORO6 | deletion | Frame_Shift_Del | c.157delG | p.Ala53LeufsTer103 | p.A53Lfs*103 | Q6QEF8 | protein_coding | TCGA-C8-A26W-01 | Breast | breast invasive carcinoma | Female | <65 | I/II | Chemotherapy | doxorubicin | CR | |||
| CORO6 | deletion | Frame_Shift_Del | novel | c.472delA | p.Ile158SerfsTer11 | p.I158Sfs*11 | Q6QEF8 | protein_coding | TCGA-EW-A2FV-01 | Breast | breast invasive carcinoma | Female | <65 | III/IV | Chemotherapy | docetaxel | SD | ||
| CORO6 | SNV | Missense_Mutation | novel | c.111N>A | p.Ser37Arg | p.S37R | Q6QEF8 | protein_coding | deleterious(0.01) | probably_damaging(0.955) | TCGA-2W-A8YY-01 | Cervix | cervical & endocervical cancer | Female | <65 | I/II | Chemotherapy | cisplatin | CR |
| CORO6 | SNV | Missense_Mutation | c.1025N>C | p.Arg342Thr | p.R342T | Q6QEF8 | protein_coding | tolerated(0.19) | benign(0.427) | TCGA-DR-A0ZM-01 | Cervix | cervical & endocervical cancer | Female | <65 | III/IV | Unspecific | Cisplatin | SD | |
| CORO6 | SNV | Missense_Mutation | rs763588603 | c.362N>T | p.Thr121Met | p.T121M | Q6QEF8 | protein_coding | deleterious(0.01) | possibly_damaging(0.888) | TCGA-EA-A3HU-01 | Cervix | cervical & endocervical cancer | Female | <65 | I/II | Unknown | Unknown | SD |
| CORO6 | SNV | Missense_Mutation | c.1025N>T | p.Arg342Ile | p.R342I | Q6QEF8 | protein_coding | deleterious(0.03) | possibly_damaging(0.825) | TCGA-AZ-4315-01 | Colorectum | colon adenocarcinoma | Male | <65 | I/II | Unknown | Unknown | SD | |
| CORO6 | SNV | Missense_Mutation | novel | c.397N>T | p.Arg133Cys | p.R133C | Q6QEF8 | protein_coding | deleterious(0) | probably_damaging(0.998) | TCGA-CA-6717-01 | Colorectum | colon adenocarcinoma | Male | <65 | I/II | Chemotherapy | oxaliplatin | CR |
| Page: 1 2 3 4 5 |
Top |
Related drugs of malignant transformation related genes |
| Identification of chemicals and drugs interact with genes involved in malignant transfromation |
| (DGIdb 4.0) |
| Entrez ID | Symbol | Category | Interaction Types | Drug Claim Name | Drug Name | PMIDs |
| Page: 1 |

Copyright 2023-Present -The University of Texas Health Science Center at Houston |