
|
|||||
|
 | |
| |
| |
| |
| |
| |
|
Gene: COQ9 |
Gene summary for COQ9 |
| Gene information | Species | Human | Gene symbol | COQ9 | Gene ID | 57017 |
| Gene name | coenzyme Q9 | |
| Gene Alias | C16orf49 | |
| Cytomap | 16q21 | |
| Gene Type | protein-coding | GO ID | GO:0006091 | UniProtAcc | A0A024R6U3 |
Top |
Malignant transformation analysis |
| Identification of the aberrant gene expression in precancerous and cancerous lesions by comparing the gene expression of stem-like cells in diseased tissues with normal stem cells |
| Entrez ID | Symbol | Replicates | Species | Organ | Tissue | Adj P-value | Log2FC | Malignancy |
| 57017 | COQ9 | LZE2T | Human | Esophagus | ESCC | 6.21e-04 | 5.78e-01 | 0.082 |
| 57017 | COQ9 | LZE4T | Human | Esophagus | ESCC | 6.01e-13 | 4.61e-01 | 0.0811 |
| 57017 | COQ9 | LZE5T | Human | Esophagus | ESCC | 1.66e-04 | 2.51e-01 | 0.0514 |
| 57017 | COQ9 | LZE7T | Human | Esophagus | ESCC | 3.25e-08 | 3.86e-01 | 0.0667 |
| 57017 | COQ9 | LZE8T | Human | Esophagus | ESCC | 1.03e-14 | 5.30e-01 | 0.067 |
| 57017 | COQ9 | LZE20T | Human | Esophagus | ESCC | 3.29e-11 | 3.32e-01 | 0.0662 |
| 57017 | COQ9 | LZE22D1 | Human | Esophagus | HGIN | 2.95e-05 | 2.80e-01 | 0.0595 |
| 57017 | COQ9 | LZE22T | Human | Esophagus | ESCC | 2.17e-07 | 3.60e-01 | 0.068 |
| 57017 | COQ9 | LZE24T | Human | Esophagus | ESCC | 2.33e-23 | 5.42e-01 | 0.0596 |
| 57017 | COQ9 | LZE21T | Human | Esophagus | ESCC | 1.46e-04 | 3.99e-01 | 0.0655 |
| 57017 | COQ9 | P1T-E | Human | Esophagus | ESCC | 7.23e-21 | 7.34e-01 | 0.0875 |
| 57017 | COQ9 | P2T-E | Human | Esophagus | ESCC | 2.67e-20 | 3.58e-01 | 0.1177 |
| 57017 | COQ9 | P4T-E | Human | Esophagus | ESCC | 2.62e-39 | 8.24e-01 | 0.1323 |
| 57017 | COQ9 | P5T-E | Human | Esophagus | ESCC | 2.37e-18 | 3.87e-01 | 0.1327 |
| 57017 | COQ9 | P8T-E | Human | Esophagus | ESCC | 8.72e-22 | 4.44e-01 | 0.0889 |
| 57017 | COQ9 | P9T-E | Human | Esophagus | ESCC | 9.07e-13 | 3.38e-01 | 0.1131 |
| 57017 | COQ9 | P10T-E | Human | Esophagus | ESCC | 1.18e-11 | 2.79e-01 | 0.116 |
| 57017 | COQ9 | P11T-E | Human | Esophagus | ESCC | 1.97e-21 | 7.18e-01 | 0.1426 |
| 57017 | COQ9 | P12T-E | Human | Esophagus | ESCC | 1.55e-23 | 4.80e-01 | 0.1122 |
| 57017 | COQ9 | P15T-E | Human | Esophagus | ESCC | 1.95e-31 | 5.96e-01 | 0.1149 |
| Page: 1 2 3 4 5 6 |
| Tissue | Expression Dynamics | Abbreviation |
| Esophagus |  | ESCC: Esophageal squamous cell carcinoma |
| HGIN: High-grade intraepithelial neoplasias | ||
| LGIN: Low-grade intraepithelial neoplasias | ||
| Liver | 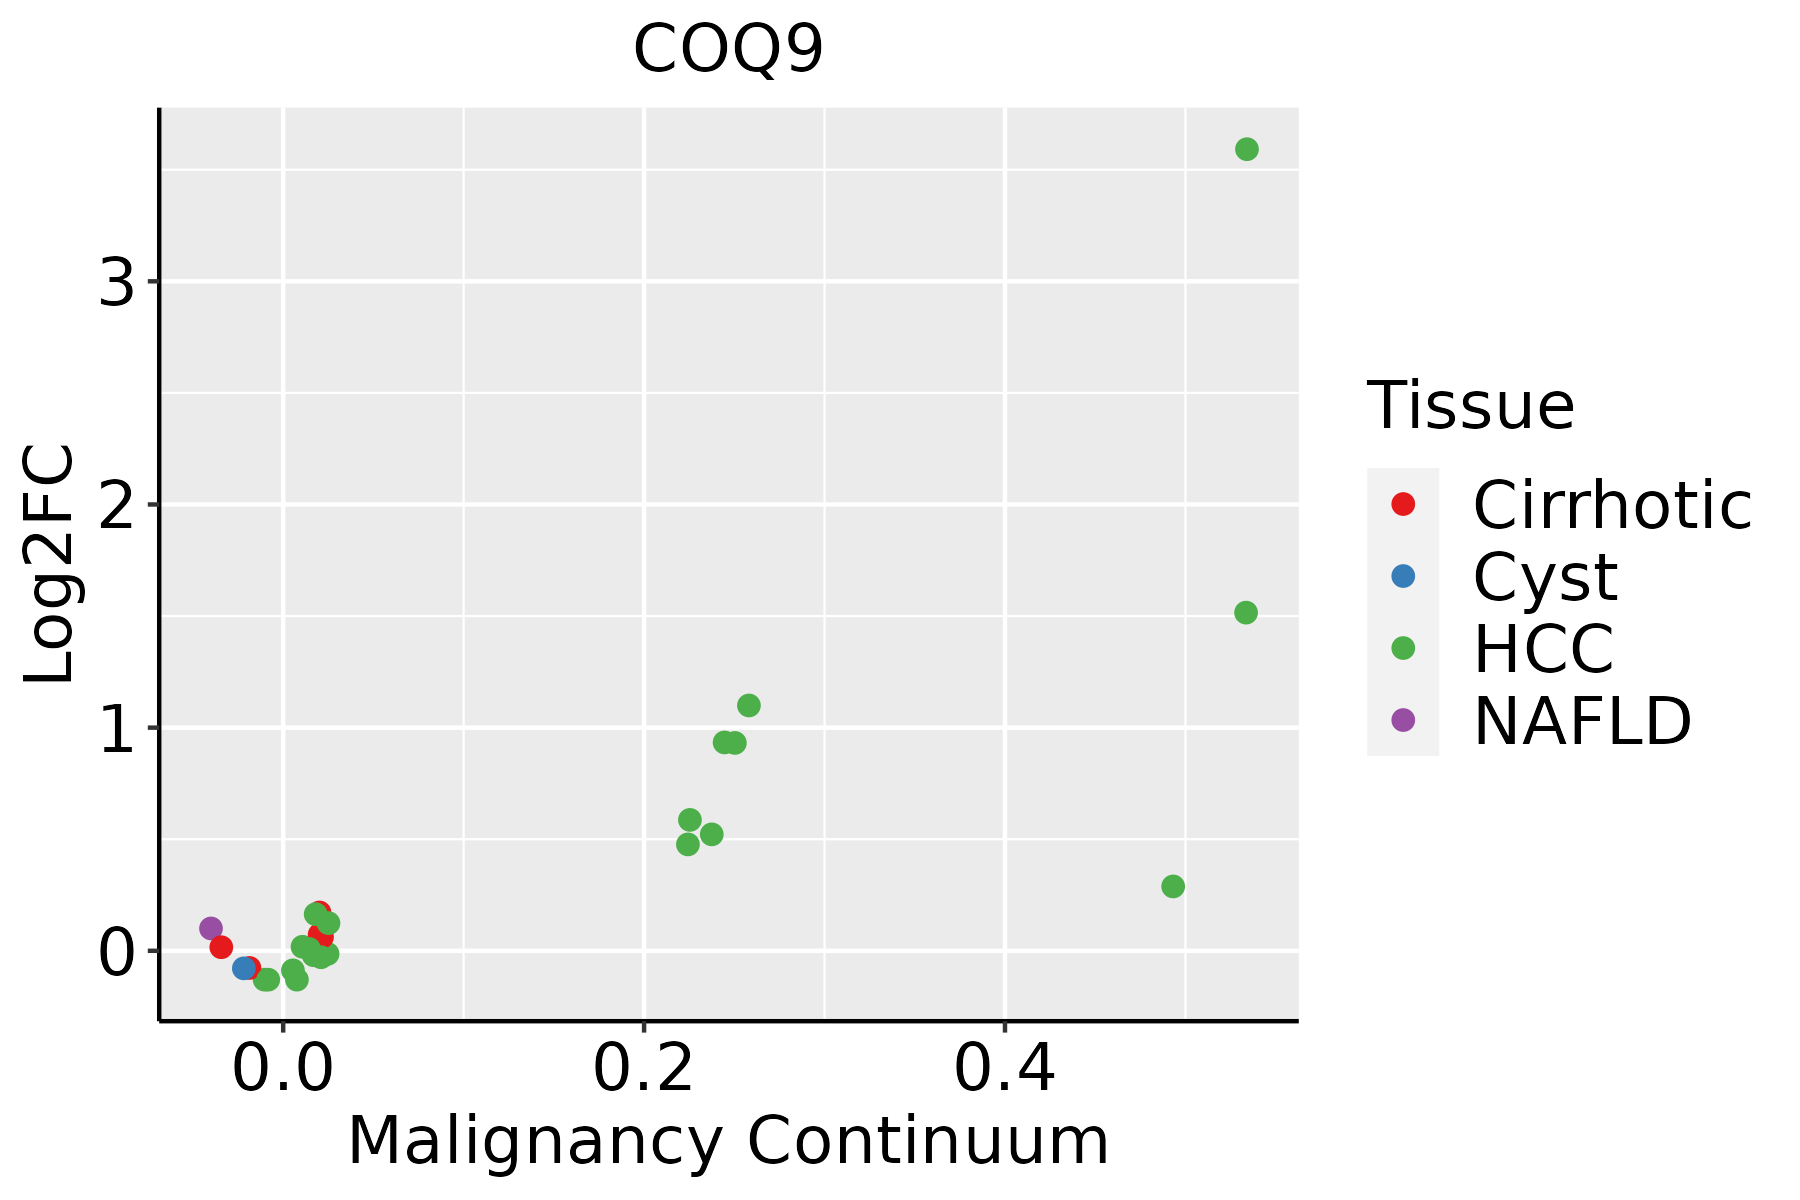 | HCC: Hepatocellular carcinoma |
| NAFLD: Non-alcoholic fatty liver disease | ||
| Oral Cavity | 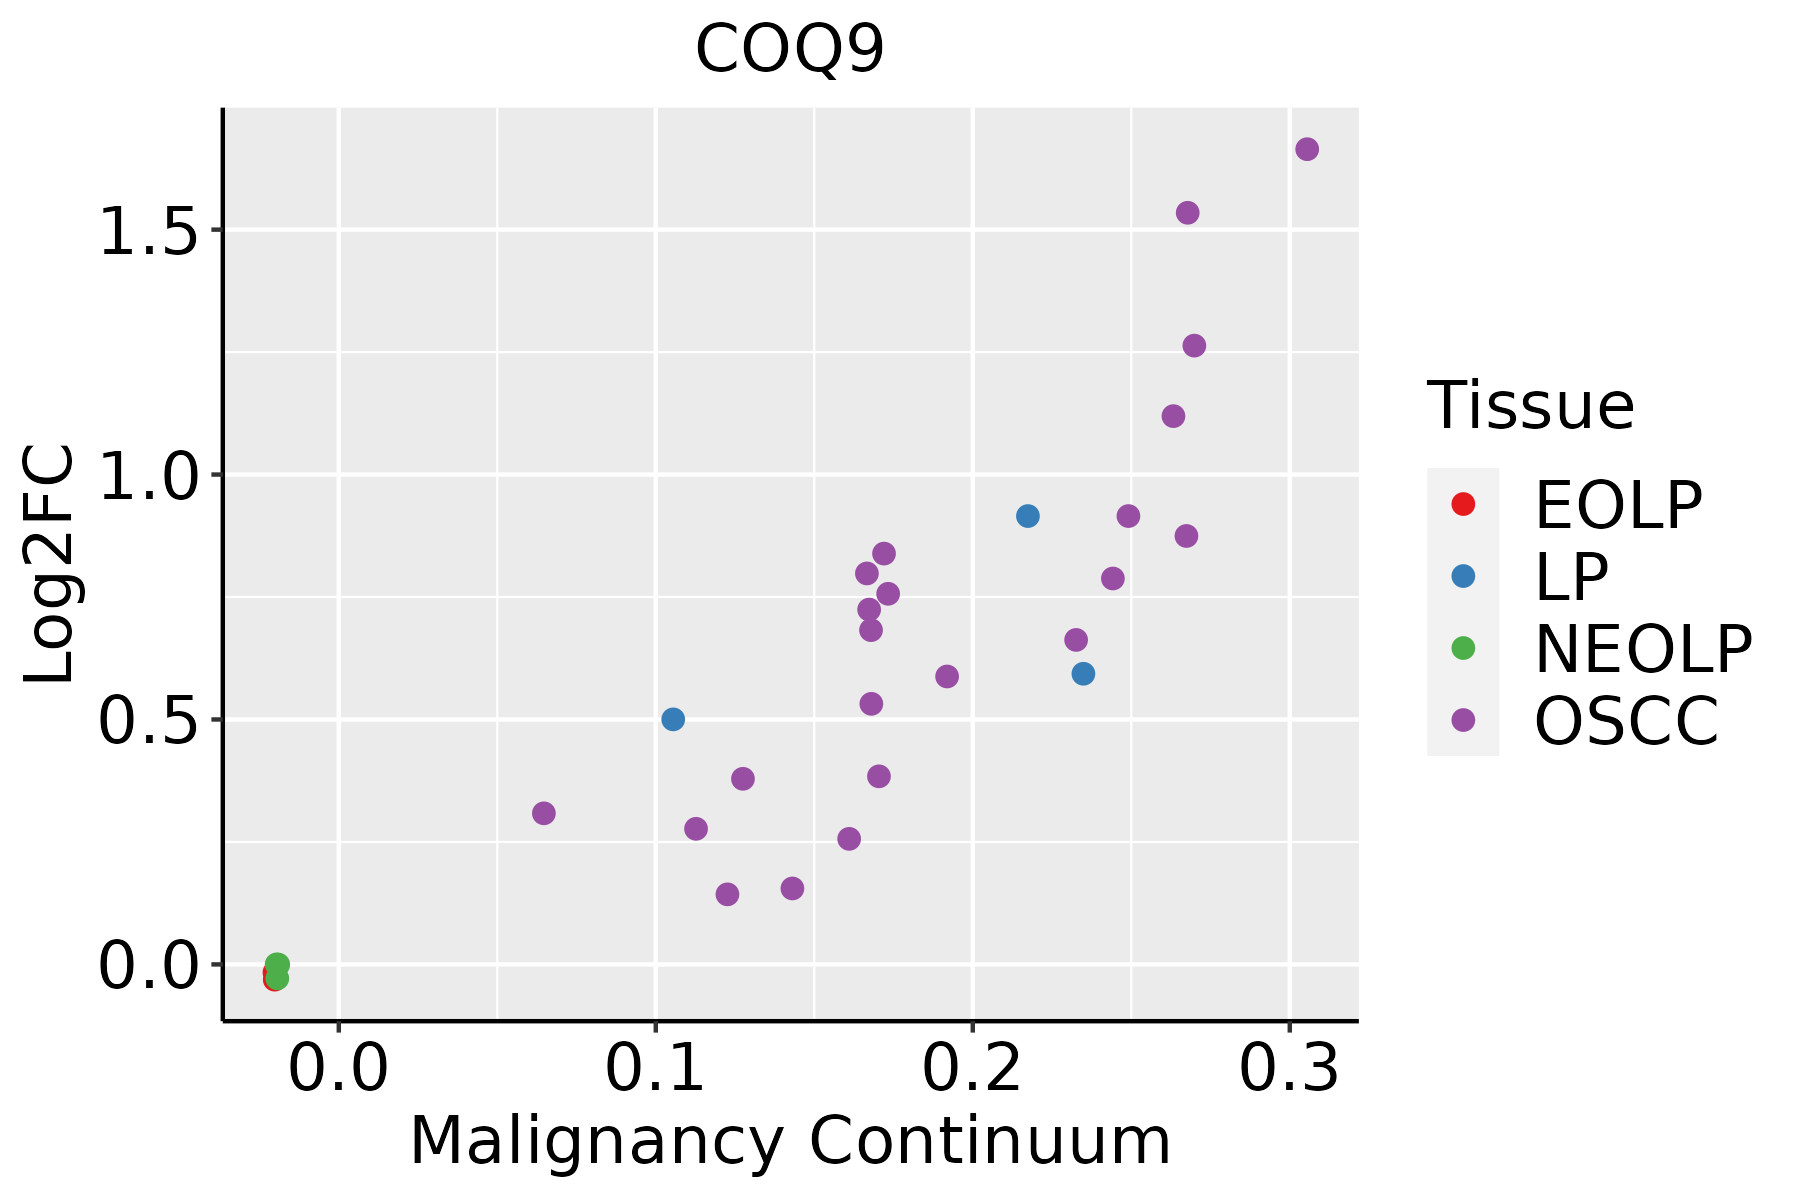 | EOLP: Erosive Oral lichen planus |
| LP: leukoplakia | ||
| NEOLP: Non-erosive oral lichen planus | ||
| OSCC: Oral squamous cell carcinoma | ||
| Skin | 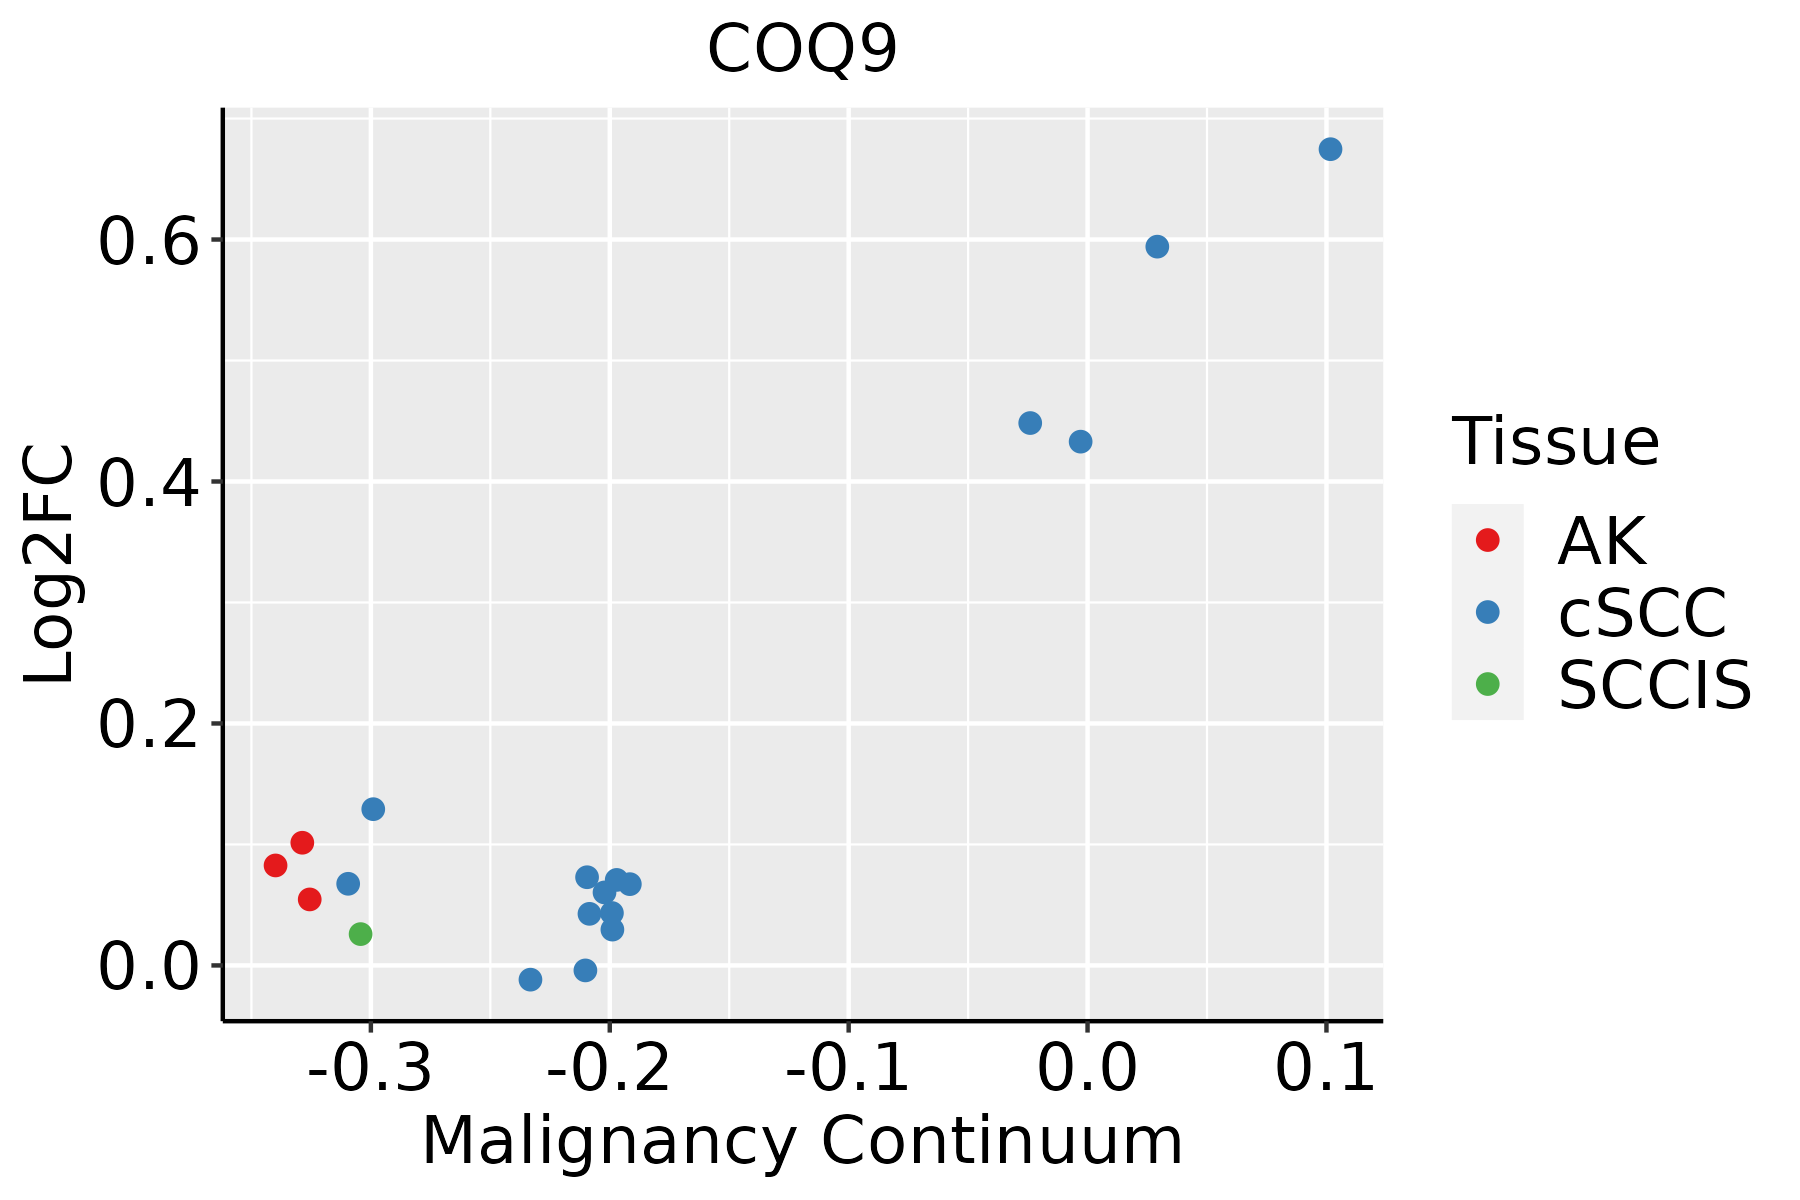 | AK: Actinic keratosis |
| cSCC: Cutaneous squamous cell carcinoma | ||
| SCCIS:squamous cell carcinoma in situ | ||
| Thyroid |  | ATC: Anaplastic thyroid cancer |
| HT: Hashimoto's thyroiditis | ||
| PTC: Papillary thyroid cancer |
| ∗log2FC in expression of this searched gene in stem-like cells from each diseased tissue sample relative to stem-like cells in normal samples in each tissue plotted against the malignancy continuum. Samples are colored based on if they are from different disease stage. |
Top |
Malignant transformation related pathway analysis |
| Find out the enriched GO biological processes and KEGG pathways involved in transition from healthy to precancer to cancer |
| Tissue | Disease Stage | Enriched GO biological Processes |
| Colorectum | AD |  |
| Colorectum | SER |  |
| Colorectum | MSS |  |
| Colorectum | MSI-H |  |
| Colorectum | FAP |  |
| ∗Top 15 enriched GO BP terms are showed in the bar plot of each disease state in each tissue. Each row represents a significant GO biological process which is colored according to the -log10(p.adjust). |
| Page: 1 2 3 4 5 6 7 8 9 |
| GO ID | Tissue | Disease Stage | Description | Gene Ratio | Bg Ratio | pvalue | p.adjust | Count |
| GO:000611920 | Esophagus | HGIN | oxidative phosphorylation | 69/2587 | 141/18723 | 1.37e-23 | 2.05e-20 | 69 |
| GO:000906020 | Esophagus | HGIN | aerobic respiration | 81/2587 | 189/18723 | 1.07e-22 | 9.26e-20 | 81 |
| GO:004603427 | Esophagus | HGIN | ATP metabolic process | 101/2587 | 277/18723 | 1.53e-21 | 1.02e-18 | 101 |
| GO:000609120 | Esophagus | HGIN | generation of precursor metabolites and energy | 145/2587 | 490/18723 | 3.41e-20 | 2.04e-17 | 145 |
| GO:004533320 | Esophagus | HGIN | cellular respiration | 86/2587 | 230/18723 | 2.41e-19 | 1.20e-16 | 86 |
| GO:001598020 | Esophagus | HGIN | energy derivation by oxidation of organic compounds | 105/2587 | 318/18723 | 1.16e-18 | 4.99e-16 | 105 |
| GO:004277320 | Esophagus | HGIN | ATP synthesis coupled electron transport | 49/2587 | 95/18723 | 2.21e-18 | 7.36e-16 | 49 |
| GO:004277520 | Esophagus | HGIN | mitochondrial ATP synthesis coupled electron transport | 49/2587 | 95/18723 | 2.21e-18 | 7.36e-16 | 49 |
| GO:002290420 | Esophagus | HGIN | respiratory electron transport chain | 51/2587 | 114/18723 | 9.63e-16 | 2.41e-13 | 51 |
| GO:001964620 | Esophagus | HGIN | aerobic electron transport chain | 43/2587 | 87/18723 | 1.98e-15 | 4.41e-13 | 43 |
| GO:002290020 | Esophagus | HGIN | electron transport chain | 66/2587 | 175/18723 | 2.21e-15 | 4.73e-13 | 66 |
| GO:000612020 | Esophagus | HGIN | mitochondrial electron transport, NADH to ubiquinone | 28/2587 | 51/18723 | 5.72e-12 | 7.30e-10 | 28 |
| GO:19016614 | Esophagus | HGIN | quinone metabolic process | 13/2587 | 40/18723 | 2.04e-03 | 2.13e-02 | 13 |
| GO:0006091110 | Esophagus | ESCC | generation of precursor metabolites and energy | 331/8552 | 490/18723 | 3.86e-23 | 8.45e-21 | 331 |
| GO:0045333110 | Esophagus | ESCC | cellular respiration | 173/8552 | 230/18723 | 4.53e-20 | 5.99e-18 | 173 |
| GO:0009060110 | Esophagus | ESCC | aerobic respiration | 145/8552 | 189/18723 | 2.16e-18 | 2.21e-16 | 145 |
| GO:0015980110 | Esophagus | ESCC | energy derivation by oxidation of organic compounds | 220/8552 | 318/18723 | 1.20e-17 | 1.09e-15 | 220 |
| GO:0022900110 | Esophagus | ESCC | electron transport chain | 133/8552 | 175/18723 | 2.18e-16 | 1.67e-14 | 133 |
| GO:0046034111 | Esophagus | ESCC | ATP metabolic process | 189/8552 | 277/18723 | 1.99e-14 | 1.04e-12 | 189 |
| GO:0006119111 | Esophagus | ESCC | oxidative phosphorylation | 106/8552 | 141/18723 | 8.19e-13 | 3.63e-11 | 106 |
| Page: 1 2 3 4 5 6 7 |
| Pathway ID | Tissue | Disease Stage | Description | Gene Ratio | Bg Ratio | pvalue | p.adjust | qvalue | Count |
| Page: 1 |
Top |
Cell-cell communication analysis |
| Identification of potential cell-cell interactions between two cell types and their ligand-receptor pairs for different disease states |
| Ligand | Receptor | LRpair | Pathway | Tissue | Disease Stage |
| Page: 1 |
Top |
Single-cell gene regulatory network inference analysis |
| Find out the significant the regulons (TFs) and the target genes of each regulon across cell types for different disease states |
| TF | Cell Type | Tissue | Disease Stage | Target Gene | RSS | Regulon Activity |
| ∗The dot plots of a searched regulon are shown for all cell subpopulations in each disease state of each tissue based on the regulon specific score inferred using pySCENIC and by calculating the average expression. |
| Page: 1 |
Top |
Somatic mutation of malignant transformation related genes |
| Annotation of somatic variants for genes involved in malignant transformation |
| Hugo Symbol | Variant Class | Variant Classification | dbSNP RS | HGVSc | HGVSp | HGVSp Short | SWISSPROT | BIOTYPE | SIFT | PolyPhen | Tumor Sample Barcode | Tissue | Histology | Sex | Age | Stage | Therapy Types | Drugs | Outcome |
| COQ9 | SNV | Missense_Mutation | c.76N>A | p.Ala26Thr | p.A26T | O75208 | protein_coding | tolerated_low_confidence(0.61) | benign(0) | TCGA-AA-3492-01 | Colorectum | colon adenocarcinoma | Female | >=65 | I/II | Unknown | Unknown | SD | |
| COQ9 | SNV | Missense_Mutation | c.743N>T | p.Ala248Val | p.A248V | O75208 | protein_coding | tolerated(0.07) | benign(0.068) | TCGA-AA-3663-01 | Colorectum | colon adenocarcinoma | Male | <65 | I/II | Unknown | Unknown | SD | |
| COQ9 | SNV | Missense_Mutation | c.342N>A | p.His114Gln | p.H114Q | O75208 | protein_coding | deleterious(0.02) | probably_damaging(0.949) | TCGA-AA-3976-01 | Colorectum | colon adenocarcinoma | Male | >=65 | III/IV | Chemotherapy | folinic | CR | |
| COQ9 | SNV | Missense_Mutation | rs201097286 | c.467G>A | p.Arg156Gln | p.R156Q | O75208 | protein_coding | tolerated(0.49) | benign(0.003) | TCGA-AD-A5EJ-01 | Colorectum | colon adenocarcinoma | Female | >=65 | I/II | Unknown | Unknown | SD |
| COQ9 | SNV | Missense_Mutation | rs763626877 | c.259G>A | p.Gly87Ser | p.G87S | O75208 | protein_coding | tolerated(0.05) | probably_damaging(0.999) | TCGA-AZ-6598-01 | Colorectum | colon adenocarcinoma | Female | >=65 | I/II | Unknown | Unknown | SD |
| COQ9 | SNV | Missense_Mutation | c.275A>G | p.Asp92Gly | p.D92G | O75208 | protein_coding | tolerated(0.25) | benign(0) | TCGA-CK-4951-01 | Colorectum | colon adenocarcinoma | Female | >=65 | I/II | Unknown | Unknown | PD | |
| COQ9 | SNV | Missense_Mutation | c.227N>T | p.Ser76Phe | p.S76F | O75208 | protein_coding | tolerated(0.57) | benign(0.001) | TCGA-AG-A002-01 | Colorectum | rectum adenocarcinoma | Male | <65 | I/II | Unknown | Unknown | SD | |
| COQ9 | insertion | Frame_Shift_Ins | novel | c.481_482insA | p.Leu161HisfsTer38 | p.L161Hfs*38 | O75208 | protein_coding | TCGA-AG-A00Y-01 | Colorectum | rectum adenocarcinoma | Male | >=65 | I/II | Unknown | Unknown | PD | ||
| COQ9 | SNV | Missense_Mutation | novel | c.697N>T | p.Asp233Tyr | p.D233Y | O75208 | protein_coding | deleterious(0) | probably_damaging(0.999) | TCGA-A5-A0G1-01 | Endometrium | uterine corpus endometrioid carcinoma | Female | >=65 | I/II | Unknown | Unknown | SD |
| COQ9 | SNV | Missense_Mutation | novel | c.98N>C | p.Val33Ala | p.V33A | O75208 | protein_coding | tolerated_low_confidence(0.69) | benign(0) | TCGA-A5-A0G2-01 | Endometrium | uterine corpus endometrioid carcinoma | Female | <65 | III/IV | Unknown | Unknown | SD |
| Page: 1 2 3 4 |
Top |
Related drugs of malignant transformation related genes |
| Identification of chemicals and drugs interact with genes involved in malignant transfromation |
| (DGIdb 4.0) |
| Entrez ID | Symbol | Category | Interaction Types | Drug Claim Name | Drug Name | PMIDs |
| Page: 1 |

Copyright 2023-Present -The University of Texas Health Science Center at Houston |