
|
|||||
|
 | |
| |
| |
| |
| |
| |
|
Gene: COQ8A |
Gene summary for COQ8A |
| Gene information | Species | Human | Gene symbol | COQ8A | Gene ID | 56997 |
| Gene name | coenzyme Q8A | |
| Gene Alias | ADCK3 | |
| Cytomap | 1q42.13 | |
| Gene Type | protein-coding | GO ID | GO:0006743 | UniProtAcc | A0A024R3S3 |
Top |
Malignant transformation analysis |
| Identification of the aberrant gene expression in precancerous and cancerous lesions by comparing the gene expression of stem-like cells in diseased tissues with normal stem cells |
| Entrez ID | Symbol | Replicates | Species | Organ | Tissue | Adj P-value | Log2FC | Malignancy |
| 56997 | COQ8A | HCC1 | Human | Liver | HCC | 7.61e-32 | 5.27e+00 | 0.5336 |
| 56997 | COQ8A | HCC2 | Human | Liver | HCC | 8.20e-09 | 3.28e+00 | 0.5341 |
| 56997 | COQ8A | S014 | Human | Liver | HCC | 3.39e-30 | 9.93e-01 | 0.2254 |
| 56997 | COQ8A | S015 | Human | Liver | HCC | 2.28e-20 | 9.45e-01 | 0.2375 |
| 56997 | COQ8A | S016 | Human | Liver | HCC | 2.94e-32 | 1.04e+00 | 0.2243 |
| 56997 | COQ8A | S027 | Human | Liver | HCC | 1.01e-08 | 6.40e-01 | 0.2446 |
| 56997 | COQ8A | S028 | Human | Liver | HCC | 7.96e-20 | 8.20e-01 | 0.2503 |
| 56997 | COQ8A | S029 | Human | Liver | HCC | 8.71e-25 | 9.88e-01 | 0.2581 |
| Page: 1 |
| Tissue | Expression Dynamics | Abbreviation |
| Liver | 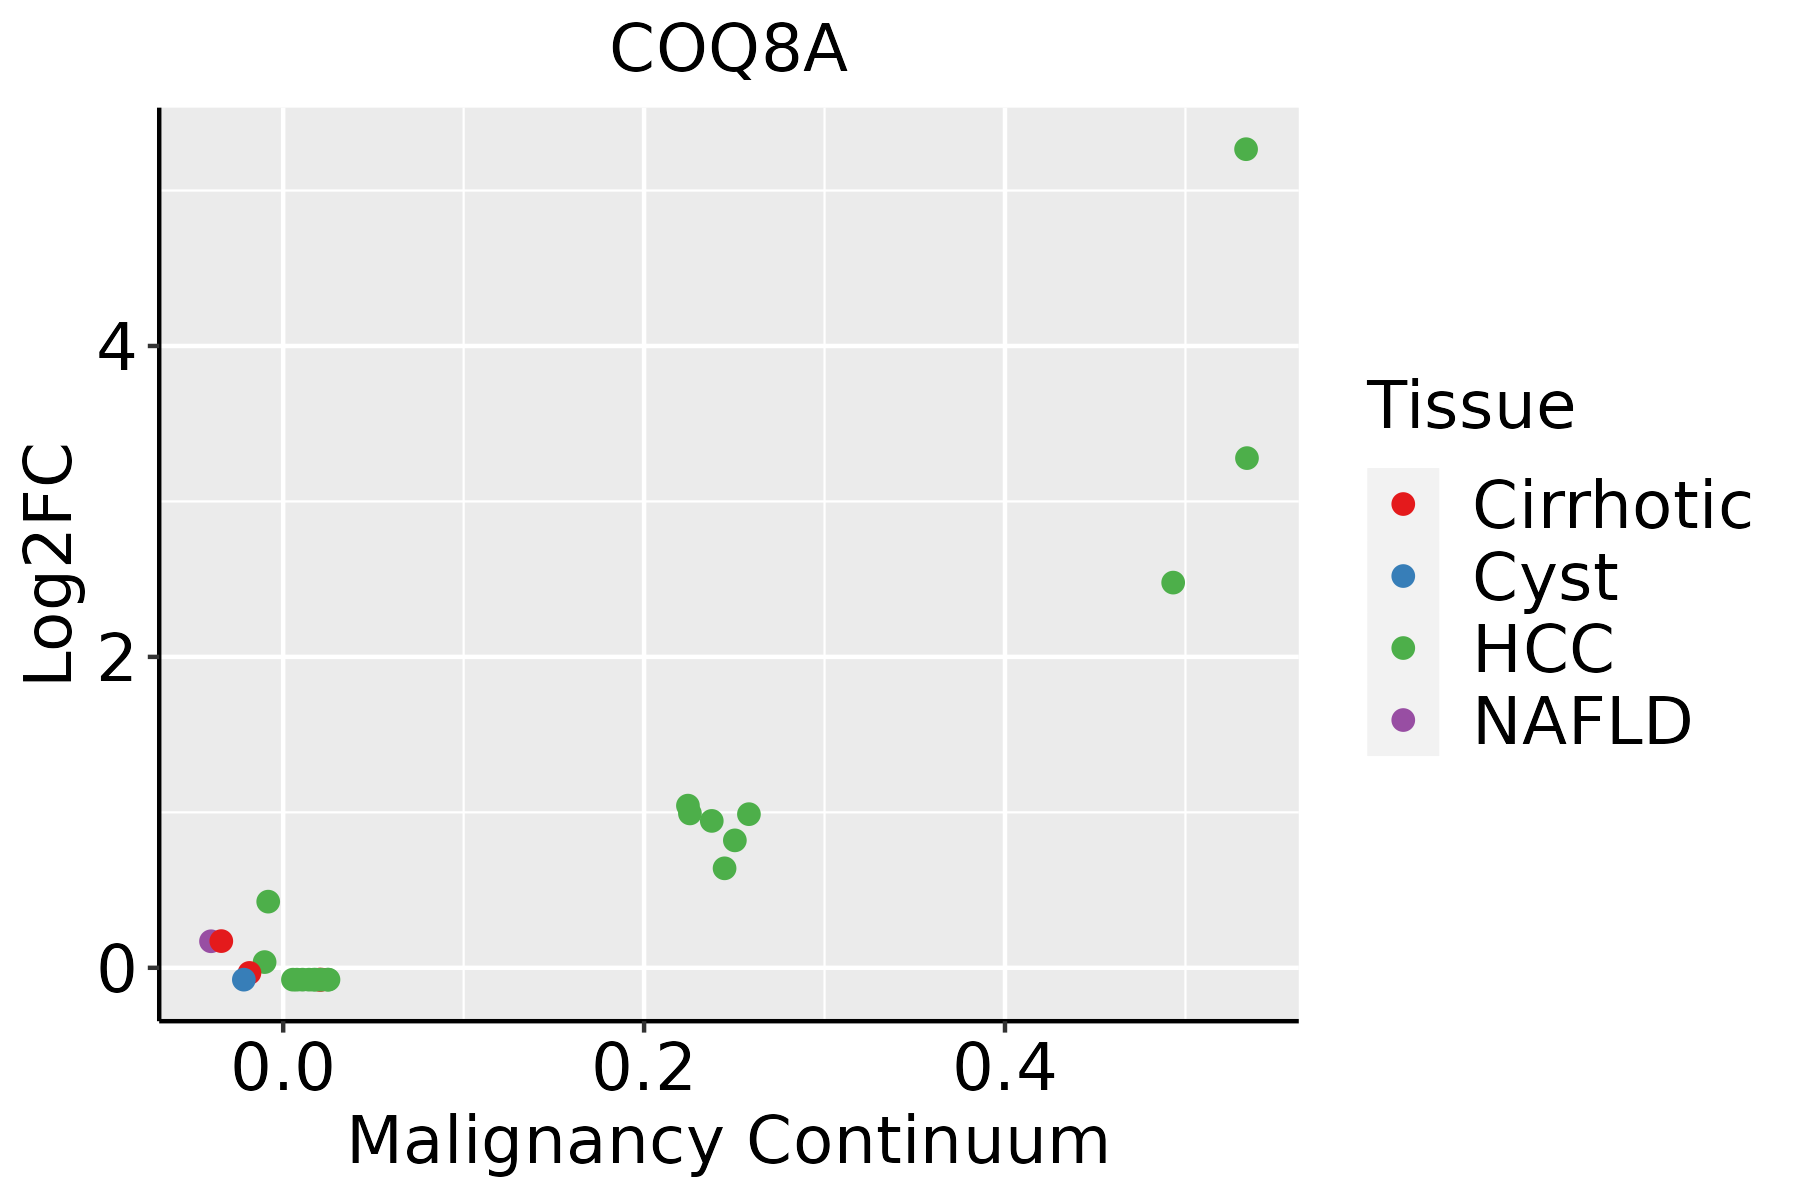 | HCC: Hepatocellular carcinoma |
| NAFLD: Non-alcoholic fatty liver disease |
| ∗log2FC in expression of this searched gene in stem-like cells from each diseased tissue sample relative to stem-like cells in normal samples in each tissue plotted against the malignancy continuum. Samples are colored based on if they are from different disease stage. |
Top |
Malignant transformation related pathway analysis |
| Find out the enriched GO biological processes and KEGG pathways involved in transition from healthy to precancer to cancer |
| Tissue | Disease Stage | Enriched GO biological Processes |
| Colorectum | AD |  |
| Colorectum | SER |  |
| Colorectum | MSS |  |
| Colorectum | MSI-H |  |
| Colorectum | FAP |  |
| ∗Top 15 enriched GO BP terms are showed in the bar plot of each disease state in each tissue. Each row represents a significant GO biological process which is colored according to the -log10(p.adjust). |
| Page: 1 2 3 4 5 6 7 8 9 |
| GO ID | Tissue | Disease Stage | Description | Gene Ratio | Bg Ratio | pvalue | p.adjust | Count |
| GO:004218021 | Liver | HCC | cellular ketone metabolic process | 123/7958 | 211/18723 | 2.52e-06 | 3.37e-05 | 123 |
| GO:19016611 | Liver | HCC | quinone metabolic process | 26/7958 | 40/18723 | 3.40e-03 | 1.55e-02 | 26 |
| Page: 1 |
| Pathway ID | Tissue | Disease Stage | Description | Gene Ratio | Bg Ratio | pvalue | p.adjust | qvalue | Count |
| Page: 1 |
Top |
Cell-cell communication analysis |
| Identification of potential cell-cell interactions between two cell types and their ligand-receptor pairs for different disease states |
| Ligand | Receptor | LRpair | Pathway | Tissue | Disease Stage |
| Page: 1 |
Top |
Single-cell gene regulatory network inference analysis |
| Find out the significant the regulons (TFs) and the target genes of each regulon across cell types for different disease states |
| TF | Cell Type | Tissue | Disease Stage | Target Gene | RSS | Regulon Activity |
| ∗The dot plots of a searched regulon are shown for all cell subpopulations in each disease state of each tissue based on the regulon specific score inferred using pySCENIC and by calculating the average expression. |
| Page: 1 |
Top |
Somatic mutation of malignant transformation related genes |
| Annotation of somatic variants for genes involved in malignant transformation |
| Hugo Symbol | Variant Class | Variant Classification | dbSNP RS | HGVSc | HGVSp | HGVSp Short | SWISSPROT | BIOTYPE | SIFT | PolyPhen | Tumor Sample Barcode | Tissue | Histology | Sex | Age | Stage | Therapy Types | Drugs | Outcome |
| COQ8A | SNV | Missense_Mutation | c.946N>G | p.Leu316Val | p.L316V | Q8NI60 | protein_coding | deleterious(0.04) | possibly_damaging(0.456) | TCGA-A1-A0SI-01 | Breast | breast invasive carcinoma | Female | <65 | I/II | Unknown | Unknown | SD | |
| COQ8A | SNV | Missense_Mutation | rs765966679 | c.337G>A | p.Glu113Lys | p.E113K | Q8NI60 | protein_coding | tolerated_low_confidence(0.16) | benign(0) | TCGA-2W-A8YY-01 | Cervix | cervical & endocervical cancer | Female | <65 | I/II | Chemotherapy | cisplatin | CR |
| COQ8A | SNV | Missense_Mutation | c.1143N>C | p.Met381Ile | p.M381I | Q8NI60 | protein_coding | tolerated(0.08) | benign(0.036) | TCGA-IR-A3LA-01 | Cervix | cervical & endocervical cancer | Female | <65 | I/II | Chemotherapy | cisplatin | CR | |
| COQ8A | SNV | Missense_Mutation | rs200541514 | c.611N>A | p.Arg204Gln | p.R204Q | Q8NI60 | protein_coding | deleterious(0.04) | possibly_damaging(0.506) | TCGA-A6-3809-01 | Colorectum | colon adenocarcinoma | Female | >=65 | I/II | Unknown | Unknown | SD |
| COQ8A | SNV | Missense_Mutation | novel | c.1822N>C | p.Ser608Pro | p.S608P | Q8NI60 | protein_coding | deleterious(0) | probably_damaging(0.996) | TCGA-A6-3809-01 | Colorectum | colon adenocarcinoma | Female | >=65 | I/II | Unknown | Unknown | SD |
| COQ8A | SNV | Missense_Mutation | rs578189699 | c.1532C>T | p.Thr511Met | p.T511M | Q8NI60 | protein_coding | deleterious(0) | probably_damaging(0.943) | TCGA-AZ-4308-01 | Colorectum | colon adenocarcinoma | Female | <65 | III/IV | Targeted Molecular therapy | avastin | CR |
| COQ8A | SNV | Missense_Mutation | rs765825787 | c.1186N>A | p.Asp396Asn | p.D396N | Q8NI60 | protein_coding | deleterious(0.03) | benign(0.166) | TCGA-CA-6718-01 | Colorectum | colon adenocarcinoma | Male | <65 | I/II | Unknown | Unknown | PD |
| COQ8A | SNV | Missense_Mutation | rs201908721 | c.895C>T | p.Arg299Trp | p.R299W | Q8NI60 | protein_coding | deleterious(0) | probably_damaging(0.965) | TCGA-WS-AB45-01 | Colorectum | colon adenocarcinoma | Female | <65 | I/II | Unknown | Unknown | SD |
| COQ8A | SNV | Missense_Mutation | novel | c.407C>A | p.Ser136Tyr | p.S136Y | Q8NI60 | protein_coding | tolerated(0.92) | benign(0.044) | TCGA-AG-3726-01 | Colorectum | rectum adenocarcinoma | Female | <65 | I/II | Unknown | Unknown | SD |
| COQ8A | SNV | Missense_Mutation | c.470G>A | p.Gly157Asp | p.G157D | Q8NI60 | protein_coding | tolerated(0.07) | benign(0.021) | TCGA-AG-A002-01 | Colorectum | rectum adenocarcinoma | Male | <65 | I/II | Unknown | Unknown | SD |
| Page: 1 2 3 4 5 6 7 8 |
Top |
Related drugs of malignant transformation related genes |
| Identification of chemicals and drugs interact with genes involved in malignant transfromation |
| (DGIdb 4.0) |
| Entrez ID | Symbol | Category | Interaction Types | Drug Claim Name | Drug Name | PMIDs |
| Page: 1 |

Copyright 2023-Present -The University of Texas Health Science Center at Houston |