
|
|||||
|
 | |
| |
| |
| |
| |
| |
|
Gene: COQ6 |
Gene summary for COQ6 |
| Gene information | Species | Human | Gene symbol | COQ6 | Gene ID | 51004 |
| Gene name | coenzyme Q6, monooxygenase | |
| Gene Alias | CGI-10 | |
| Cytomap | 14q24.3 | |
| Gene Type | protein-coding | GO ID | GO:0006743 | UniProtAcc | Q9Y2Z9 |
Top |
Malignant transformation analysis |
| Identification of the aberrant gene expression in precancerous and cancerous lesions by comparing the gene expression of stem-like cells in diseased tissues with normal stem cells |
| Entrez ID | Symbol | Replicates | Species | Organ | Tissue | Adj P-value | Log2FC | Malignancy |
| 51004 | COQ6 | LZE4T | Human | Esophagus | ESCC | 5.52e-06 | 2.27e-01 | 0.0811 |
| 51004 | COQ6 | LZE8T | Human | Esophagus | ESCC | 3.13e-05 | 1.65e-01 | 0.067 |
| 51004 | COQ6 | LZE20T | Human | Esophagus | ESCC | 7.19e-04 | 1.17e-01 | 0.0662 |
| 51004 | COQ6 | LZE22T | Human | Esophagus | ESCC | 3.68e-07 | 3.90e-01 | 0.068 |
| 51004 | COQ6 | LZE24T | Human | Esophagus | ESCC | 4.35e-17 | 4.02e-01 | 0.0596 |
| 51004 | COQ6 | LZE6T | Human | Esophagus | ESCC | 6.91e-04 | 1.79e-01 | 0.0845 |
| 51004 | COQ6 | P1T-E | Human | Esophagus | ESCC | 3.86e-02 | 1.60e-01 | 0.0875 |
| 51004 | COQ6 | P2T-E | Human | Esophagus | ESCC | 5.30e-21 | 2.72e-01 | 0.1177 |
| 51004 | COQ6 | P4T-E | Human | Esophagus | ESCC | 5.69e-19 | 4.13e-01 | 0.1323 |
| 51004 | COQ6 | P5T-E | Human | Esophagus | ESCC | 2.03e-09 | 1.91e-01 | 0.1327 |
| 51004 | COQ6 | P8T-E | Human | Esophagus | ESCC | 1.25e-26 | 3.86e-01 | 0.0889 |
| 51004 | COQ6 | P9T-E | Human | Esophagus | ESCC | 7.94e-03 | 9.72e-02 | 0.1131 |
| 51004 | COQ6 | P10T-E | Human | Esophagus | ESCC | 1.75e-25 | 3.67e-01 | 0.116 |
| 51004 | COQ6 | P11T-E | Human | Esophagus | ESCC | 1.85e-10 | 3.51e-01 | 0.1426 |
| 51004 | COQ6 | P12T-E | Human | Esophagus | ESCC | 5.95e-29 | 4.78e-01 | 0.1122 |
| 51004 | COQ6 | P15T-E | Human | Esophagus | ESCC | 4.58e-23 | 4.61e-01 | 0.1149 |
| 51004 | COQ6 | P16T-E | Human | Esophagus | ESCC | 7.16e-26 | 4.50e-01 | 0.1153 |
| 51004 | COQ6 | P17T-E | Human | Esophagus | ESCC | 8.34e-07 | 3.19e-01 | 0.1278 |
| 51004 | COQ6 | P19T-E | Human | Esophagus | ESCC | 7.49e-08 | 4.94e-01 | 0.1662 |
| 51004 | COQ6 | P20T-E | Human | Esophagus | ESCC | 4.92e-15 | 3.17e-01 | 0.1124 |
| Page: 1 2 3 4 |
| Tissue | Expression Dynamics | Abbreviation |
| Esophagus | 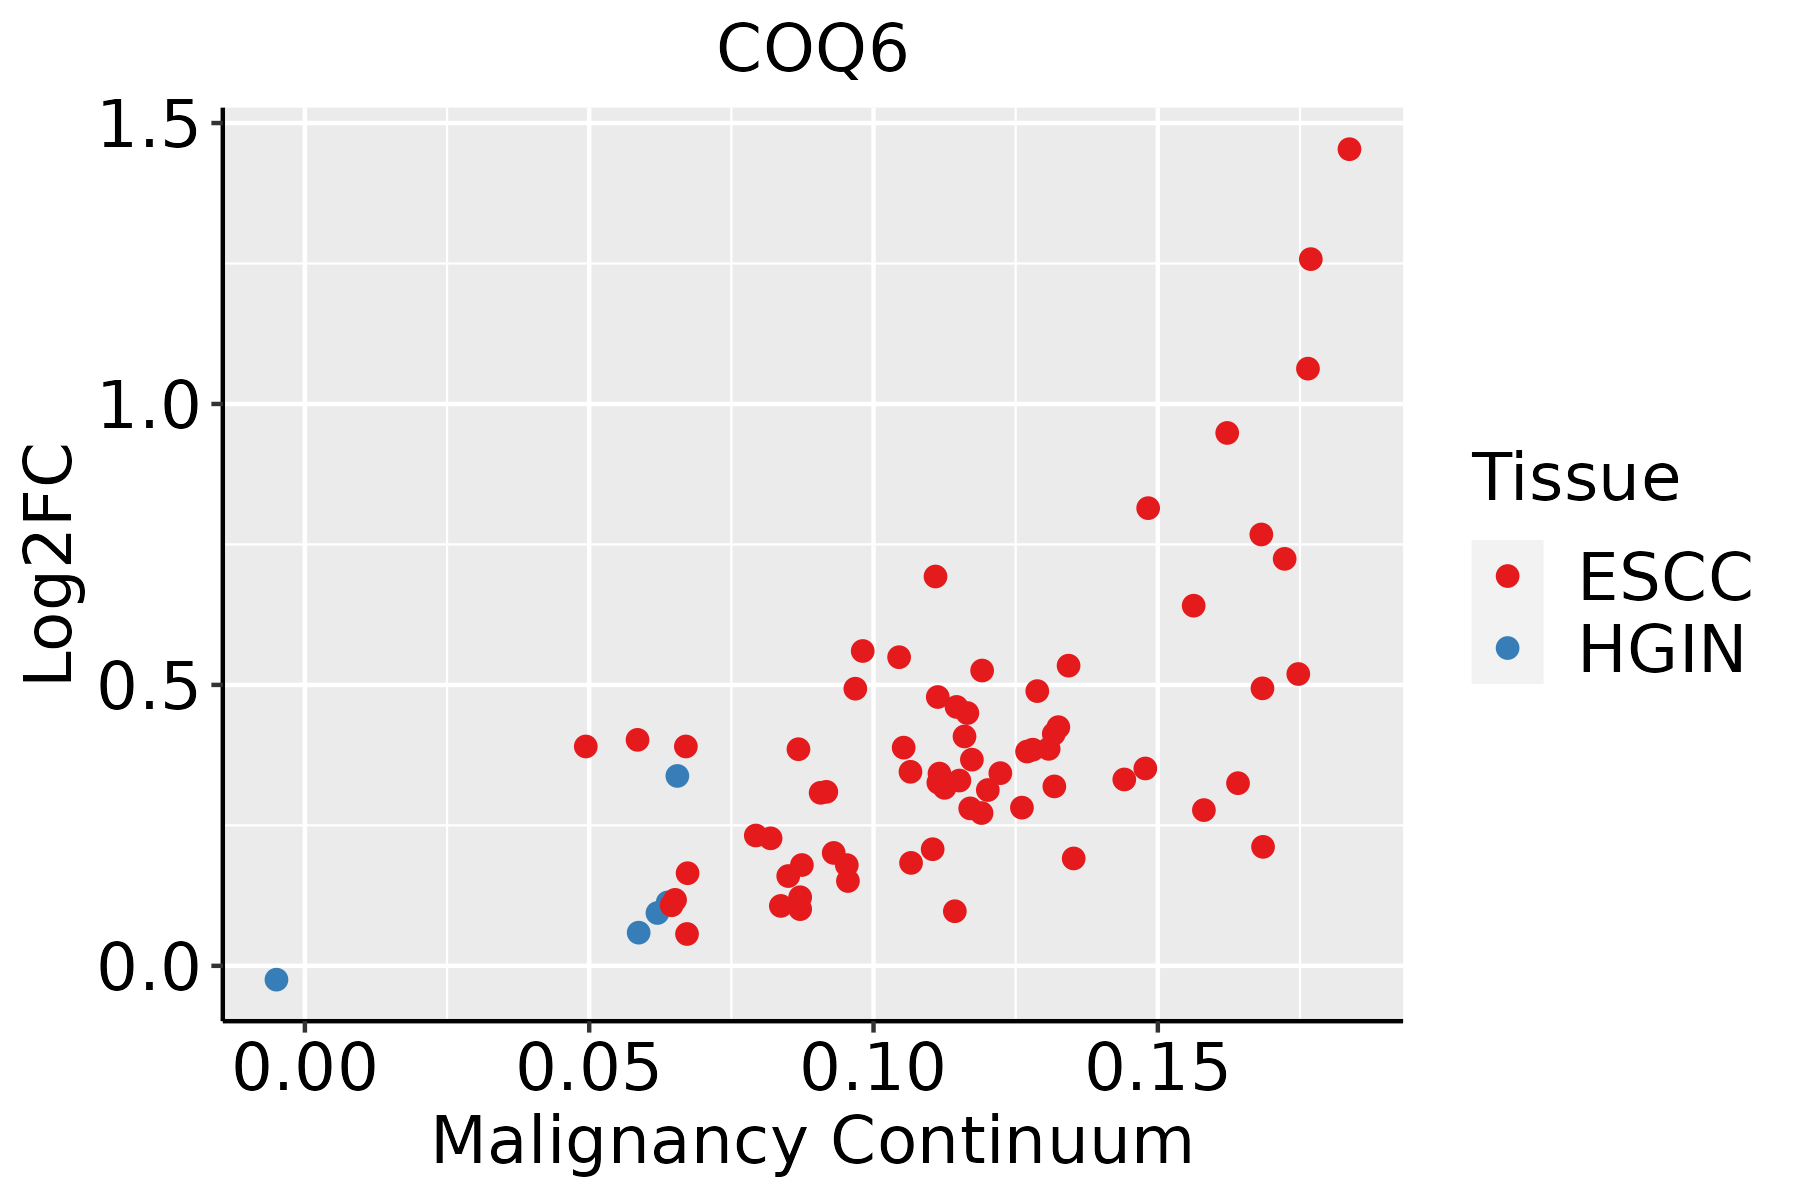 | ESCC: Esophageal squamous cell carcinoma |
| HGIN: High-grade intraepithelial neoplasias | ||
| LGIN: Low-grade intraepithelial neoplasias | ||
| Oral Cavity |  | EOLP: Erosive Oral lichen planus |
| LP: leukoplakia | ||
| NEOLP: Non-erosive oral lichen planus | ||
| OSCC: Oral squamous cell carcinoma |
| ∗log2FC in expression of this searched gene in stem-like cells from each diseased tissue sample relative to stem-like cells in normal samples in each tissue plotted against the malignancy continuum. Samples are colored based on if they are from different disease stage. |
Top |
Malignant transformation related pathway analysis |
| Find out the enriched GO biological processes and KEGG pathways involved in transition from healthy to precancer to cancer |
| Tissue | Disease Stage | Enriched GO biological Processes |
| Colorectum | AD |  |
| Colorectum | SER |  |
| Colorectum | MSS |  |
| Colorectum | MSI-H |  |
| Colorectum | FAP |  |
| ∗Top 15 enriched GO BP terms are showed in the bar plot of each disease state in each tissue. Each row represents a significant GO biological process which is colored according to the -log10(p.adjust). |
| Page: 1 2 3 4 5 6 7 8 9 |
| GO ID | Tissue | Disease Stage | Description | Gene Ratio | Bg Ratio | pvalue | p.adjust | Count |
| GO:190166112 | Esophagus | ESCC | quinone metabolic process | 34/8552 | 40/18723 | 3.00e-07 | 4.27e-06 | 34 |
| GO:00067432 | Esophagus | ESCC | ubiquinone metabolic process | 17/8552 | 19/18723 | 9.02e-05 | 6.50e-04 | 17 |
| GO:00067442 | Esophagus | ESCC | ubiquinone biosynthetic process | 15/8552 | 17/18723 | 3.48e-04 | 2.03e-03 | 15 |
| GO:19016632 | Esophagus | ESCC | quinone biosynthetic process | 15/8552 | 17/18723 | 3.48e-04 | 2.03e-03 | 15 |
| GO:00421805 | Esophagus | ESCC | cellular ketone metabolic process | 120/8552 | 211/18723 | 6.70e-04 | 3.55e-03 | 120 |
| GO:19016613 | Oral cavity | OSCC | quinone metabolic process | 32/7305 | 40/18723 | 1.40e-07 | 2.34e-06 | 32 |
| GO:00421804 | Oral cavity | OSCC | cellular ketone metabolic process | 111/7305 | 211/18723 | 3.94e-05 | 3.45e-04 | 111 |
| GO:0006743 | Oral cavity | OSCC | ubiquinone metabolic process | 16/7305 | 19/18723 | 7.05e-05 | 5.60e-04 | 16 |
| GO:0006744 | Oral cavity | OSCC | ubiquinone biosynthetic process | 14/7305 | 17/18723 | 3.31e-04 | 2.04e-03 | 14 |
| GO:1901663 | Oral cavity | OSCC | quinone biosynthetic process | 14/7305 | 17/18723 | 3.31e-04 | 2.04e-03 | 14 |
| GO:0042181 | Oral cavity | OSCC | ketone biosynthetic process | 26/7305 | 43/18723 | 3.55e-03 | 1.49e-02 | 26 |
| GO:190166111 | Oral cavity | LP | quinone metabolic process | 24/4623 | 40/18723 | 2.17e-06 | 4.85e-05 | 24 |
| GO:00067441 | Oral cavity | LP | ubiquinone biosynthetic process | 10/4623 | 17/18723 | 2.80e-03 | 1.95e-02 | 10 |
| GO:19016631 | Oral cavity | LP | quinone biosynthetic process | 10/4623 | 17/18723 | 2.80e-03 | 1.95e-02 | 10 |
| GO:004218012 | Oral cavity | LP | cellular ketone metabolic process | 70/4623 | 211/18723 | 3.29e-03 | 2.21e-02 | 70 |
| GO:00421811 | Oral cavity | LP | ketone biosynthetic process | 19/4623 | 43/18723 | 4.04e-03 | 2.61e-02 | 19 |
| GO:00067431 | Oral cavity | LP | ubiquinone metabolic process | 10/4623 | 19/18723 | 8.09e-03 | 4.40e-02 | 10 |
| Page: 1 |
| Pathway ID | Tissue | Disease Stage | Description | Gene Ratio | Bg Ratio | pvalue | p.adjust | qvalue | Count |
| hsa012405 | Esophagus | ESCC | Biosynthesis of cofactors | 97/4205 | 153/8465 | 3.88e-04 | 1.35e-03 | 6.94e-04 | 97 |
| hsa0124012 | Esophagus | ESCC | Biosynthesis of cofactors | 97/4205 | 153/8465 | 3.88e-04 | 1.35e-03 | 6.94e-04 | 97 |
| hsa012404 | Oral cavity | OSCC | Biosynthesis of cofactors | 88/3704 | 153/8465 | 3.84e-04 | 1.20e-03 | 6.12e-04 | 88 |
| hsa0124011 | Oral cavity | OSCC | Biosynthesis of cofactors | 88/3704 | 153/8465 | 3.84e-04 | 1.20e-03 | 6.12e-04 | 88 |
| hsa001302 | Oral cavity | LP | Ubiquinone and other terpenoid-quinone biosynthesis | 8/2418 | 11/8465 | 3.03e-03 | 1.29e-02 | 8.35e-03 | 8 |
| hsa0124021 | Oral cavity | LP | Biosynthesis of cofactors | 57/2418 | 153/8465 | 1.17e-02 | 3.91e-02 | 2.52e-02 | 57 |
| hsa001303 | Oral cavity | LP | Ubiquinone and other terpenoid-quinone biosynthesis | 8/2418 | 11/8465 | 3.03e-03 | 1.29e-02 | 8.35e-03 | 8 |
| hsa0124031 | Oral cavity | LP | Biosynthesis of cofactors | 57/2418 | 153/8465 | 1.17e-02 | 3.91e-02 | 2.52e-02 | 57 |
| Page: 1 |
Top |
Cell-cell communication analysis |
| Identification of potential cell-cell interactions between two cell types and their ligand-receptor pairs for different disease states |
| Ligand | Receptor | LRpair | Pathway | Tissue | Disease Stage |
| Page: 1 |
Top |
Single-cell gene regulatory network inference analysis |
| Find out the significant the regulons (TFs) and the target genes of each regulon across cell types for different disease states |
| TF | Cell Type | Tissue | Disease Stage | Target Gene | RSS | Regulon Activity |
| ∗The dot plots of a searched regulon are shown for all cell subpopulations in each disease state of each tissue based on the regulon specific score inferred using pySCENIC and by calculating the average expression. |
| Page: 1 |
Top |
Somatic mutation of malignant transformation related genes |
| Annotation of somatic variants for genes involved in malignant transformation |
| Hugo Symbol | Variant Class | Variant Classification | dbSNP RS | HGVSc | HGVSp | HGVSp Short | SWISSPROT | BIOTYPE | SIFT | PolyPhen | Tumor Sample Barcode | Tissue | Histology | Sex | Age | Stage | Therapy Types | Drugs | Outcome |
| COQ6 | SNV | Missense_Mutation | c.671G>A | p.Ser224Asn | p.S224N | Q9Y2Z9 | protein_coding | tolerated(0.28) | benign(0.024) | TCGA-A8-A09Z-01 | Breast | breast invasive carcinoma | Female | >=65 | I/II | Unknown | Unknown | SD | |
| COQ6 | SNV | Missense_Mutation | rs759954362 | c.1033C>A | p.Leu345Met | p.L345M | Q9Y2Z9 | protein_coding | tolerated(0.41) | benign(0.003) | TCGA-C8-A1HM-01 | Breast | breast invasive carcinoma | Female | >=65 | I/II | Chemotherapy | doxorubicin | CR |
| COQ6 | SNV | Missense_Mutation | c.385A>T | p.Ile129Leu | p.I129L | Q9Y2Z9 | protein_coding | deleterious(0) | benign(0.241) | TCGA-D8-A1J8-01 | Breast | breast invasive carcinoma | Female | >=65 | I/II | Hormone Therapy | nolvadex | SD | |
| COQ6 | insertion | Frame_Shift_Ins | novel | c.1114_1115insGCTTTGGTTACAAACAAGGTTTCTTTATTGAATTTTTA | p.His372ArgfsTer45 | p.H372Rfs*45 | Q9Y2Z9 | protein_coding | TCGA-A8-A07U-01 | Breast | breast invasive carcinoma | Female | >=65 | III/IV | Chemotherapy | 5-fluorouracil | SD | ||
| COQ6 | insertion | In_Frame_Ins | novel | c.1300_1301insCCTCGGGTGGCGCTC | p.Tyr434delinsSerSerGlyGlyAlaHis | p.Y434delinsSSGGAH | Q9Y2Z9 | protein_coding | TCGA-AQ-A04J-01 | Breast | breast invasive carcinoma | Female | <65 | I/II | Chemotherapy | cytoxan | SD | ||
| COQ6 | deletion | Frame_Shift_Del | novel | c.1340delN | p.Gly448AlafsTer32 | p.G448Afs*32 | Q9Y2Z9 | protein_coding | TCGA-EW-A2FV-01 | Breast | breast invasive carcinoma | Female | <65 | III/IV | Chemotherapy | docetaxel | SD | ||
| COQ6 | SNV | Missense_Mutation | rs377529207 | c.367G>A | p.Ala123Thr | p.A123T | Q9Y2Z9 | protein_coding | deleterious(0.05) | benign(0.044) | TCGA-FU-A3HZ-01 | Cervix | cervical & endocervical cancer | Female | <65 | I/II | Chemotherapy | cisplatin | CR |
| COQ6 | SNV | Missense_Mutation | novel | c.1267N>G | p.Leu423Val | p.L423V | Q9Y2Z9 | protein_coding | tolerated(0.72) | benign(0.145) | TCGA-VS-A9UM-01 | Cervix | cervical & endocervical cancer | Female | <65 | I/II | Chemotherapy | cisplatin | CR |
| COQ6 | SNV | Missense_Mutation | novel | c.1268N>C | p.Leu423Pro | p.L423P | Q9Y2Z9 | protein_coding | deleterious(0) | possibly_damaging(0.516) | TCGA-AA-3956-01 | Colorectum | colon adenocarcinoma | Male | >=65 | I/II | Unknown | Unknown | SD |
| COQ6 | SNV | Missense_Mutation | rs765468843 | c.535N>T | p.Pro179Ser | p.P179S | Q9Y2Z9 | protein_coding | tolerated(0.29) | benign(0) | TCGA-AA-A00N-01 | Colorectum | colon adenocarcinoma | Male | >=65 | I/II | Unknown | Unknown | PD |
| Page: 1 2 3 4 5 |
Top |
Related drugs of malignant transformation related genes |
| Identification of chemicals and drugs interact with genes involved in malignant transfromation |
| (DGIdb 4.0) |
| Entrez ID | Symbol | Category | Interaction Types | Drug Claim Name | Drug Name | PMIDs |
| Page: 1 |

Copyright 2023-Present -The University of Texas Health Science Center at Houston |