
|
|||||
|
 | |
| |
| |
| |
| |
| |
|
Gene: COQ3 |
Gene summary for COQ3 |
| Gene information | Species | Human | Gene symbol | COQ3 | Gene ID | 51805 |
| Gene name | coenzyme Q3, methyltransferase | |
| Gene Alias | DHHBMT | |
| Cytomap | 6q16.2 | |
| Gene Type | protein-coding | GO ID | GO:0005975 | UniProtAcc | Q9NZJ6 |
Top |
Malignant transformation analysis |
| Identification of the aberrant gene expression in precancerous and cancerous lesions by comparing the gene expression of stem-like cells in diseased tissues with normal stem cells |
| Entrez ID | Symbol | Replicates | Species | Organ | Tissue | Adj P-value | Log2FC | Malignancy |
| 51805 | COQ3 | LZE24T | Human | Esophagus | ESCC | 7.65e-05 | 1.25e-01 | 0.0596 |
| 51805 | COQ3 | P2T-E | Human | Esophagus | ESCC | 7.52e-23 | 2.97e-01 | 0.1177 |
| 51805 | COQ3 | P4T-E | Human | Esophagus | ESCC | 1.01e-26 | 5.53e-01 | 0.1323 |
| 51805 | COQ3 | P5T-E | Human | Esophagus | ESCC | 4.40e-09 | 1.48e-01 | 0.1327 |
| 51805 | COQ3 | P8T-E | Human | Esophagus | ESCC | 2.03e-09 | 1.96e-01 | 0.0889 |
| 51805 | COQ3 | P9T-E | Human | Esophagus | ESCC | 3.05e-03 | 1.05e-01 | 0.1131 |
| 51805 | COQ3 | P10T-E | Human | Esophagus | ESCC | 9.35e-10 | 1.91e-01 | 0.116 |
| 51805 | COQ3 | P11T-E | Human | Esophagus | ESCC | 3.25e-05 | 2.05e-01 | 0.1426 |
| 51805 | COQ3 | P12T-E | Human | Esophagus | ESCC | 9.74e-22 | 3.35e-01 | 0.1122 |
| 51805 | COQ3 | P15T-E | Human | Esophagus | ESCC | 4.01e-11 | 2.72e-01 | 0.1149 |
| 51805 | COQ3 | P16T-E | Human | Esophagus | ESCC | 9.74e-22 | 3.57e-01 | 0.1153 |
| 51805 | COQ3 | P19T-E | Human | Esophagus | ESCC | 3.75e-07 | 4.46e-01 | 0.1662 |
| 51805 | COQ3 | P20T-E | Human | Esophagus | ESCC | 4.38e-08 | 1.79e-01 | 0.1124 |
| 51805 | COQ3 | P21T-E | Human | Esophagus | ESCC | 3.19e-23 | 5.01e-01 | 0.1617 |
| 51805 | COQ3 | P22T-E | Human | Esophagus | ESCC | 6.56e-15 | 2.63e-01 | 0.1236 |
| 51805 | COQ3 | P23T-E | Human | Esophagus | ESCC | 4.70e-20 | 4.32e-01 | 0.108 |
| 51805 | COQ3 | P24T-E | Human | Esophagus | ESCC | 1.97e-10 | 2.12e-01 | 0.1287 |
| 51805 | COQ3 | P26T-E | Human | Esophagus | ESCC | 5.30e-21 | 3.20e-01 | 0.1276 |
| 51805 | COQ3 | P27T-E | Human | Esophagus | ESCC | 5.68e-24 | 3.78e-01 | 0.1055 |
| 51805 | COQ3 | P28T-E | Human | Esophagus | ESCC | 3.52e-19 | 3.41e-01 | 0.1149 |
| Page: 1 2 3 4 |
| Tissue | Expression Dynamics | Abbreviation |
| Esophagus |  | ESCC: Esophageal squamous cell carcinoma |
| HGIN: High-grade intraepithelial neoplasias | ||
| LGIN: Low-grade intraepithelial neoplasias | ||
| Oral Cavity |  | EOLP: Erosive Oral lichen planus |
| LP: leukoplakia | ||
| NEOLP: Non-erosive oral lichen planus | ||
| OSCC: Oral squamous cell carcinoma | ||
| Skin | 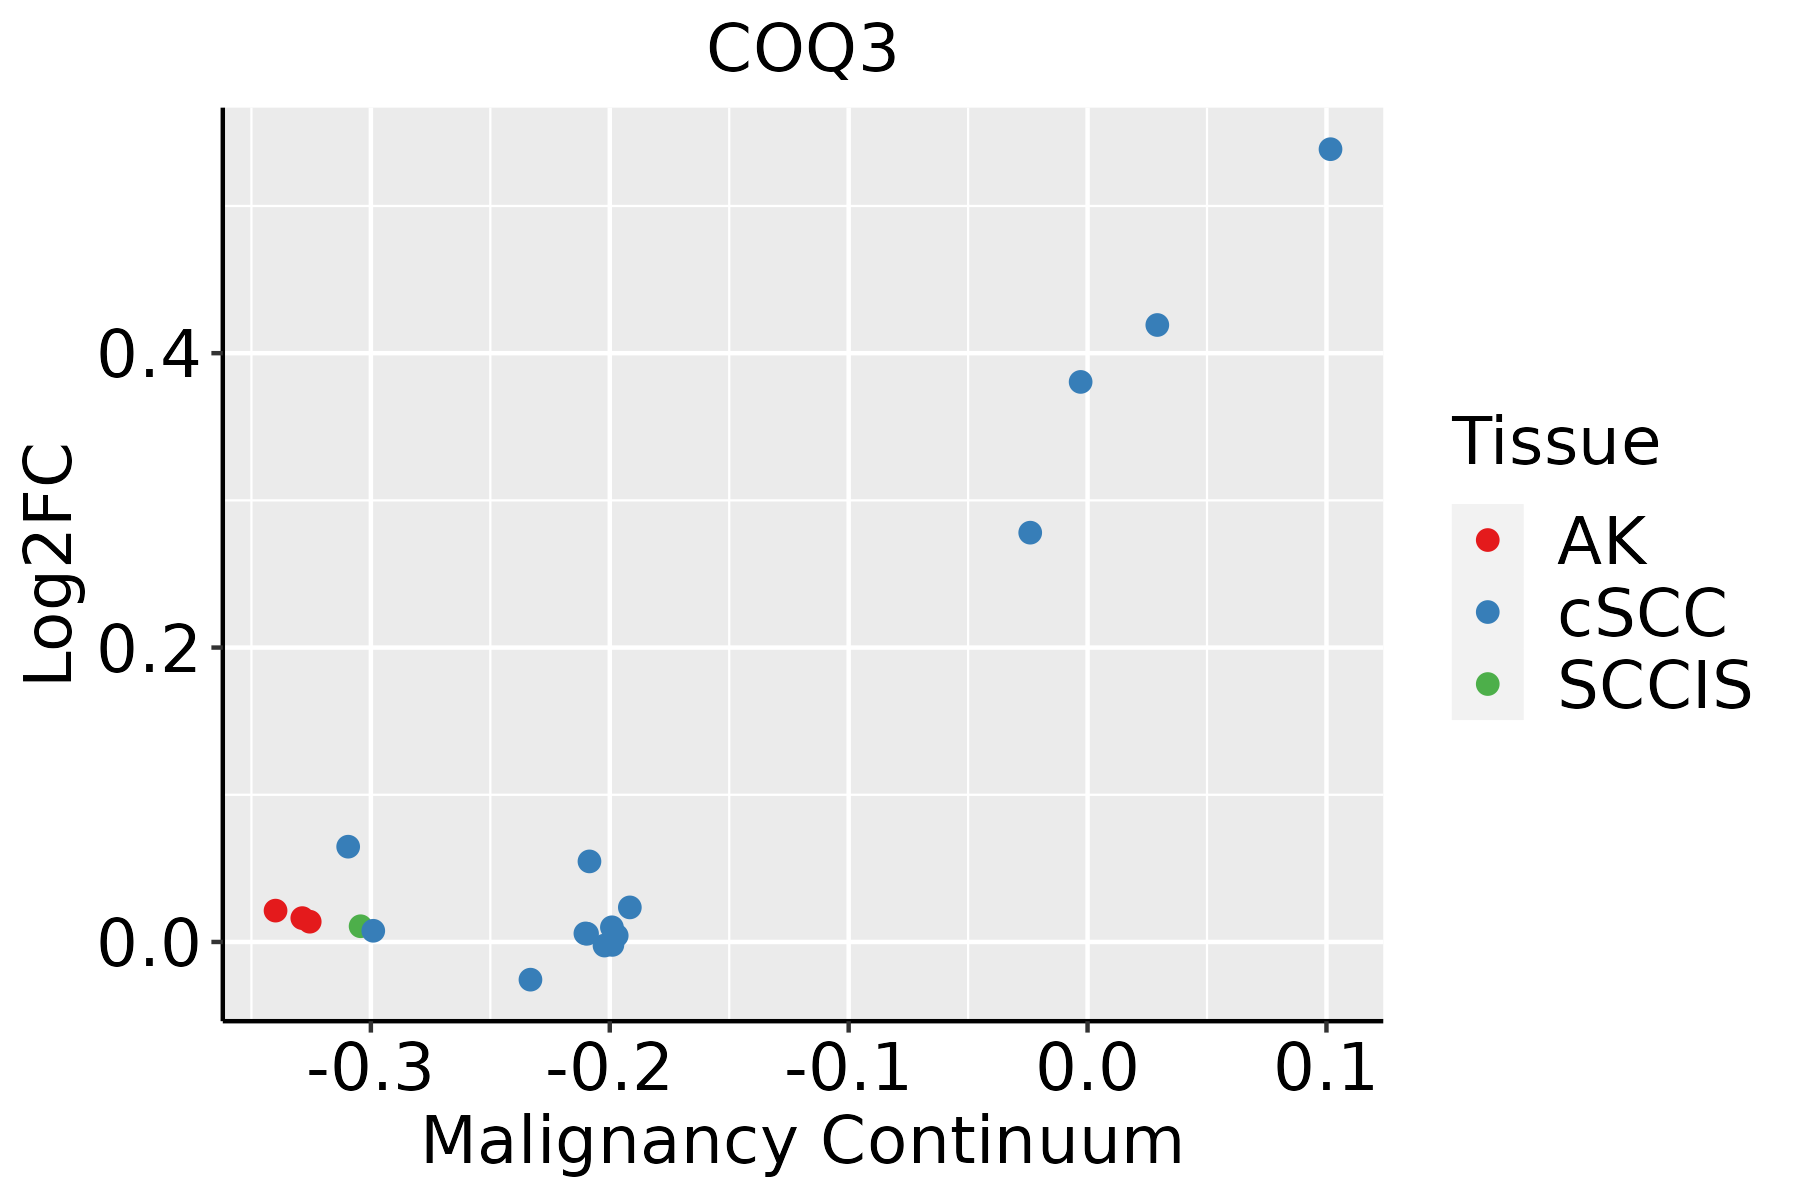 | AK: Actinic keratosis |
| cSCC: Cutaneous squamous cell carcinoma | ||
| SCCIS:squamous cell carcinoma in situ |
| ∗log2FC in expression of this searched gene in stem-like cells from each diseased tissue sample relative to stem-like cells in normal samples in each tissue plotted against the malignancy continuum. Samples are colored based on if they are from different disease stage. |
Top |
Malignant transformation related pathway analysis |
| Find out the enriched GO biological processes and KEGG pathways involved in transition from healthy to precancer to cancer |
| Tissue | Disease Stage | Enriched GO biological Processes |
| Colorectum | AD |  |
| Colorectum | SER |  |
| Colorectum | MSS |  |
| Colorectum | MSI-H |  |
| Colorectum | FAP |  |
| ∗Top 15 enriched GO BP terms are showed in the bar plot of each disease state in each tissue. Each row represents a significant GO biological process which is colored according to the -log10(p.adjust). |
| Page: 1 2 3 4 5 6 7 8 9 |
| GO ID | Tissue | Disease Stage | Description | Gene Ratio | Bg Ratio | pvalue | p.adjust | Count |
| GO:00322592 | Esophagus | ESCC | methylation | 222/8552 | 364/18723 | 2.26e-09 | 5.09e-08 | 222 |
| GO:190166112 | Esophagus | ESCC | quinone metabolic process | 34/8552 | 40/18723 | 3.00e-07 | 4.27e-06 | 34 |
| GO:00060668 | Esophagus | ESCC | alcohol metabolic process | 202/8552 | 353/18723 | 7.32e-06 | 7.26e-05 | 202 |
| GO:00067432 | Esophagus | ESCC | ubiquinone metabolic process | 17/8552 | 19/18723 | 9.02e-05 | 6.50e-04 | 17 |
| GO:00442626 | Esophagus | ESCC | cellular carbohydrate metabolic process | 160/8552 | 283/18723 | 1.43e-04 | 9.66e-04 | 160 |
| GO:00620129 | Esophagus | ESCC | regulation of small molecule metabolic process | 184/8552 | 334/18723 | 3.11e-04 | 1.85e-03 | 184 |
| GO:00067442 | Esophagus | ESCC | ubiquinone biosynthetic process | 15/8552 | 17/18723 | 3.48e-04 | 2.03e-03 | 15 |
| GO:19016632 | Esophagus | ESCC | quinone biosynthetic process | 15/8552 | 17/18723 | 3.48e-04 | 2.03e-03 | 15 |
| GO:00421805 | Esophagus | ESCC | cellular ketone metabolic process | 120/8552 | 211/18723 | 6.70e-04 | 3.55e-03 | 120 |
| GO:19016613 | Oral cavity | OSCC | quinone metabolic process | 32/7305 | 40/18723 | 1.40e-07 | 2.34e-06 | 32 |
| GO:00060667 | Oral cavity | OSCC | alcohol metabolic process | 179/7305 | 353/18723 | 4.54e-06 | 5.21e-05 | 179 |
| GO:00421804 | Oral cavity | OSCC | cellular ketone metabolic process | 111/7305 | 211/18723 | 3.94e-05 | 3.45e-04 | 111 |
| GO:0006743 | Oral cavity | OSCC | ubiquinone metabolic process | 16/7305 | 19/18723 | 7.05e-05 | 5.60e-04 | 16 |
| GO:0006744 | Oral cavity | OSCC | ubiquinone biosynthetic process | 14/7305 | 17/18723 | 3.31e-04 | 2.04e-03 | 14 |
| GO:1901663 | Oral cavity | OSCC | quinone biosynthetic process | 14/7305 | 17/18723 | 3.31e-04 | 2.04e-03 | 14 |
| GO:00322591 | Oral cavity | OSCC | methylation | 168/7305 | 364/18723 | 3.03e-03 | 1.31e-02 | 168 |
| GO:00620128 | Oral cavity | OSCC | regulation of small molecule metabolic process | 155/7305 | 334/18723 | 3.30e-03 | 1.41e-02 | 155 |
| GO:0042181 | Oral cavity | OSCC | ketone biosynthetic process | 26/7305 | 43/18723 | 3.55e-03 | 1.49e-02 | 26 |
| GO:00442625 | Oral cavity | OSCC | cellular carbohydrate metabolic process | 130/7305 | 283/18723 | 9.98e-03 | 3.49e-02 | 130 |
| GO:190166111 | Oral cavity | LP | quinone metabolic process | 24/4623 | 40/18723 | 2.17e-06 | 4.85e-05 | 24 |
| Page: 1 2 |
| Pathway ID | Tissue | Disease Stage | Description | Gene Ratio | Bg Ratio | pvalue | p.adjust | qvalue | Count |
| hsa012405 | Esophagus | ESCC | Biosynthesis of cofactors | 97/4205 | 153/8465 | 3.88e-04 | 1.35e-03 | 6.94e-04 | 97 |
| hsa0124012 | Esophagus | ESCC | Biosynthesis of cofactors | 97/4205 | 153/8465 | 3.88e-04 | 1.35e-03 | 6.94e-04 | 97 |
| hsa012404 | Oral cavity | OSCC | Biosynthesis of cofactors | 88/3704 | 153/8465 | 3.84e-04 | 1.20e-03 | 6.12e-04 | 88 |
| hsa00130 | Oral cavity | OSCC | Ubiquinone and other terpenoid-quinone biosynthesis | 9/3704 | 11/8465 | 1.19e-02 | 2.62e-02 | 1.33e-02 | 9 |
| hsa0124011 | Oral cavity | OSCC | Biosynthesis of cofactors | 88/3704 | 153/8465 | 3.84e-04 | 1.20e-03 | 6.12e-04 | 88 |
| hsa001301 | Oral cavity | OSCC | Ubiquinone and other terpenoid-quinone biosynthesis | 9/3704 | 11/8465 | 1.19e-02 | 2.62e-02 | 1.33e-02 | 9 |
| hsa0124021 | Oral cavity | LP | Biosynthesis of cofactors | 57/2418 | 153/8465 | 1.17e-02 | 3.91e-02 | 2.52e-02 | 57 |
| hsa0124031 | Oral cavity | LP | Biosynthesis of cofactors | 57/2418 | 153/8465 | 1.17e-02 | 3.91e-02 | 2.52e-02 | 57 |
| Page: 1 |
Top |
Cell-cell communication analysis |
| Identification of potential cell-cell interactions between two cell types and their ligand-receptor pairs for different disease states |
| Ligand | Receptor | LRpair | Pathway | Tissue | Disease Stage |
| Page: 1 |
Top |
Single-cell gene regulatory network inference analysis |
| Find out the significant the regulons (TFs) and the target genes of each regulon across cell types for different disease states |
| TF | Cell Type | Tissue | Disease Stage | Target Gene | RSS | Regulon Activity |
| ∗The dot plots of a searched regulon are shown for all cell subpopulations in each disease state of each tissue based on the regulon specific score inferred using pySCENIC and by calculating the average expression. |
| Page: 1 |
Top |
Somatic mutation of malignant transformation related genes |
| Annotation of somatic variants for genes involved in malignant transformation |
| Hugo Symbol | Variant Class | Variant Classification | dbSNP RS | HGVSc | HGVSp | HGVSp Short | SWISSPROT | BIOTYPE | SIFT | PolyPhen | Tumor Sample Barcode | Tissue | Histology | Sex | Age | Stage | Therapy Types | Drugs | Outcome |
| COQ3 | SNV | Missense_Mutation | rs867068545 | c.998C>T | p.Ser333Phe | p.S333F | Q9NZJ6 | protein_coding | tolerated(0.1) | possibly_damaging(0.547) | TCGA-BH-A0DZ-01 | Breast | breast invasive carcinoma | Female | <65 | I/II | Chemotherapy | docetaxel | SD |
| COQ3 | SNV | Missense_Mutation | c.34N>T | p.Gly12Cys | p.G12C | Q9NZJ6 | protein_coding | tolerated_low_confidence(0.15) | benign(0.001) | TCGA-D8-A1X9-01 | Breast | breast invasive carcinoma | Female | >=65 | I/II | Chemotherapy | adriamycin+cyclophosphamide | SD | |
| COQ3 | SNV | Missense_Mutation | c.1027N>A | p.Glu343Lys | p.E343K | Q9NZJ6 | protein_coding | deleterious_low_confidence(0.02) | benign(0.275) | TCGA-BI-A0VS-01 | Cervix | cervical & endocervical cancer | Female | <65 | I/II | Unknown | Unknown | SD | |
| COQ3 | insertion | Frame_Shift_Ins | novel | c.251dupT | p.Tyr85ValfsTer12 | p.Y85Vfs*12 | Q9NZJ6 | protein_coding | TCGA-EA-A5O9-01 | Cervix | cervical & endocervical cancer | Female | <65 | I/II | Unknown | Unknown | SD | ||
| COQ3 | SNV | Missense_Mutation | novel | c.590N>A | p.Arg197Lys | p.R197K | Q9NZJ6 | protein_coding | tolerated(0.13) | benign(0.147) | TCGA-AA-3861-01 | Colorectum | colon adenocarcinoma | Male | >=65 | I/II | Unknown | Unknown | SD |
| COQ3 | SNV | Missense_Mutation | c.808N>G | p.Ile270Val | p.I270V | Q9NZJ6 | protein_coding | tolerated(0.23) | benign(0.241) | TCGA-CK-4951-01 | Colorectum | colon adenocarcinoma | Female | >=65 | I/II | Unknown | Unknown | PD | |
| COQ3 | SNV | Missense_Mutation | c.883G>A | p.Glu295Lys | p.E295K | Q9NZJ6 | protein_coding | tolerated(0.07) | benign(0.417) | TCGA-D5-6922-01 | Colorectum | colon adenocarcinoma | Male | >=65 | III/IV | Unknown | Unknown | SD | |
| COQ3 | SNV | Missense_Mutation | rs375375802 | c.496N>T | p.Arg166Trp | p.R166W | Q9NZJ6 | protein_coding | deleterious(0) | probably_damaging(1) | TCGA-A5-A1OF-01 | Endometrium | uterine corpus endometrioid carcinoma | Female | <65 | I/II | Unknown | Unknown | SD |
| COQ3 | SNV | Missense_Mutation | c.653N>T | p.Ala218Val | p.A218V | Q9NZJ6 | protein_coding | tolerated(0.16) | possibly_damaging(0.759) | TCGA-AP-A051-01 | Endometrium | uterine corpus endometrioid carcinoma | Female | >=65 | I/II | Unknown | Unknown | SD | |
| COQ3 | SNV | Missense_Mutation | c.1104N>T | p.Lys368Asn | p.K368N | Q9NZJ6 | protein_coding | deleterious_low_confidence(0) | possibly_damaging(0.521) | TCGA-AP-A056-01 | Endometrium | uterine corpus endometrioid carcinoma | Female | <65 | I/II | Unknown | Unknown | SD |
| Page: 1 2 3 4 |
Top |
Related drugs of malignant transformation related genes |
| Identification of chemicals and drugs interact with genes involved in malignant transfromation |
| (DGIdb 4.0) |
| Entrez ID | Symbol | Category | Interaction Types | Drug Claim Name | Drug Name | PMIDs |
| Page: 1 |

Copyright 2023-Present -The University of Texas Health Science Center at Houston |