
|
|||||
|
 | |
| |
| |
| |
| |
| |
|
Gene: COQ2 |
Gene summary for COQ2 |
| Gene information | Species | Human | Gene symbol | COQ2 | Gene ID | 27235 |
| Gene name | coenzyme Q2, polyprenyltransferase | |
| Gene Alias | CL640 | |
| Cytomap | 4q21.23 | |
| Gene Type | protein-coding | GO ID | GO:0005975 | UniProtAcc | Q96H96 |
Top |
Malignant transformation analysis |
| Identification of the aberrant gene expression in precancerous and cancerous lesions by comparing the gene expression of stem-like cells in diseased tissues with normal stem cells |
| Entrez ID | Symbol | Replicates | Species | Organ | Tissue | Adj P-value | Log2FC | Malignancy |
| 27235 | COQ2 | LZE2T | Human | Esophagus | ESCC | 5.55e-04 | 4.40e-01 | 0.082 |
| 27235 | COQ2 | LZE4T | Human | Esophagus | ESCC | 1.80e-02 | 8.41e-02 | 0.0811 |
| 27235 | COQ2 | LZE24T | Human | Esophagus | ESCC | 2.99e-06 | 2.53e-01 | 0.0596 |
| 27235 | COQ2 | LZE21T | Human | Esophagus | ESCC | 3.77e-02 | 1.56e-01 | 0.0655 |
| 27235 | COQ2 | P1T-E | Human | Esophagus | ESCC | 1.08e-02 | 1.77e-01 | 0.0875 |
| 27235 | COQ2 | P2T-E | Human | Esophagus | ESCC | 4.98e-13 | 2.29e-01 | 0.1177 |
| 27235 | COQ2 | P4T-E | Human | Esophagus | ESCC | 7.07e-24 | 5.34e-01 | 0.1323 |
| 27235 | COQ2 | P5T-E | Human | Esophagus | ESCC | 1.02e-05 | 1.74e-01 | 0.1327 |
| 27235 | COQ2 | P8T-E | Human | Esophagus | ESCC | 3.36e-13 | 1.98e-01 | 0.0889 |
| 27235 | COQ2 | P9T-E | Human | Esophagus | ESCC | 6.33e-11 | 2.46e-01 | 0.1131 |
| 27235 | COQ2 | P10T-E | Human | Esophagus | ESCC | 2.07e-13 | 2.82e-01 | 0.116 |
| 27235 | COQ2 | P11T-E | Human | Esophagus | ESCC | 1.94e-04 | 3.76e-01 | 0.1426 |
| 27235 | COQ2 | P12T-E | Human | Esophagus | ESCC | 2.98e-27 | 4.62e-01 | 0.1122 |
| 27235 | COQ2 | P15T-E | Human | Esophagus | ESCC | 5.72e-24 | 5.26e-01 | 0.1149 |
| 27235 | COQ2 | P16T-E | Human | Esophagus | ESCC | 2.27e-15 | 1.49e-01 | 0.1153 |
| 27235 | COQ2 | P17T-E | Human | Esophagus | ESCC | 9.82e-03 | 2.43e-01 | 0.1278 |
| 27235 | COQ2 | P19T-E | Human | Esophagus | ESCC | 9.96e-06 | 2.88e-01 | 0.1662 |
| 27235 | COQ2 | P20T-E | Human | Esophagus | ESCC | 2.42e-02 | 1.20e-01 | 0.1124 |
| 27235 | COQ2 | P21T-E | Human | Esophagus | ESCC | 7.83e-22 | 4.75e-01 | 0.1617 |
| 27235 | COQ2 | P22T-E | Human | Esophagus | ESCC | 2.73e-07 | 1.02e-01 | 0.1236 |
| Page: 1 2 3 4 5 |
| Tissue | Expression Dynamics | Abbreviation |
| Esophagus |  | ESCC: Esophageal squamous cell carcinoma |
| HGIN: High-grade intraepithelial neoplasias | ||
| LGIN: Low-grade intraepithelial neoplasias | ||
| Liver | 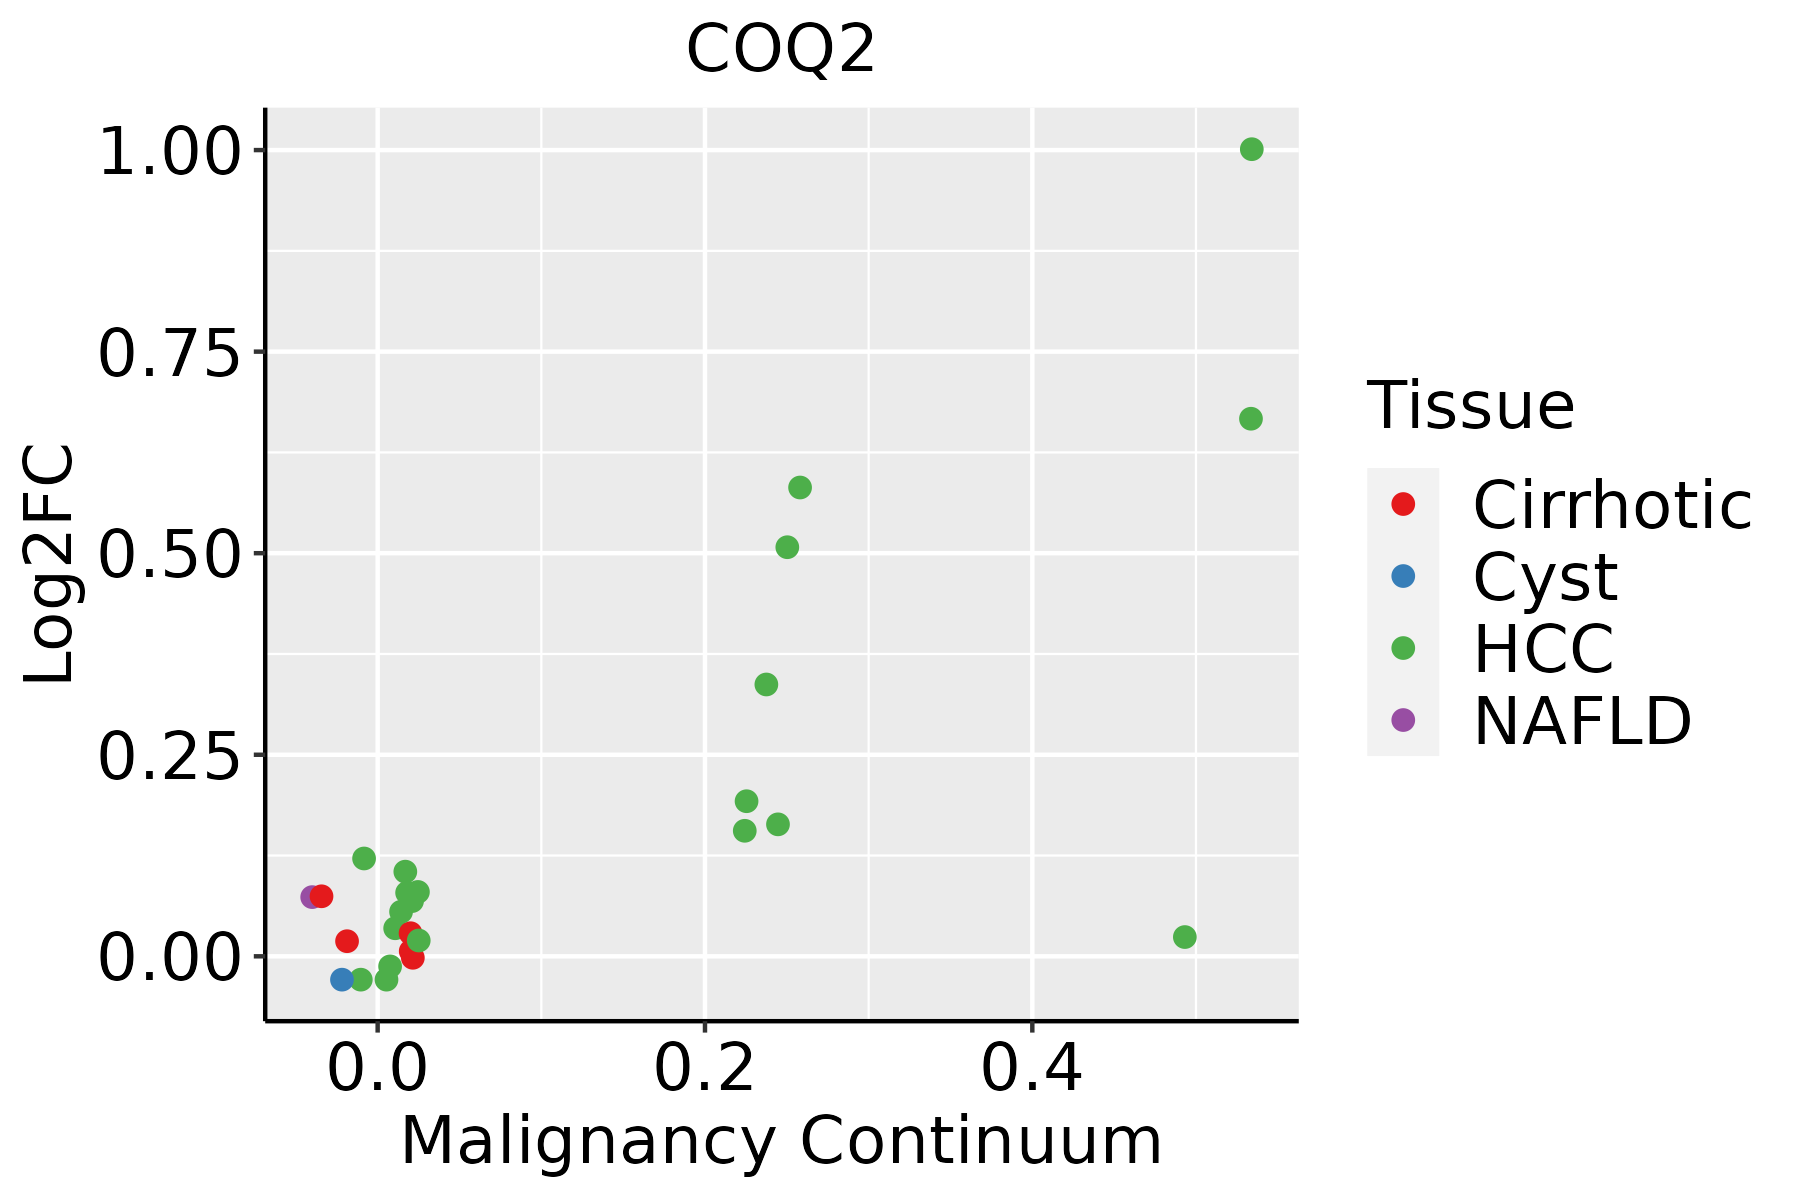 | HCC: Hepatocellular carcinoma |
| NAFLD: Non-alcoholic fatty liver disease | ||
| Oral Cavity | 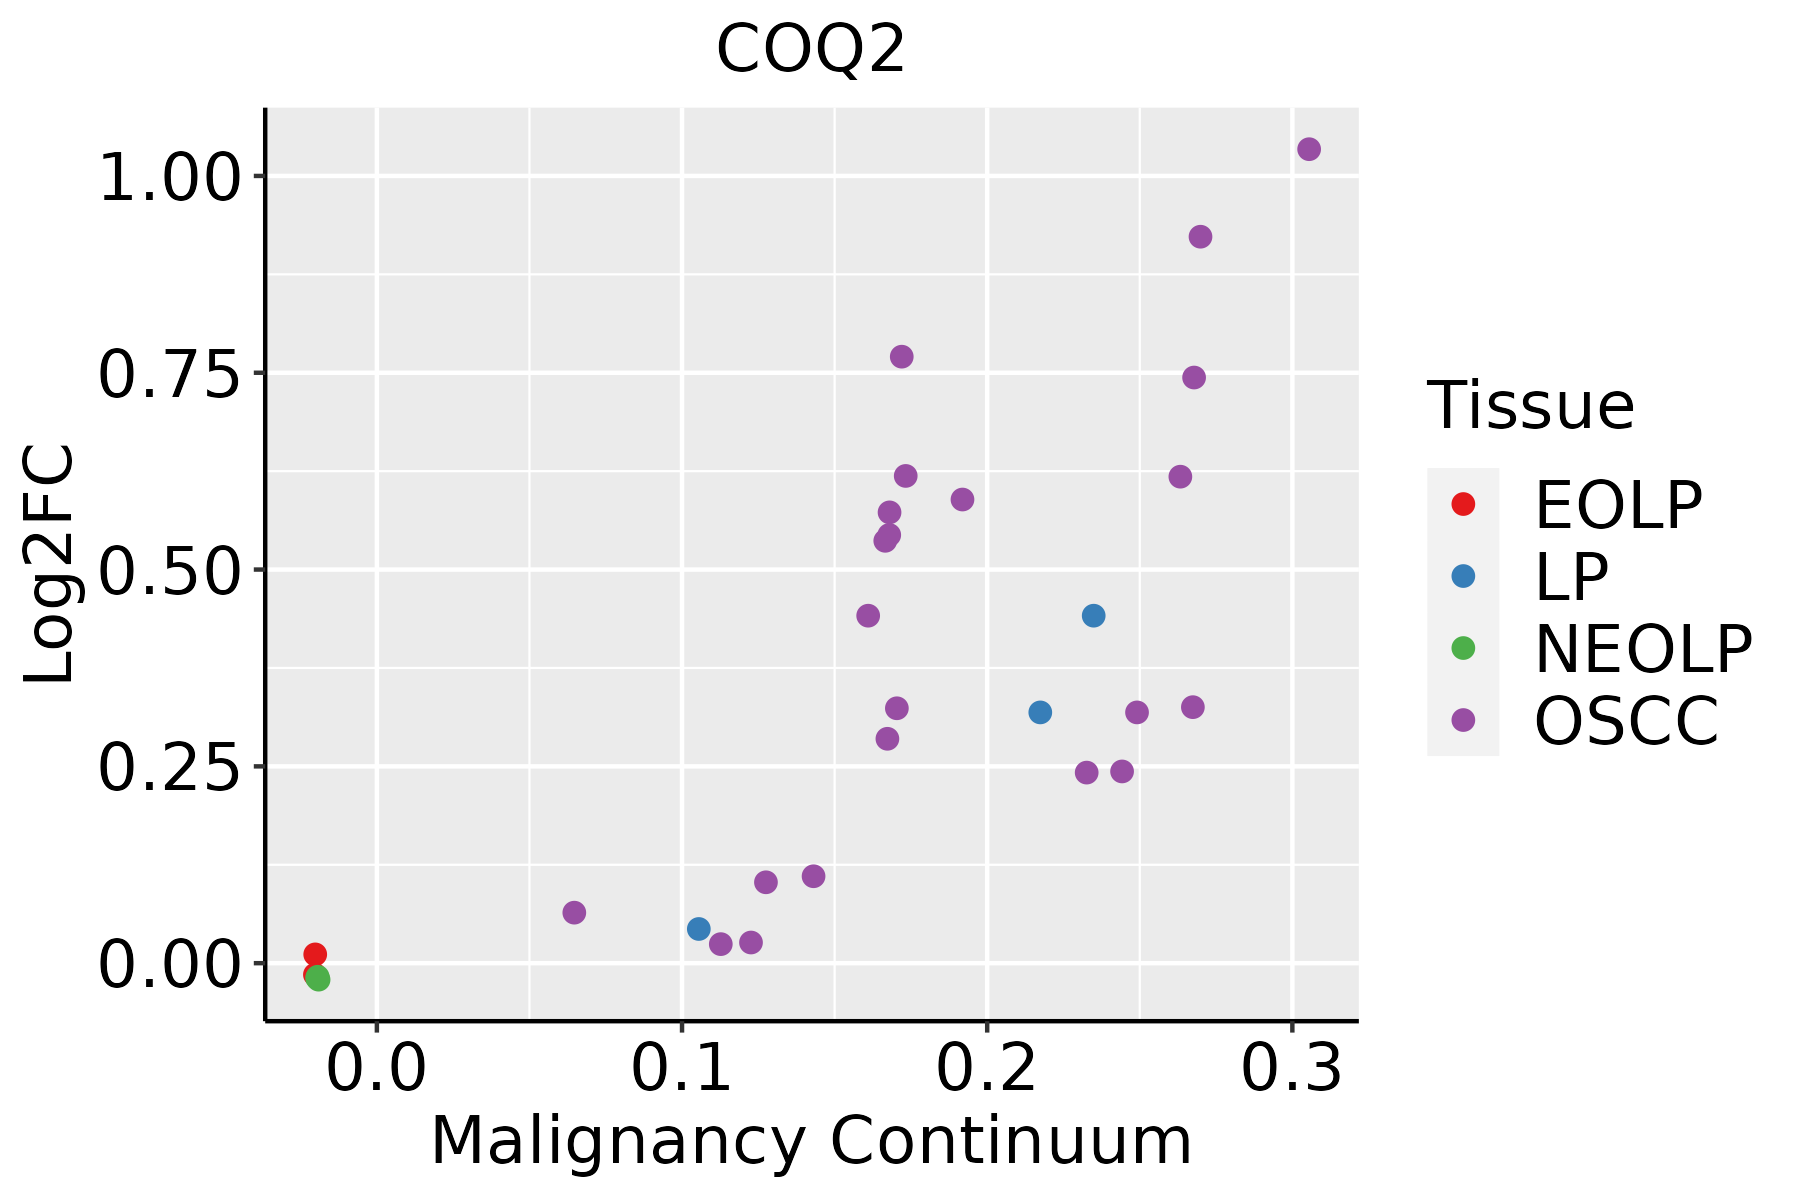 | EOLP: Erosive Oral lichen planus |
| LP: leukoplakia | ||
| NEOLP: Non-erosive oral lichen planus | ||
| OSCC: Oral squamous cell carcinoma | ||
| Skin | 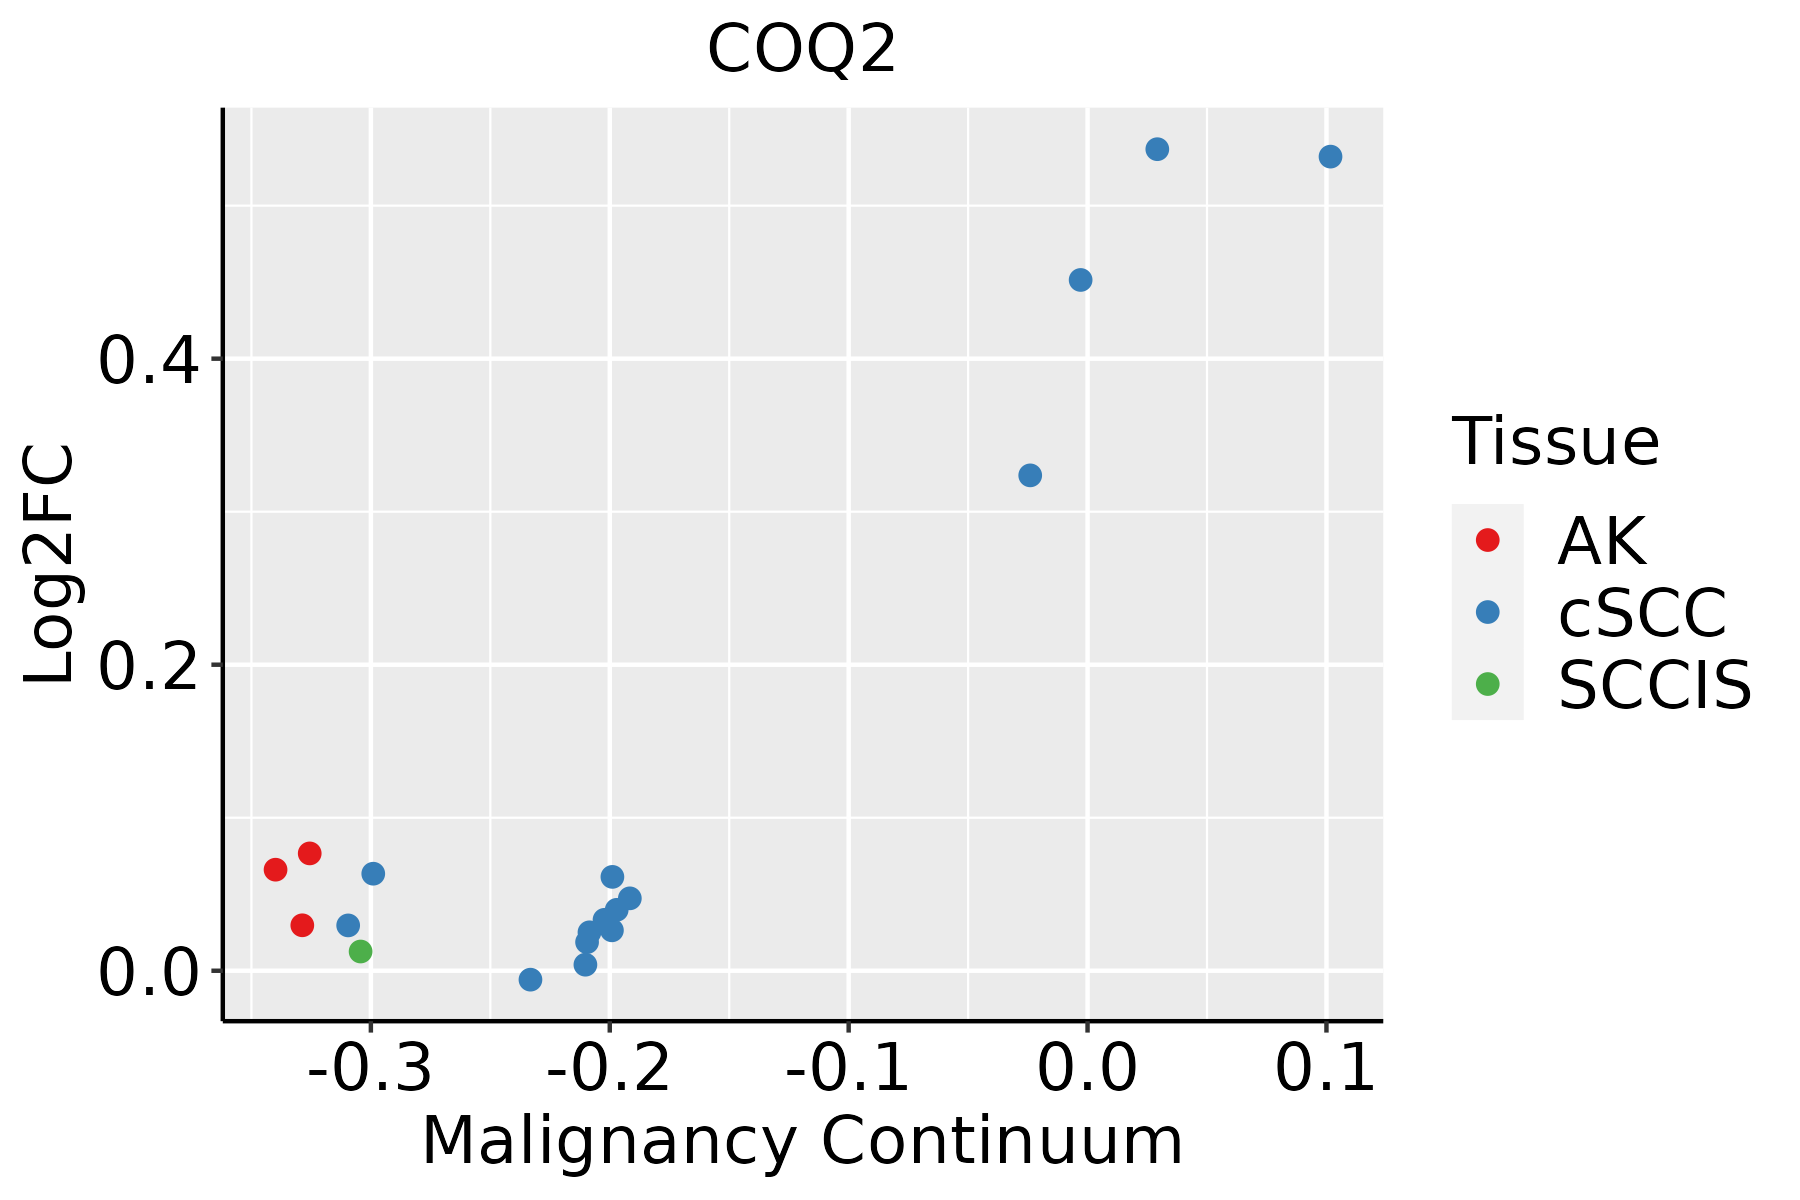 | AK: Actinic keratosis |
| cSCC: Cutaneous squamous cell carcinoma | ||
| SCCIS:squamous cell carcinoma in situ |
| ∗log2FC in expression of this searched gene in stem-like cells from each diseased tissue sample relative to stem-like cells in normal samples in each tissue plotted against the malignancy continuum. Samples are colored based on if they are from different disease stage. |
Top |
Malignant transformation related pathway analysis |
| Find out the enriched GO biological processes and KEGG pathways involved in transition from healthy to precancer to cancer |
| Tissue | Disease Stage | Enriched GO biological Processes |
| Colorectum | AD |  |
| Colorectum | SER |  |
| Colorectum | MSS |  |
| Colorectum | MSI-H |  |
| Colorectum | FAP |  |
| ∗Top 15 enriched GO BP terms are showed in the bar plot of each disease state in each tissue. Each row represents a significant GO biological process which is colored according to the -log10(p.adjust). |
| Page: 1 2 3 4 5 6 7 8 9 |
| GO ID | Tissue | Disease Stage | Description | Gene Ratio | Bg Ratio | pvalue | p.adjust | Count |
| GO:190166112 | Esophagus | ESCC | quinone metabolic process | 34/8552 | 40/18723 | 3.00e-07 | 4.27e-06 | 34 |
| GO:00060668 | Esophagus | ESCC | alcohol metabolic process | 202/8552 | 353/18723 | 7.32e-06 | 7.26e-05 | 202 |
| GO:00067432 | Esophagus | ESCC | ubiquinone metabolic process | 17/8552 | 19/18723 | 9.02e-05 | 6.50e-04 | 17 |
| GO:00442626 | Esophagus | ESCC | cellular carbohydrate metabolic process | 160/8552 | 283/18723 | 1.43e-04 | 9.66e-04 | 160 |
| GO:00067442 | Esophagus | ESCC | ubiquinone biosynthetic process | 15/8552 | 17/18723 | 3.48e-04 | 2.03e-03 | 15 |
| GO:19016632 | Esophagus | ESCC | quinone biosynthetic process | 15/8552 | 17/18723 | 3.48e-04 | 2.03e-03 | 15 |
| GO:00421805 | Esophagus | ESCC | cellular ketone metabolic process | 120/8552 | 211/18723 | 6.70e-04 | 3.55e-03 | 120 |
| GO:00082991 | Esophagus | ESCC | isoprenoid biosynthetic process | 21/8552 | 28/18723 | 1.57e-03 | 7.33e-03 | 21 |
| GO:000606621 | Liver | HCC | alcohol metabolic process | 208/7958 | 353/18723 | 2.80e-10 | 9.50e-09 | 208 |
| GO:004218021 | Liver | HCC | cellular ketone metabolic process | 123/7958 | 211/18723 | 2.52e-06 | 3.37e-05 | 123 |
| GO:004426221 | Liver | HCC | cellular carbohydrate metabolic process | 153/7958 | 283/18723 | 5.27e-05 | 5.00e-04 | 153 |
| GO:000672011 | Liver | HCC | isoprenoid metabolic process | 65/7958 | 116/18723 | 2.23e-03 | 1.11e-02 | 65 |
| GO:19016611 | Liver | HCC | quinone metabolic process | 26/7958 | 40/18723 | 3.40e-03 | 1.55e-02 | 26 |
| GO:19016613 | Oral cavity | OSCC | quinone metabolic process | 32/7305 | 40/18723 | 1.40e-07 | 2.34e-06 | 32 |
| GO:00060667 | Oral cavity | OSCC | alcohol metabolic process | 179/7305 | 353/18723 | 4.54e-06 | 5.21e-05 | 179 |
| GO:00421804 | Oral cavity | OSCC | cellular ketone metabolic process | 111/7305 | 211/18723 | 3.94e-05 | 3.45e-04 | 111 |
| GO:0006743 | Oral cavity | OSCC | ubiquinone metabolic process | 16/7305 | 19/18723 | 7.05e-05 | 5.60e-04 | 16 |
| GO:0006744 | Oral cavity | OSCC | ubiquinone biosynthetic process | 14/7305 | 17/18723 | 3.31e-04 | 2.04e-03 | 14 |
| GO:1901663 | Oral cavity | OSCC | quinone biosynthetic process | 14/7305 | 17/18723 | 3.31e-04 | 2.04e-03 | 14 |
| GO:0008299 | Oral cavity | OSCC | isoprenoid biosynthetic process | 20/7305 | 28/18723 | 5.13e-04 | 2.99e-03 | 20 |
| Page: 1 2 |
| Pathway ID | Tissue | Disease Stage | Description | Gene Ratio | Bg Ratio | pvalue | p.adjust | qvalue | Count |
| hsa012405 | Esophagus | ESCC | Biosynthesis of cofactors | 97/4205 | 153/8465 | 3.88e-04 | 1.35e-03 | 6.94e-04 | 97 |
| hsa0124012 | Esophagus | ESCC | Biosynthesis of cofactors | 97/4205 | 153/8465 | 3.88e-04 | 1.35e-03 | 6.94e-04 | 97 |
| hsa012402 | Liver | HCC | Biosynthesis of cofactors | 103/4020 | 153/8465 | 4.67e-07 | 5.05e-06 | 2.81e-06 | 103 |
| hsa012403 | Liver | HCC | Biosynthesis of cofactors | 103/4020 | 153/8465 | 4.67e-07 | 5.05e-06 | 2.81e-06 | 103 |
| hsa012404 | Oral cavity | OSCC | Biosynthesis of cofactors | 88/3704 | 153/8465 | 3.84e-04 | 1.20e-03 | 6.12e-04 | 88 |
| hsa0124011 | Oral cavity | OSCC | Biosynthesis of cofactors | 88/3704 | 153/8465 | 3.84e-04 | 1.20e-03 | 6.12e-04 | 88 |
| hsa0124021 | Oral cavity | LP | Biosynthesis of cofactors | 57/2418 | 153/8465 | 1.17e-02 | 3.91e-02 | 2.52e-02 | 57 |
| hsa0124031 | Oral cavity | LP | Biosynthesis of cofactors | 57/2418 | 153/8465 | 1.17e-02 | 3.91e-02 | 2.52e-02 | 57 |
| Page: 1 |
Top |
Cell-cell communication analysis |
| Identification of potential cell-cell interactions between two cell types and their ligand-receptor pairs for different disease states |
| Ligand | Receptor | LRpair | Pathway | Tissue | Disease Stage |
| Page: 1 |
Top |
Single-cell gene regulatory network inference analysis |
| Find out the significant the regulons (TFs) and the target genes of each regulon across cell types for different disease states |
| TF | Cell Type | Tissue | Disease Stage | Target Gene | RSS | Regulon Activity |
| ∗The dot plots of a searched regulon are shown for all cell subpopulations in each disease state of each tissue based on the regulon specific score inferred using pySCENIC and by calculating the average expression. |
| Page: 1 |
Top |
Somatic mutation of malignant transformation related genes |
| Annotation of somatic variants for genes involved in malignant transformation |
| Hugo Symbol | Variant Class | Variant Classification | dbSNP RS | HGVSc | HGVSp | HGVSp Short | SWISSPROT | BIOTYPE | SIFT | PolyPhen | Tumor Sample Barcode | Tissue | Histology | Sex | Age | Stage | Therapy Types | Drugs | Outcome |
| COQ2 | SNV | Missense_Mutation | novel | c.749N>C | p.Arg250Thr | p.R250T | Q96H96 | protein_coding | deleterious(0) | probably_damaging(1) | TCGA-C8-A8HP-01 | Breast | breast invasive carcinoma | Female | <65 | III/IV | Chemotherapy | 5-fluorouracil | CR |
| COQ2 | SNV | Missense_Mutation | c.1067C>T | p.Ala356Val | p.A356V | Q96H96 | protein_coding | tolerated(0.05) | possibly_damaging(0.614) | TCGA-A6-5665-01 | Colorectum | colon adenocarcinoma | Female | >=65 | I/II | Unknown | Unknown | PD | |
| COQ2 | SNV | Missense_Mutation | c.682N>C | p.Asn228His | p.N228H | Q96H96 | protein_coding | deleterious(0.01) | probably_damaging(1) | TCGA-AA-3693-01 | Colorectum | colon adenocarcinoma | Female | >=65 | III/IV | Unknown | Unknown | SD | |
| COQ2 | SNV | Missense_Mutation | c.484N>T | p.Leu162Phe | p.L162F | Q96H96 | protein_coding | deleterious(0.02) | possibly_damaging(0.799) | TCGA-AA-3715-01 | Colorectum | colon adenocarcinoma | Male | >=65 | I/II | Unknown | Unknown | PD | |
| COQ2 | SNV | Missense_Mutation | c.532N>G | p.Thr178Ala | p.T178A | Q96H96 | protein_coding | deleterious(0.03) | possibly_damaging(0.615) | TCGA-AZ-4614-01 | Colorectum | colon adenocarcinoma | Female | >=65 | I/II | Unknown | Unknown | PD | |
| COQ2 | SNV | Missense_Mutation | rs758103492 | c.517N>T | p.Arg173Cys | p.R173C | Q96H96 | protein_coding | deleterious(0) | probably_damaging(0.997) | TCGA-CK-4951-01 | Colorectum | colon adenocarcinoma | Female | >=65 | I/II | Unknown | Unknown | PD |
| COQ2 | SNV | Missense_Mutation | c.1081N>A | p.Gly361Arg | p.G361R | Q96H96 | protein_coding | deleterious(0.01) | benign(0.077) | TCGA-DM-A28F-01 | Colorectum | colon adenocarcinoma | Male | >=65 | III/IV | Unknown | Unknown | SD | |
| COQ2 | SNV | Missense_Mutation | c.1141N>G | p.Asn381Asp | p.N381D | Q96H96 | protein_coding | tolerated(0.53) | benign(0) | TCGA-AG-A002-01 | Colorectum | rectum adenocarcinoma | Male | <65 | I/II | Unknown | Unknown | SD | |
| COQ2 | insertion | Frame_Shift_Ins | novel | c.8dupC | p.Ile4AsnfsTer89 | p.I4Nfs*89 | Q96H96 | protein_coding | TCGA-5M-AAT6-01 | Colorectum | colon adenocarcinoma | Female | <65 | III/IV | Unknown | Unknown | PD | ||
| COQ2 | SNV | Missense_Mutation | novel | c.1165C>G | p.Leu389Val | p.L389V | Q96H96 | protein_coding | tolerated(0.83) | benign(0.006) | TCGA-A5-A0G2-01 | Endometrium | uterine corpus endometrioid carcinoma | Female | <65 | III/IV | Unknown | Unknown | SD |
| Page: 1 2 3 |
Top |
Related drugs of malignant transformation related genes |
| Identification of chemicals and drugs interact with genes involved in malignant transfromation |
| (DGIdb 4.0) |
| Entrez ID | Symbol | Category | Interaction Types | Drug Claim Name | Drug Name | PMIDs |
| 27235 | COQ2 | ENZYME | atorvastatin | ATORVASTATIN | 20347093 | |
| 27235 | COQ2 | ENZYME | hmg coa reductase inhibitors | 20347093 | ||
| 27235 | COQ2 | ENZYME | rosuvastatin | ROSUVASTATIN | 20347093 |
| Page: 1 |

Copyright 2023-Present -The University of Texas Health Science Center at Houston |