
|
|||||
|
 | |
| |
| |
| |
| |
| |
|
Gene: COQ10A |
Gene summary for COQ10A |
| Gene information | Species | Human | Gene symbol | COQ10A | Gene ID | 93058 |
| Gene name | coenzyme Q10A | |
| Gene Alias | COQ10A | |
| Cytomap | 12q13.3 | |
| Gene Type | protein-coding | GO ID | GO:0006091 | UniProtAcc | Q96MF6 |
Top |
Malignant transformation analysis |
| Identification of the aberrant gene expression in precancerous and cancerous lesions by comparing the gene expression of stem-like cells in diseased tissues with normal stem cells |
| Entrez ID | Symbol | Replicates | Species | Organ | Tissue | Adj P-value | Log2FC | Malignancy |
| 93058 | COQ10A | LZE24T | Human | Esophagus | ESCC | 7.20e-09 | 2.57e-01 | 0.0596 |
| 93058 | COQ10A | P2T-E | Human | Esophagus | ESCC | 6.17e-25 | 3.91e-01 | 0.1177 |
| 93058 | COQ10A | P4T-E | Human | Esophagus | ESCC | 5.82e-11 | 2.38e-01 | 0.1323 |
| 93058 | COQ10A | P8T-E | Human | Esophagus | ESCC | 3.83e-08 | 1.53e-01 | 0.0889 |
| 93058 | COQ10A | P9T-E | Human | Esophagus | ESCC | 1.70e-03 | 1.14e-01 | 0.1131 |
| 93058 | COQ10A | P10T-E | Human | Esophagus | ESCC | 8.22e-12 | 2.02e-01 | 0.116 |
| 93058 | COQ10A | P11T-E | Human | Esophagus | ESCC | 1.01e-05 | 2.52e-01 | 0.1426 |
| 93058 | COQ10A | P12T-E | Human | Esophagus | ESCC | 1.43e-13 | 1.91e-01 | 0.1122 |
| 93058 | COQ10A | P16T-E | Human | Esophagus | ESCC | 3.82e-13 | 1.57e-01 | 0.1153 |
| 93058 | COQ10A | P22T-E | Human | Esophagus | ESCC | 9.89e-14 | 2.36e-01 | 0.1236 |
| 93058 | COQ10A | P23T-E | Human | Esophagus | ESCC | 5.19e-08 | 1.79e-01 | 0.108 |
| 93058 | COQ10A | P24T-E | Human | Esophagus | ESCC | 2.13e-05 | 1.08e-01 | 0.1287 |
| 93058 | COQ10A | P26T-E | Human | Esophagus | ESCC | 4.90e-10 | 1.80e-01 | 0.1276 |
| 93058 | COQ10A | P27T-E | Human | Esophagus | ESCC | 1.31e-10 | 2.13e-01 | 0.1055 |
| 93058 | COQ10A | P28T-E | Human | Esophagus | ESCC | 1.34e-05 | 9.17e-02 | 0.1149 |
| 93058 | COQ10A | P31T-E | Human | Esophagus | ESCC | 9.24e-06 | 1.21e-01 | 0.1251 |
| 93058 | COQ10A | P32T-E | Human | Esophagus | ESCC | 2.79e-08 | 1.10e-01 | 0.1666 |
| 93058 | COQ10A | P36T-E | Human | Esophagus | ESCC | 3.11e-12 | 2.73e-01 | 0.1187 |
| 93058 | COQ10A | P37T-E | Human | Esophagus | ESCC | 2.37e-03 | 1.00e-01 | 0.1371 |
| 93058 | COQ10A | P39T-E | Human | Esophagus | ESCC | 4.88e-02 | 3.54e-02 | 0.0894 |
| Page: 1 2 3 |
| Tissue | Expression Dynamics | Abbreviation |
| Esophagus | 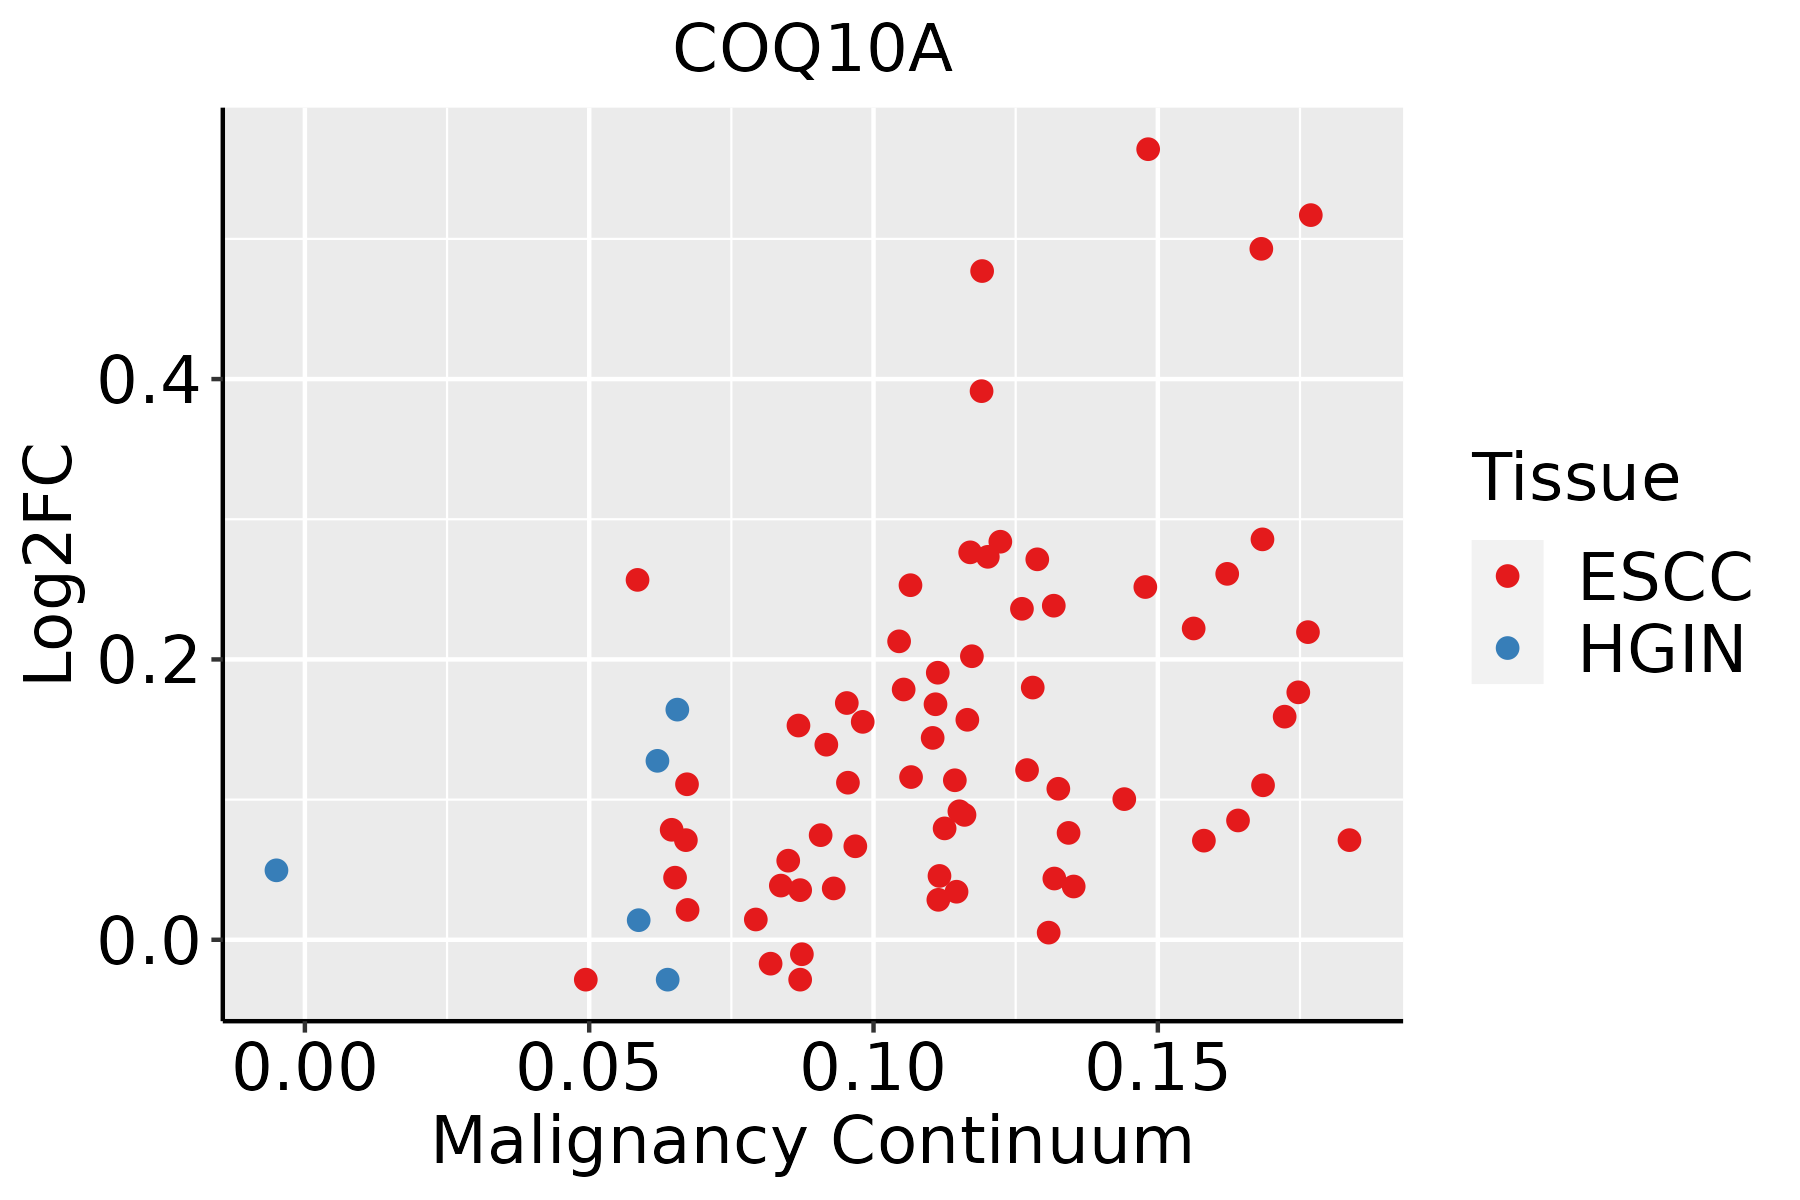 | ESCC: Esophageal squamous cell carcinoma |
| HGIN: High-grade intraepithelial neoplasias | ||
| LGIN: Low-grade intraepithelial neoplasias | ||
| Liver | 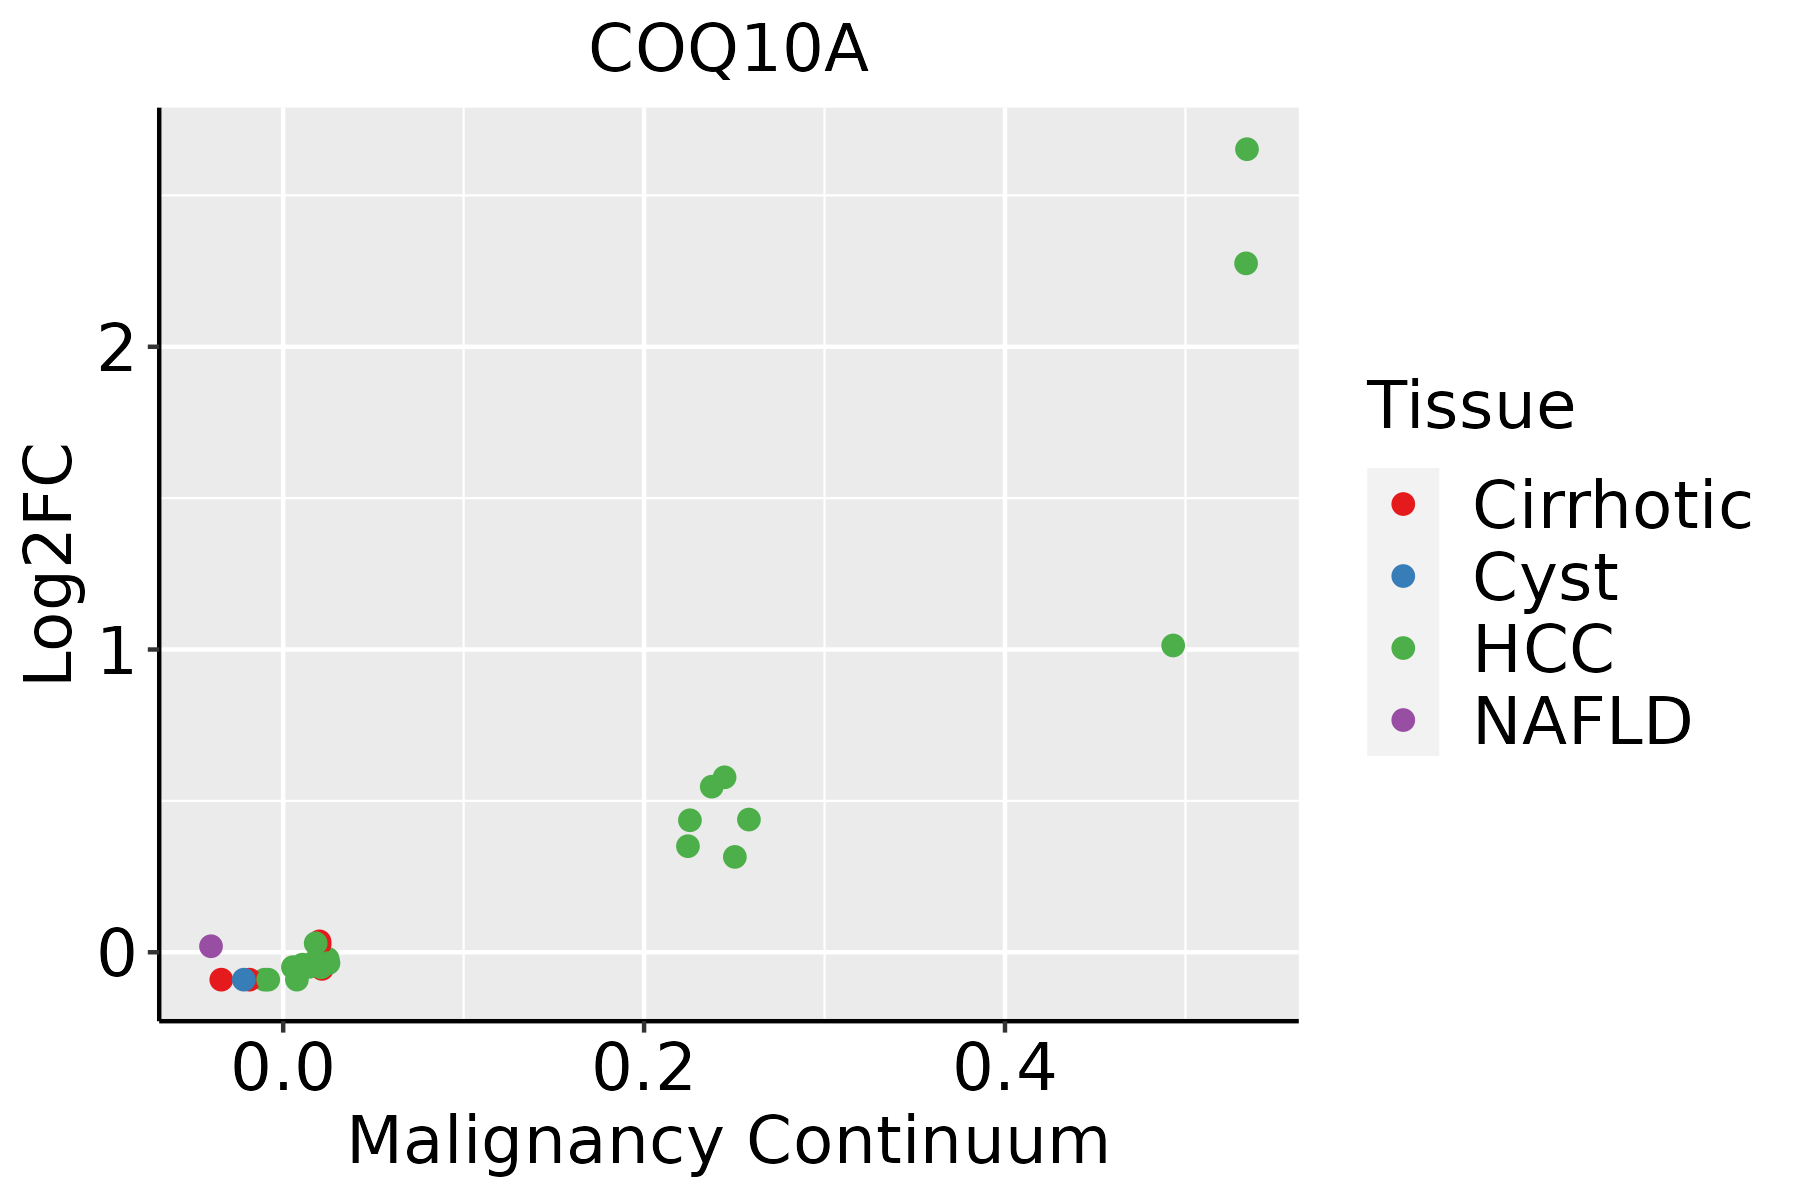 | HCC: Hepatocellular carcinoma |
| NAFLD: Non-alcoholic fatty liver disease |
| ∗log2FC in expression of this searched gene in stem-like cells from each diseased tissue sample relative to stem-like cells in normal samples in each tissue plotted against the malignancy continuum. Samples are colored based on if they are from different disease stage. |
Top |
Malignant transformation related pathway analysis |
| Find out the enriched GO biological processes and KEGG pathways involved in transition from healthy to precancer to cancer |
| Tissue | Disease Stage | Enriched GO biological Processes |
| Colorectum | AD |  |
| Colorectum | SER |  |
| Colorectum | MSS |  |
| Colorectum | MSI-H |  |
| Colorectum | FAP |  |
| ∗Top 15 enriched GO BP terms are showed in the bar plot of each disease state in each tissue. Each row represents a significant GO biological process which is colored according to the -log10(p.adjust). |
| Page: 1 2 3 4 5 6 7 8 9 |
| GO ID | Tissue | Disease Stage | Description | Gene Ratio | Bg Ratio | pvalue | p.adjust | Count |
| GO:0006091110 | Esophagus | ESCC | generation of precursor metabolites and energy | 331/8552 | 490/18723 | 3.86e-23 | 8.45e-21 | 331 |
| GO:0045333110 | Esophagus | ESCC | cellular respiration | 173/8552 | 230/18723 | 4.53e-20 | 5.99e-18 | 173 |
| GO:0015980110 | Esophagus | ESCC | energy derivation by oxidation of organic compounds | 220/8552 | 318/18723 | 1.20e-17 | 1.09e-15 | 220 |
| GO:190166112 | Esophagus | ESCC | quinone metabolic process | 34/8552 | 40/18723 | 3.00e-07 | 4.27e-06 | 34 |
| GO:00067432 | Esophagus | ESCC | ubiquinone metabolic process | 17/8552 | 19/18723 | 9.02e-05 | 6.50e-04 | 17 |
| GO:00067442 | Esophagus | ESCC | ubiquinone biosynthetic process | 15/8552 | 17/18723 | 3.48e-04 | 2.03e-03 | 15 |
| GO:19016632 | Esophagus | ESCC | quinone biosynthetic process | 15/8552 | 17/18723 | 3.48e-04 | 2.03e-03 | 15 |
| GO:00421805 | Esophagus | ESCC | cellular ketone metabolic process | 120/8552 | 211/18723 | 6.70e-04 | 3.55e-03 | 120 |
| GO:000609122 | Liver | HCC | generation of precursor metabolites and energy | 340/7958 | 490/18723 | 4.04e-34 | 2.85e-31 | 340 |
| GO:004533312 | Liver | HCC | cellular respiration | 171/7958 | 230/18723 | 6.35e-23 | 1.26e-20 | 171 |
| GO:001598022 | Liver | HCC | energy derivation by oxidation of organic compounds | 221/7958 | 318/18723 | 1.02e-22 | 1.86e-20 | 221 |
| GO:004218021 | Liver | HCC | cellular ketone metabolic process | 123/7958 | 211/18723 | 2.52e-06 | 3.37e-05 | 123 |
| GO:19016611 | Liver | HCC | quinone metabolic process | 26/7958 | 40/18723 | 3.40e-03 | 1.55e-02 | 26 |
| Page: 1 |
| Pathway ID | Tissue | Disease Stage | Description | Gene Ratio | Bg Ratio | pvalue | p.adjust | qvalue | Count |
| Page: 1 |
Top |
Cell-cell communication analysis |
| Identification of potential cell-cell interactions between two cell types and their ligand-receptor pairs for different disease states |
| Ligand | Receptor | LRpair | Pathway | Tissue | Disease Stage |
| Page: 1 |
Top |
Single-cell gene regulatory network inference analysis |
| Find out the significant the regulons (TFs) and the target genes of each regulon across cell types for different disease states |
| TF | Cell Type | Tissue | Disease Stage | Target Gene | RSS | Regulon Activity |
| ∗The dot plots of a searched regulon are shown for all cell subpopulations in each disease state of each tissue based on the regulon specific score inferred using pySCENIC and by calculating the average expression. |
| Page: 1 |
Top |
Somatic mutation of malignant transformation related genes |
| Annotation of somatic variants for genes involved in malignant transformation |
| Hugo Symbol | Variant Class | Variant Classification | dbSNP RS | HGVSc | HGVSp | HGVSp Short | SWISSPROT | BIOTYPE | SIFT | PolyPhen | Tumor Sample Barcode | Tissue | Histology | Sex | Age | Stage | Therapy Types | Drugs | Outcome |
| COQ10A | SNV | Missense_Mutation | c.440C>T | p.Ser147Phe | p.S147F | Q96MF6 | protein_coding | deleterious(0) | probably_damaging(0.999) | TCGA-AR-A1AK-01 | Breast | breast invasive carcinoma | Female | >=65 | I/II | Hormone Therapy | anastrozole | SD | |
| COQ10A | insertion | Nonsense_Mutation | novel | c.640_641insGGATCTGTAGTTCCTGAAGGTGCGTGGTTAGTGGGCAAAGGTATGAA | p.Val214GlyfsTer6 | p.V214Gfs*6 | Q96MF6 | protein_coding | TCGA-BH-A0AY-01 | Breast | breast invasive carcinoma | Female | <65 | I/II | Chemotherapy | SD | |||
| COQ10A | SNV | Missense_Mutation | novel | c.310N>A | p.Val104Met | p.V104M | Q96MF6 | protein_coding | deleterious(0) | probably_damaging(0.998) | TCGA-2W-A8YY-01 | Cervix | cervical & endocervical cancer | Female | <65 | I/II | Chemotherapy | cisplatin | CR |
| COQ10A | SNV | Missense_Mutation | rs757134894 | c.469N>A | p.Val157Ile | p.V157I | Q96MF6 | protein_coding | tolerated(0.1) | probably_damaging(0.923) | TCGA-AD-5900-01 | Colorectum | colon adenocarcinoma | Male | >=65 | I/II | Unknown | Unknown | SD |
| COQ10A | SNV | Missense_Mutation | rs759222537 | c.629N>C | p.Phe210Ser | p.F210S | Q96MF6 | protein_coding | deleterious(0) | probably_damaging(0.999) | TCGA-AG-A002-01 | Colorectum | rectum adenocarcinoma | Male | <65 | I/II | Unknown | Unknown | SD |
| COQ10A | SNV | Missense_Mutation | novel | c.455T>C | p.Val152Ala | p.V152A | Q96MF6 | protein_coding | tolerated(0.05) | benign(0.348) | TCGA-EI-6917-01 | Colorectum | rectum adenocarcinoma | Male | <65 | III/IV | Chemotherapy | 5fluorouracil+oxaciplatina+l-folinian | SD |
| COQ10A | SNV | Missense_Mutation | novel | c.698C>T | p.Thr233Ile | p.T233I | Q96MF6 | protein_coding | deleterious(0) | possibly_damaging(0.542) | TCGA-A5-A0G2-01 | Endometrium | uterine corpus endometrioid carcinoma | Female | <65 | III/IV | Unknown | Unknown | SD |
| COQ10A | SNV | Missense_Mutation | novel | c.422N>C | p.Val141Ala | p.V141A | Q96MF6 | protein_coding | deleterious(0) | benign(0.392) | TCGA-AJ-A3EL-01 | Endometrium | uterine corpus endometrioid carcinoma | Female | <65 | I/II | Unknown | Unknown | SD |
| COQ10A | SNV | Missense_Mutation | novel | c.604N>A | p.His202Asn | p.H202N | Q96MF6 | protein_coding | deleterious(0) | probably_damaging(0.999) | TCGA-AP-A051-01 | Endometrium | uterine corpus endometrioid carcinoma | Female | >=65 | I/II | Unknown | Unknown | SD |
| COQ10A | SNV | Missense_Mutation | c.297N>T | p.Glu99Asp | p.E99D | Q96MF6 | protein_coding | tolerated(0.1) | benign(0.267) | TCGA-AP-A059-01 | Endometrium | uterine corpus endometrioid carcinoma | Female | >=65 | I/II | Unknown | Unknown | SD |
| Page: 1 2 3 |
Top |
Related drugs of malignant transformation related genes |
| Identification of chemicals and drugs interact with genes involved in malignant transfromation |
| (DGIdb 4.0) |
| Entrez ID | Symbol | Category | Interaction Types | Drug Claim Name | Drug Name | PMIDs |
| Page: 1 |

Copyright 2023-Present -The University of Texas Health Science Center at Houston |