
|
|||||
|
 | |
| |
| |
| |
| |
| |
|
Gene: COPZ1 |
Gene summary for COPZ1 |
| Gene information | Species | Human | Gene symbol | COPZ1 | Gene ID | 22818 |
| Gene name | COPI coat complex subunit zeta 1 | |
| Gene Alias | CGI-120 | |
| Cytomap | 12q13.13 | |
| Gene Type | protein-coding | GO ID | GO:0006810 | UniProtAcc | P61923 |
Top |
Malignant transformation analysis |
| Identification of the aberrant gene expression in precancerous and cancerous lesions by comparing the gene expression of stem-like cells in diseased tissues with normal stem cells |
| Entrez ID | Symbol | Replicates | Species | Organ | Tissue | Adj P-value | Log2FC | Malignancy |
| 22818 | COPZ1 | HTA11_3410_2000001011 | Human | Colorectum | AD | 6.40e-03 | 1.89e-01 | 0.0155 |
| 22818 | COPZ1 | HTA11_2487_2000001011 | Human | Colorectum | SER | 3.22e-02 | 4.01e-01 | -0.1808 |
| 22818 | COPZ1 | HTA11_1938_2000001011 | Human | Colorectum | AD | 6.43e-05 | 4.90e-01 | -0.0811 |
| 22818 | COPZ1 | HTA11_347_2000001011 | Human | Colorectum | AD | 5.89e-08 | 4.83e-01 | -0.1954 |
| 22818 | COPZ1 | HTA11_696_2000001011 | Human | Colorectum | AD | 4.53e-08 | 3.80e-01 | -0.1464 |
| 22818 | COPZ1 | HTA11_1391_2000001011 | Human | Colorectum | AD | 3.01e-07 | 7.22e-01 | -0.059 |
| 22818 | COPZ1 | HTA11_866_3004761011 | Human | Colorectum | AD | 8.13e-06 | 3.40e-01 | 0.096 |
| 22818 | COPZ1 | HTA11_7663_2000001011 | Human | Colorectum | SER | 2.85e-03 | 3.42e-01 | 0.0131 |
| 22818 | COPZ1 | HTA11_7696_3000711011 | Human | Colorectum | AD | 1.12e-02 | 3.48e-01 | 0.0674 |
| 22818 | COPZ1 | HTA11_7469_2000001011 | Human | Colorectum | AD | 1.45e-02 | 8.25e-01 | -0.0124 |
| 22818 | COPZ1 | HTA11_99999970781_79442 | Human | Colorectum | MSS | 9.78e-19 | 7.14e-01 | 0.294 |
| 22818 | COPZ1 | HTA11_99999965062_69753 | Human | Colorectum | MSI-H | 1.46e-07 | 1.54e+00 | 0.3487 |
| 22818 | COPZ1 | HTA11_99999965104_69814 | Human | Colorectum | MSS | 5.75e-17 | 9.45e-01 | 0.281 |
| 22818 | COPZ1 | HTA11_99999971662_82457 | Human | Colorectum | MSS | 7.31e-26 | 1.00e+00 | 0.3859 |
| 22818 | COPZ1 | A015-C-203 | Human | Colorectum | FAP | 1.02e-04 | -1.27e-01 | -0.1294 |
| 22818 | COPZ1 | A015-C-104 | Human | Colorectum | FAP | 6.69e-05 | -1.50e-01 | -0.1899 |
| 22818 | COPZ1 | A001-C-014 | Human | Colorectum | FAP | 7.20e-05 | -1.59e-01 | 0.0135 |
| 22818 | COPZ1 | A002-C-116 | Human | Colorectum | FAP | 4.75e-05 | -1.02e-01 | -0.0452 |
| 22818 | COPZ1 | F034 | Human | Colorectum | FAP | 1.77e-02 | -7.09e-02 | -0.0665 |
| 22818 | COPZ1 | AEH-subject1 | Human | Endometrium | AEH | 1.21e-06 | -3.23e-01 | -0.3059 |
| Page: 1 2 3 4 5 6 7 8 9 |
| Tissue | Expression Dynamics | Abbreviation |
| Colorectum (GSE201348) |  | FAP: Familial adenomatous polyposis |
| CRC: Colorectal cancer | ||
| Colorectum (HTA11) |  | AD: Adenomas |
| SER: Sessile serrated lesions | ||
| MSI-H: Microsatellite-high colorectal cancer | ||
| MSS: Microsatellite stable colorectal cancer | ||
| Endometrium | 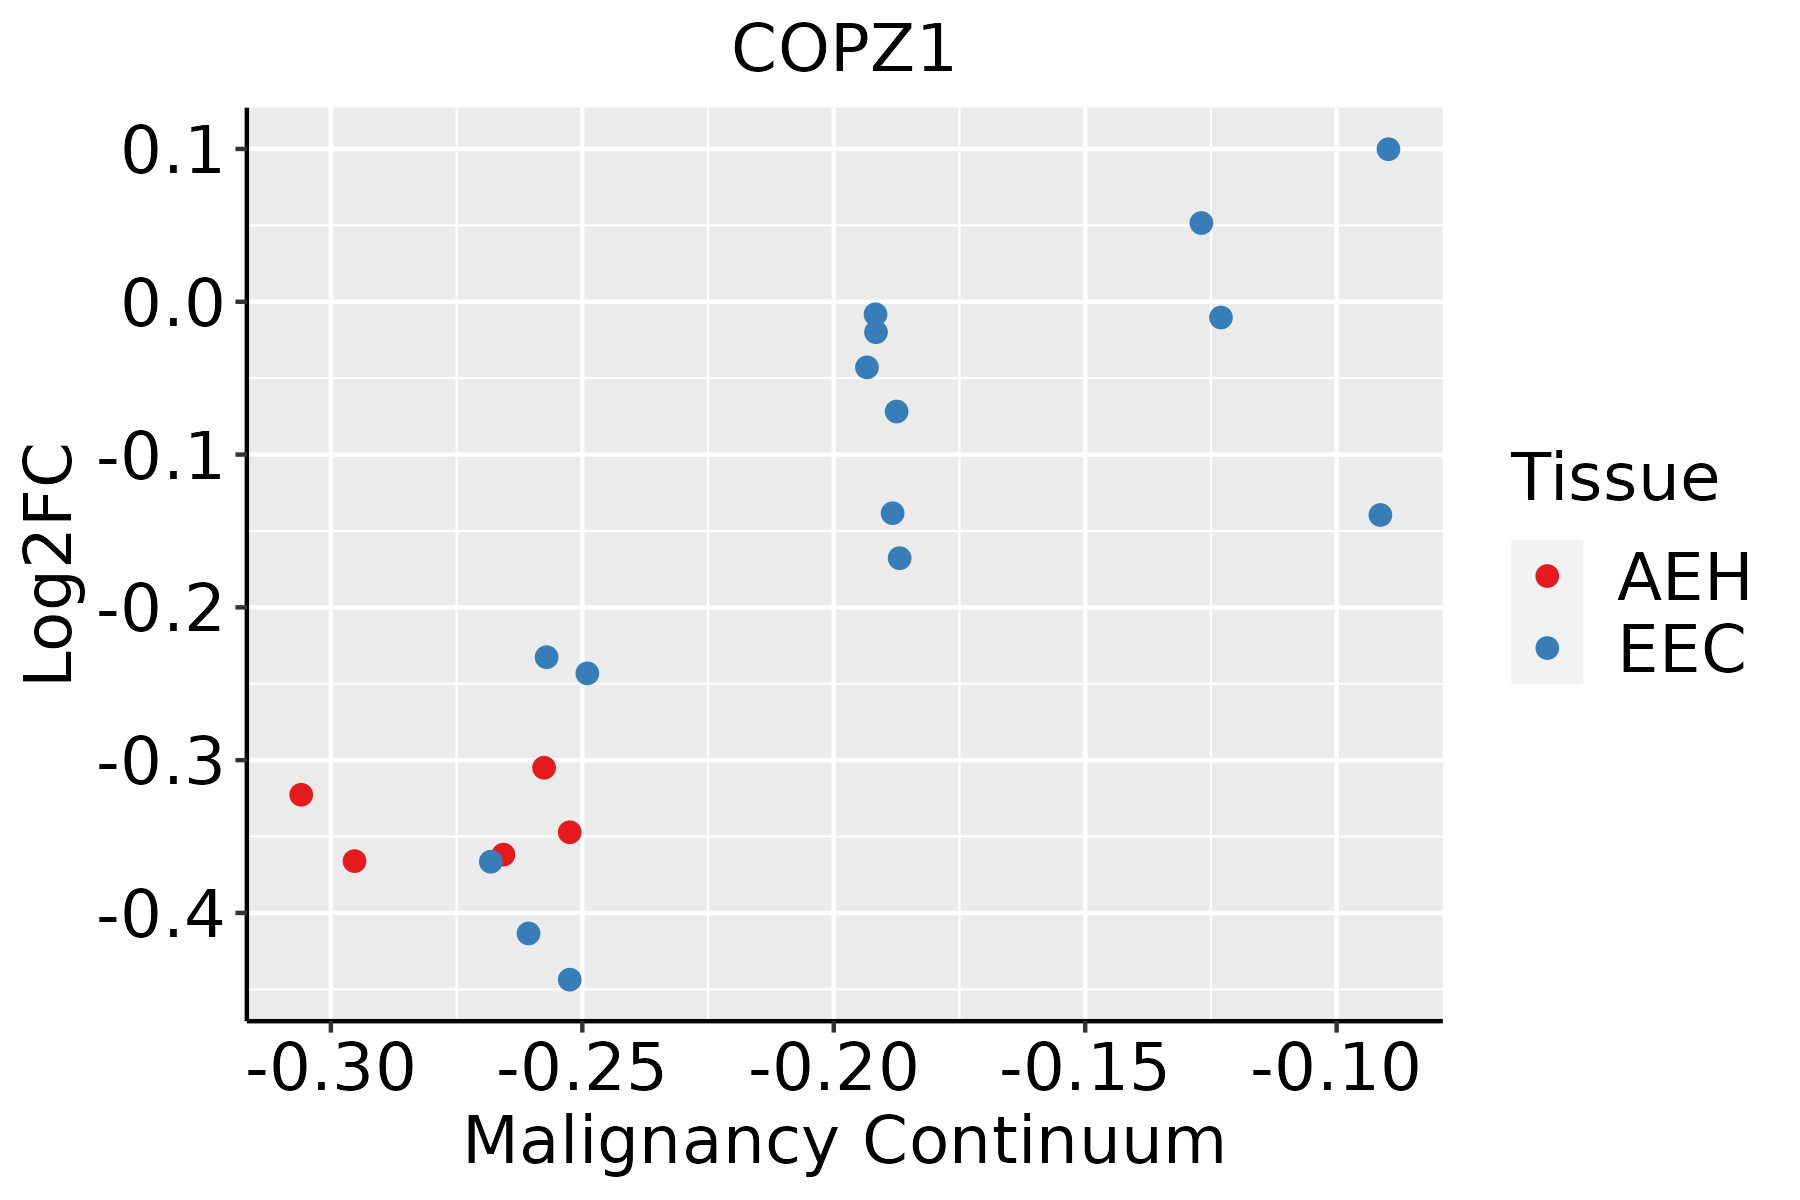 | AEH: Atypical endometrial hyperplasia |
| EEC: Endometrioid Cancer | ||
| Esophagus | 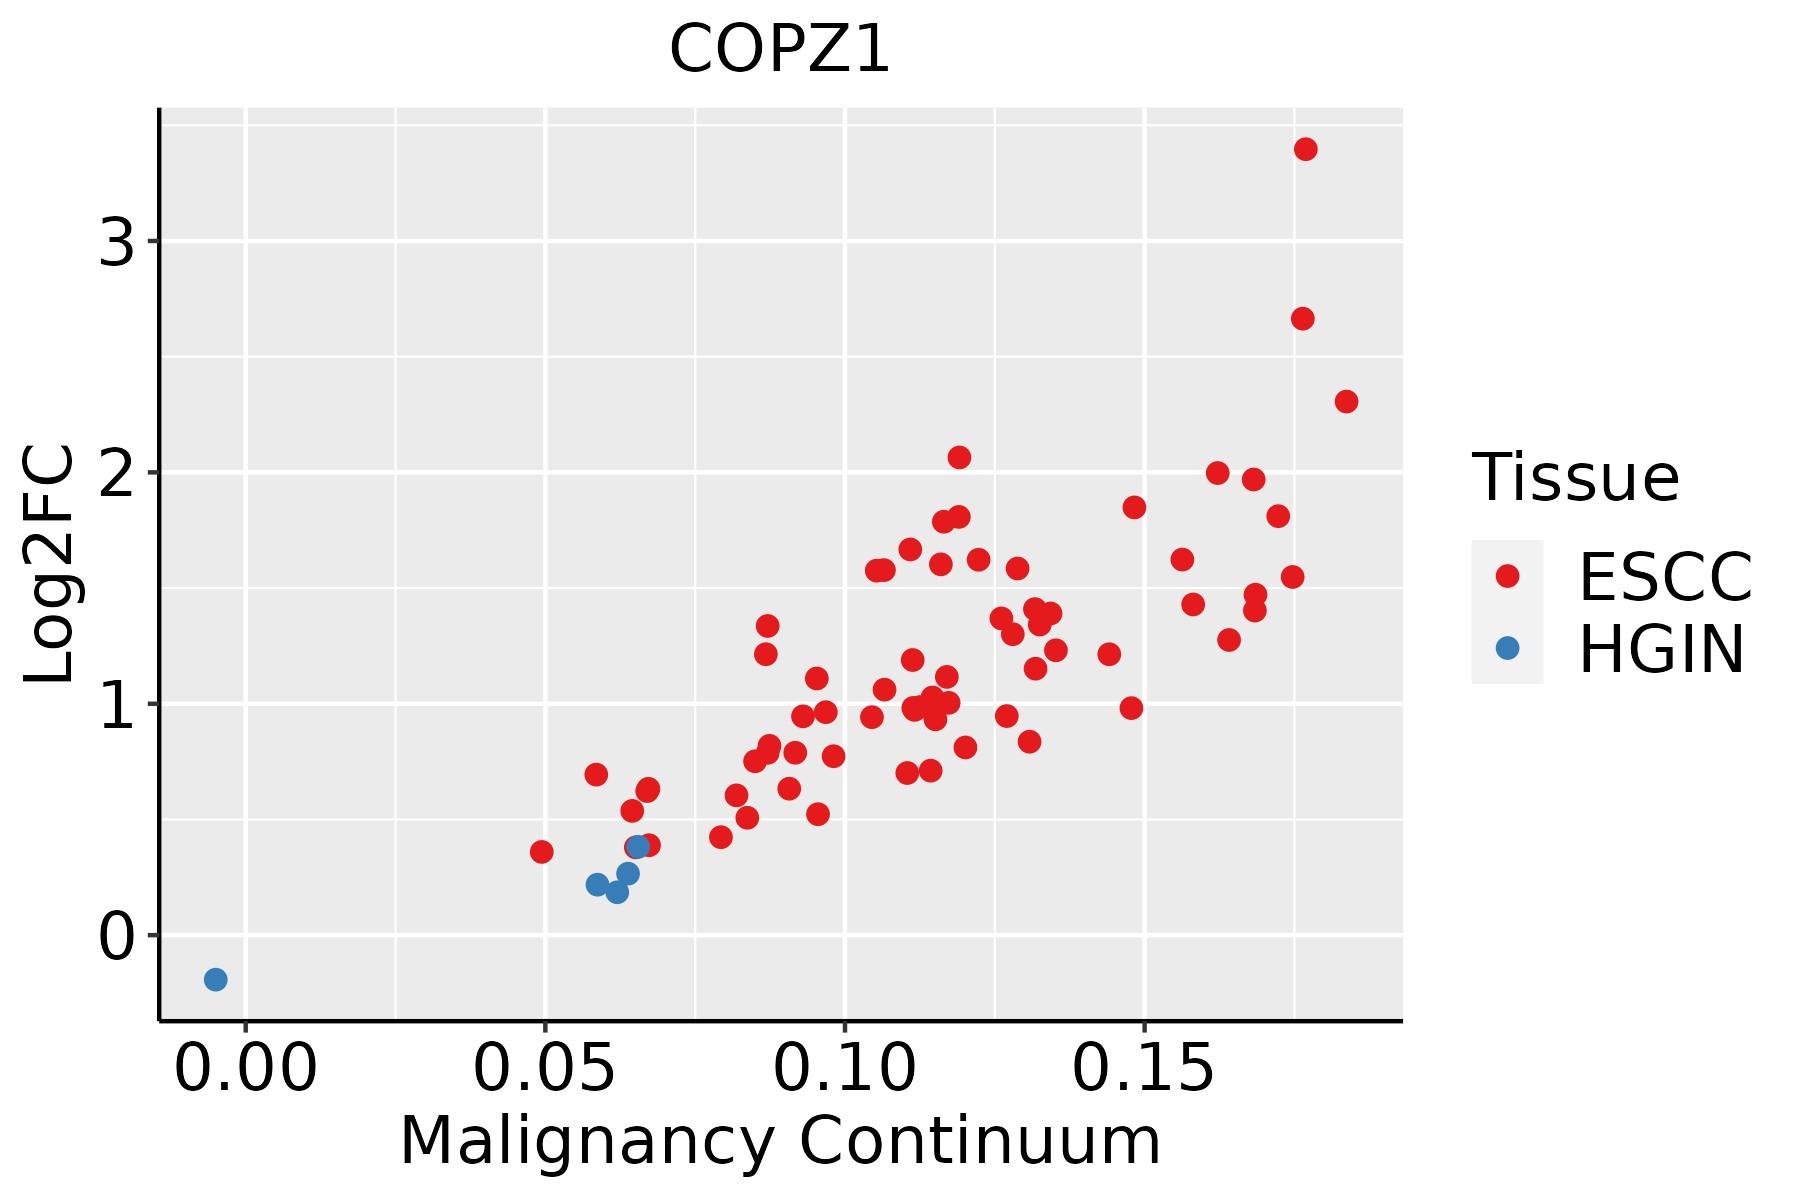 | ESCC: Esophageal squamous cell carcinoma |
| HGIN: High-grade intraepithelial neoplasias | ||
| LGIN: Low-grade intraepithelial neoplasias | ||
| Liver |  | HCC: Hepatocellular carcinoma |
| NAFLD: Non-alcoholic fatty liver disease | ||
| Oral Cavity |  | EOLP: Erosive Oral lichen planus |
| LP: leukoplakia | ||
| NEOLP: Non-erosive oral lichen planus | ||
| OSCC: Oral squamous cell carcinoma | ||
| Prostate | 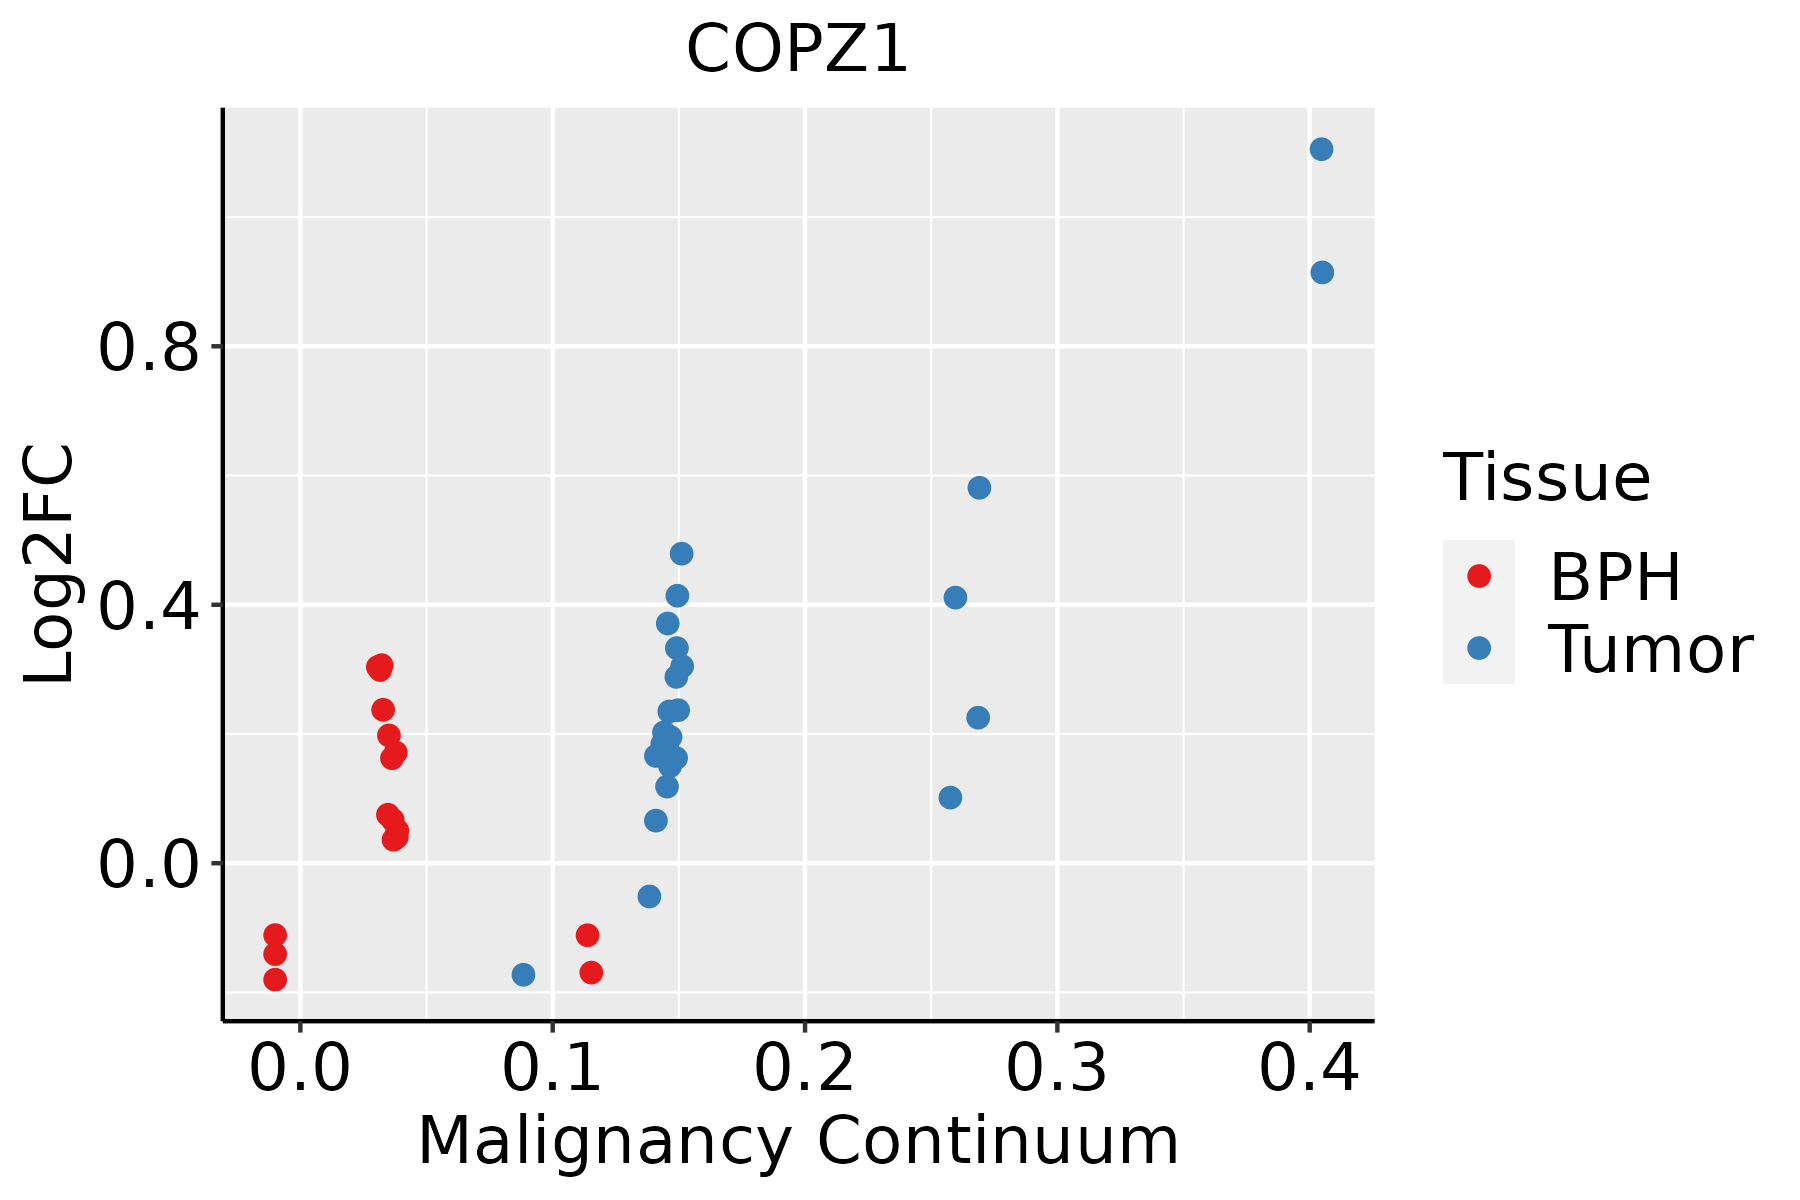 | BPH: Benign Prostatic Hyperplasia |
| Skin |  | AK: Actinic keratosis |
| cSCC: Cutaneous squamous cell carcinoma | ||
| SCCIS:squamous cell carcinoma in situ | ||
| Thyroid |  | ATC: Anaplastic thyroid cancer |
| HT: Hashimoto's thyroiditis | ||
| PTC: Papillary thyroid cancer |
| ∗log2FC in expression of this searched gene in stem-like cells from each diseased tissue sample relative to stem-like cells in normal samples in each tissue plotted against the malignancy continuum. Samples are colored based on if they are from different disease stage. |
Top |
Malignant transformation related pathway analysis |
| Find out the enriched GO biological processes and KEGG pathways involved in transition from healthy to precancer to cancer |
| Tissue | Disease Stage | Enriched GO biological Processes |
| Colorectum | AD |  |
| Colorectum | SER |  |
| Colorectum | MSS |  |
| Colorectum | MSI-H |  |
| Colorectum | FAP |  |
| ∗Top 15 enriched GO BP terms are showed in the bar plot of each disease state in each tissue. Each row represents a significant GO biological process which is colored according to the -log10(p.adjust). |
| Page: 1 2 3 4 5 6 7 8 9 |
| GO ID | Tissue | Disease Stage | Description | Gene Ratio | Bg Ratio | pvalue | p.adjust | Count |
| GO:0048193 | Colorectum | AD | Golgi vesicle transport | 109/3918 | 296/18723 | 1.80e-10 | 1.68e-08 | 109 |
| GO:0006890 | Colorectum | AD | retrograde vesicle-mediated transport, Golgi to endoplasmic reticulum | 27/3918 | 52/18723 | 7.67e-07 | 2.70e-05 | 27 |
| GO:00481931 | Colorectum | SER | Golgi vesicle transport | 79/2897 | 296/18723 | 4.20e-07 | 2.15e-05 | 79 |
| GO:00068901 | Colorectum | SER | retrograde vesicle-mediated transport, Golgi to endoplasmic reticulum | 20/2897 | 52/18723 | 4.80e-05 | 1.18e-03 | 20 |
| GO:00481932 | Colorectum | MSS | Golgi vesicle transport | 101/3467 | 296/18723 | 9.09e-11 | 9.77e-09 | 101 |
| GO:00068902 | Colorectum | MSS | retrograde vesicle-mediated transport, Golgi to endoplasmic reticulum | 26/3467 | 52/18723 | 2.66e-07 | 1.10e-05 | 26 |
| GO:00068903 | Colorectum | MSI-H | retrograde vesicle-mediated transport, Golgi to endoplasmic reticulum | 13/1319 | 52/18723 | 4.72e-05 | 1.69e-03 | 13 |
| GO:00481933 | Colorectum | MSI-H | Golgi vesicle transport | 39/1319 | 296/18723 | 1.17e-04 | 3.51e-03 | 39 |
| GO:00481934 | Colorectum | FAP | Golgi vesicle transport | 77/2622 | 296/18723 | 2.86e-08 | 2.62e-06 | 77 |
| GO:00068904 | Colorectum | FAP | retrograde vesicle-mediated transport, Golgi to endoplasmic reticulum | 18/2622 | 52/18723 | 1.48e-04 | 2.29e-03 | 18 |
| GO:00481939 | Endometrium | AEH | Golgi vesicle transport | 60/2100 | 296/18723 | 3.65e-06 | 9.79e-05 | 60 |
| GO:00068908 | Endometrium | AEH | retrograde vesicle-mediated transport, Golgi to endoplasmic reticulum | 15/2100 | 52/18723 | 4.20e-04 | 4.46e-03 | 15 |
| GO:004819313 | Endometrium | EEC | Golgi vesicle transport | 60/2168 | 296/18723 | 9.91e-06 | 2.17e-04 | 60 |
| GO:000689013 | Endometrium | EEC | retrograde vesicle-mediated transport, Golgi to endoplasmic reticulum | 15/2168 | 52/18723 | 5.90e-04 | 5.87e-03 | 15 |
| GO:004819318 | Esophagus | ESCC | Golgi vesicle transport | 231/8552 | 296/18723 | 1.82e-30 | 9.63e-28 | 231 |
| GO:000689017 | Esophagus | ESCC | retrograde vesicle-mediated transport, Golgi to endoplasmic reticulum | 46/8552 | 52/18723 | 1.23e-10 | 3.66e-09 | 46 |
| GO:00068914 | Esophagus | ESCC | intra-Golgi vesicle-mediated transport | 26/8552 | 33/18723 | 1.06e-04 | 7.43e-04 | 26 |
| GO:004819311 | Liver | Cirrhotic | Golgi vesicle transport | 153/4634 | 296/18723 | 1.02e-23 | 6.43e-21 | 153 |
| GO:00068905 | Liver | Cirrhotic | retrograde vesicle-mediated transport, Golgi to endoplasmic reticulum | 29/4634 | 52/18723 | 1.69e-06 | 3.22e-05 | 29 |
| GO:004819321 | Liver | HCC | Golgi vesicle transport | 217/7958 | 296/18723 | 2.58e-27 | 1.02e-24 | 217 |
| Page: 1 2 3 |
| Pathway ID | Tissue | Disease Stage | Description | Gene Ratio | Bg Ratio | pvalue | p.adjust | qvalue | Count |
| Page: 1 |
Top |
Cell-cell communication analysis |
| Identification of potential cell-cell interactions between two cell types and their ligand-receptor pairs for different disease states |
| Ligand | Receptor | LRpair | Pathway | Tissue | Disease Stage |
| Page: 1 |
Top |
Single-cell gene regulatory network inference analysis |
| Find out the significant the regulons (TFs) and the target genes of each regulon across cell types for different disease states |
| TF | Cell Type | Tissue | Disease Stage | Target Gene | RSS | Regulon Activity |
| ∗The dot plots of a searched regulon are shown for all cell subpopulations in each disease state of each tissue based on the regulon specific score inferred using pySCENIC and by calculating the average expression. |
| Page: 1 |
Top |
Somatic mutation of malignant transformation related genes |
| Annotation of somatic variants for genes involved in malignant transformation |
| Hugo Symbol | Variant Class | Variant Classification | dbSNP RS | HGVSc | HGVSp | HGVSp Short | SWISSPROT | BIOTYPE | SIFT | PolyPhen | Tumor Sample Barcode | Tissue | Histology | Sex | Age | Stage | Therapy Types | Drugs | Outcome |
| COPZ1 | SNV | Missense_Mutation | novel | c.277N>A | p.Glu93Lys | p.E93K | P61923 | protein_coding | deleterious(0) | probably_damaging(0.994) | TCGA-A2-A0CR-01 | Breast | breast invasive carcinoma | Female | <65 | I/II | Chemotherapy | adriamycin | CR |
| COPZ1 | SNV | Missense_Mutation | novel | c.157N>C | p.Glu53Gln | p.E53Q | P61923 | protein_coding | deleterious(0) | probably_damaging(0.986) | TCGA-MY-A913-01 | Cervix | cervical & endocervical cancer | Female | <65 | I/II | Chemotherapy | cisplatin | CR |
| COPZ1 | SNV | Missense_Mutation | novel | c.14N>A | p.Arg5Lys | p.R5K | P61923 | protein_coding | tolerated_low_confidence(0.93) | benign(0) | TCGA-AA-A010-01 | Colorectum | colon adenocarcinoma | Female | <65 | I/II | Chemotherapy | folinic | CR |
| COPZ1 | SNV | Missense_Mutation | c.524C>T | p.Ala175Val | p.A175V | P61923 | protein_coding | deleterious(0) | probably_damaging(0.992) | TCGA-AM-5821-01 | Colorectum | colon adenocarcinoma | Female | >=65 | I/II | Unknown | Unknown | SD | |
| COPZ1 | SNV | Missense_Mutation | c.266N>A | p.Gly89Asp | p.G89D | P61923 | protein_coding | deleterious(0) | probably_damaging(1) | TCGA-AF-5654-01 | Colorectum | rectum adenocarcinoma | Female | >=65 | I/II | Unknown | Unknown | SD | |
| COPZ1 | SNV | Missense_Mutation | novel | c.150N>T | p.Lys50Asn | p.K50N | P61923 | protein_coding | deleterious(0.05) | possibly_damaging(0.835) | TCGA-A5-A0G1-01 | Endometrium | uterine corpus endometrioid carcinoma | Female | >=65 | I/II | Unknown | Unknown | SD |
| COPZ1 | SNV | Missense_Mutation | novel | c.98G>A | p.Arg33Gln | p.R33Q | P61923 | protein_coding | deleterious(0.01) | possibly_damaging(0.612) | TCGA-A5-A0G2-01 | Endometrium | uterine corpus endometrioid carcinoma | Female | <65 | III/IV | Unknown | Unknown | SD |
| COPZ1 | SNV | Missense_Mutation | novel | c.162G>T | p.Lys54Asn | p.K54N | P61923 | protein_coding | deleterious(0.01) | probably_damaging(0.919) | TCGA-A5-A0G2-01 | Endometrium | uterine corpus endometrioid carcinoma | Female | <65 | III/IV | Unknown | Unknown | SD |
| COPZ1 | SNV | Missense_Mutation | novel | c.86N>G | p.Asn29Ser | p.N29S | P61923 | protein_coding | tolerated(0.5) | benign(0.012) | TCGA-AP-A051-01 | Endometrium | uterine corpus endometrioid carcinoma | Female | >=65 | I/II | Unknown | Unknown | SD |
| COPZ1 | SNV | Missense_Mutation | novel | c.456C>A | p.His152Gln | p.H152Q | P61923 | protein_coding | tolerated(1) | benign(0) | TCGA-AX-A2HD-01 | Endometrium | uterine corpus endometrioid carcinoma | Female | >=65 | III/IV | Unknown | Unknown | SD |
| Page: 1 2 3 |
Top |
Related drugs of malignant transformation related genes |
| Identification of chemicals and drugs interact with genes involved in malignant transfromation |
| (DGIdb 4.0) |
| Entrez ID | Symbol | Category | Interaction Types | Drug Claim Name | Drug Name | PMIDs |
| Page: 1 |

Copyright 2023-Present -The University of Texas Health Science Center at Houston |