Schematic overview of the cellular and molecular mechanisms involved in the cancer progression, including the proposed cellular and molecular mechanisms in cancer cells trajectory. AT1: alveolar type 1 cells; AT2: alveolar type 2 cells; AAH: atypical adenomatous hyperplasia; AIS: adenocarcinoma in situ; MIA: minimally invasive adenocarcinoma; IA: invasive adenocarcinoma; EMT: epithelial-mesenchymal transition

Home

Download

Statistics

Help

Contact

Center for Computational Systems Medicine
leaf

Gene summary

leaf

Malignant transformation analysis

leaf

Malignant transformation related pathway analysis

leaf

Cell-cell communication analysis

leaf

Single-cell gene regulatory network inference analysis

leaf

Somatic mutation of malignant transformation related genes

leaf

Related drugs of malignant transformation related genes

Gene: COPS8

Gene summary for COPS8

check button Gene summary.

Gene informationSpeciesHuman
Gene symbol

COPS8

Gene ID

10920

Gene nameCOP9 signalosome subunit 8
Gene AliasCOP9
Cytomap2q37.3
Gene Typeprotein-coding
GO ID

GO:0000338

UniProtAcc

A0A024R4D1


Top

Malignant transformation analysis

check button Identification of the aberrant gene expression in precancerous and cancerous lesions by comparing the gene expression of stem-like cells in diseased tissues with normal stem cells
check button Malignant transformation involving gene list.
Entrez IDSymbolReplicatesSpeciesOrganTissueAdj P-valueLog2FCMalignancy
10920COPS8LZE4THumanEsophagusESCC1.82e-183.32e-010.0811
10920COPS8LZE8THumanEsophagusESCC1.96e-073.96e-010.067
10920COPS8LZE20THumanEsophagusESCC3.25e-031.39e-010.0662
10920COPS8LZE24THumanEsophagusESCC2.62e-166.41e-010.0596
10920COPS8LZE21THumanEsophagusESCC3.54e-022.47e-010.0655
10920COPS8LZE6THumanEsophagusESCC4.45e-094.96e-010.0845
10920COPS8P1T-EHumanEsophagusESCC1.70e-082.88e-010.0875
10920COPS8P2T-EHumanEsophagusESCC8.49e-395.79e-010.1177
10920COPS8P4T-EHumanEsophagusESCC1.83e-236.93e-010.1323
10920COPS8P5T-EHumanEsophagusESCC1.26e-429.11e-010.1327
10920COPS8P8T-EHumanEsophagusESCC4.36e-265.04e-010.0889
10920COPS8P9T-EHumanEsophagusESCC6.84e-195.86e-010.1131
10920COPS8P10T-EHumanEsophagusESCC1.57e-306.48e-010.116
10920COPS8P11T-EHumanEsophagusESCC7.39e-227.60e-010.1426
10920COPS8P12T-EHumanEsophagusESCC4.46e-508.92e-010.1122
10920COPS8P15T-EHumanEsophagusESCC5.63e-441.10e+000.1149
10920COPS8P16T-EHumanEsophagusESCC3.70e-427.90e-010.1153
10920COPS8P17T-EHumanEsophagusESCC4.34e-106.11e-010.1278
10920COPS8P19T-EHumanEsophagusESCC7.78e-079.08e-010.1662
10920COPS8P20T-EHumanEsophagusESCC1.79e-357.28e-010.1124
Page: 1 2 3 4 5 6 

check button Transcriptomic changes along malignancy continuum.
TissueExpression DynamicsAbbreviation
EsophagusThe image shows the transcriptomic changes along malignancy continuum.log2FC in expression of this searched gene in stem-like cells from each diseased tissue sample relative to stem-like cells in normal samples in each tissue plotted against the malignancy continuum. Samples are colored based on if they are from different disease stage.
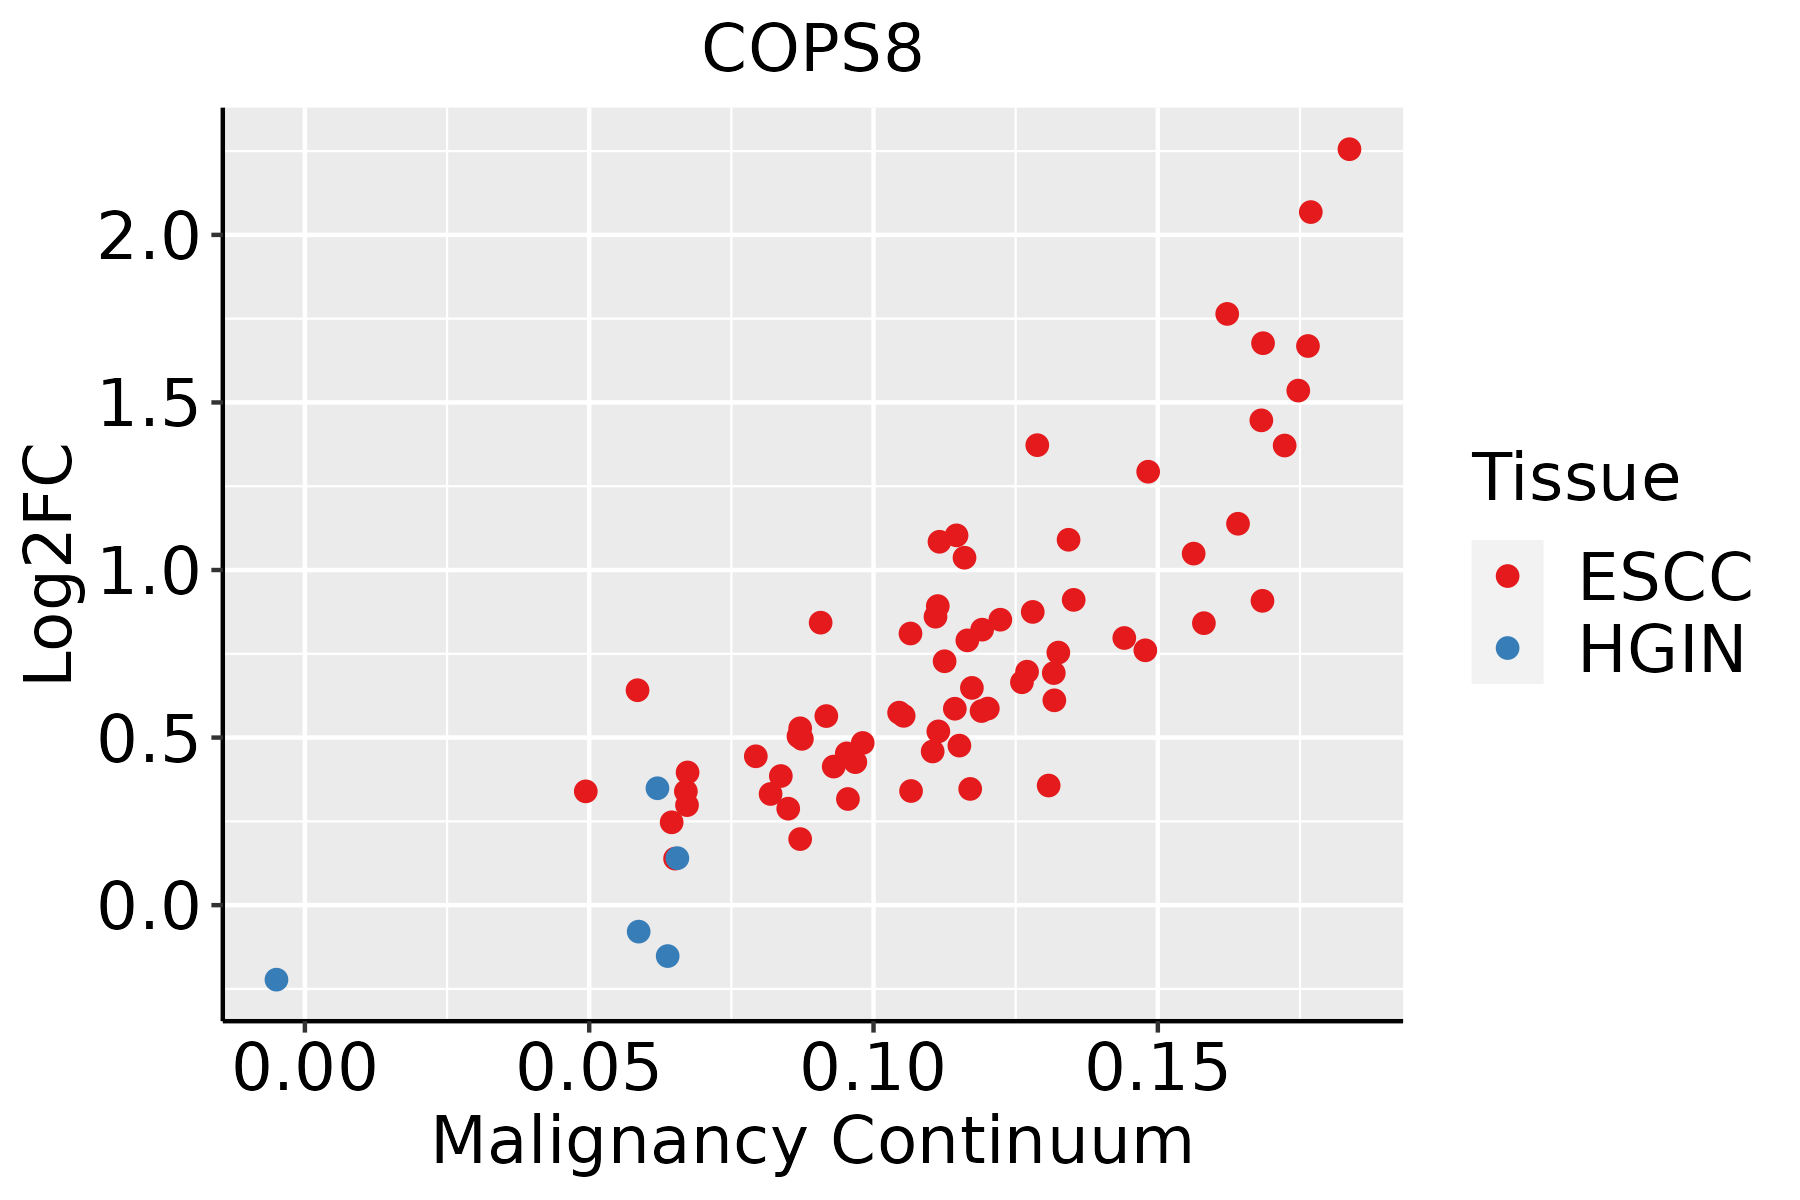
ESCC: Esophageal squamous cell carcinoma
HGIN: High-grade intraepithelial neoplasias
LGIN: Low-grade intraepithelial neoplasias
LiverThe image shows the transcriptomic changes along malignancy continuum.log2FC in expression of this searched gene in stem-like cells from each diseased tissue sample relative to stem-like cells in normal samples in each tissue plotted against the malignancy continuum. Samples are colored based on if they are from different disease stage.
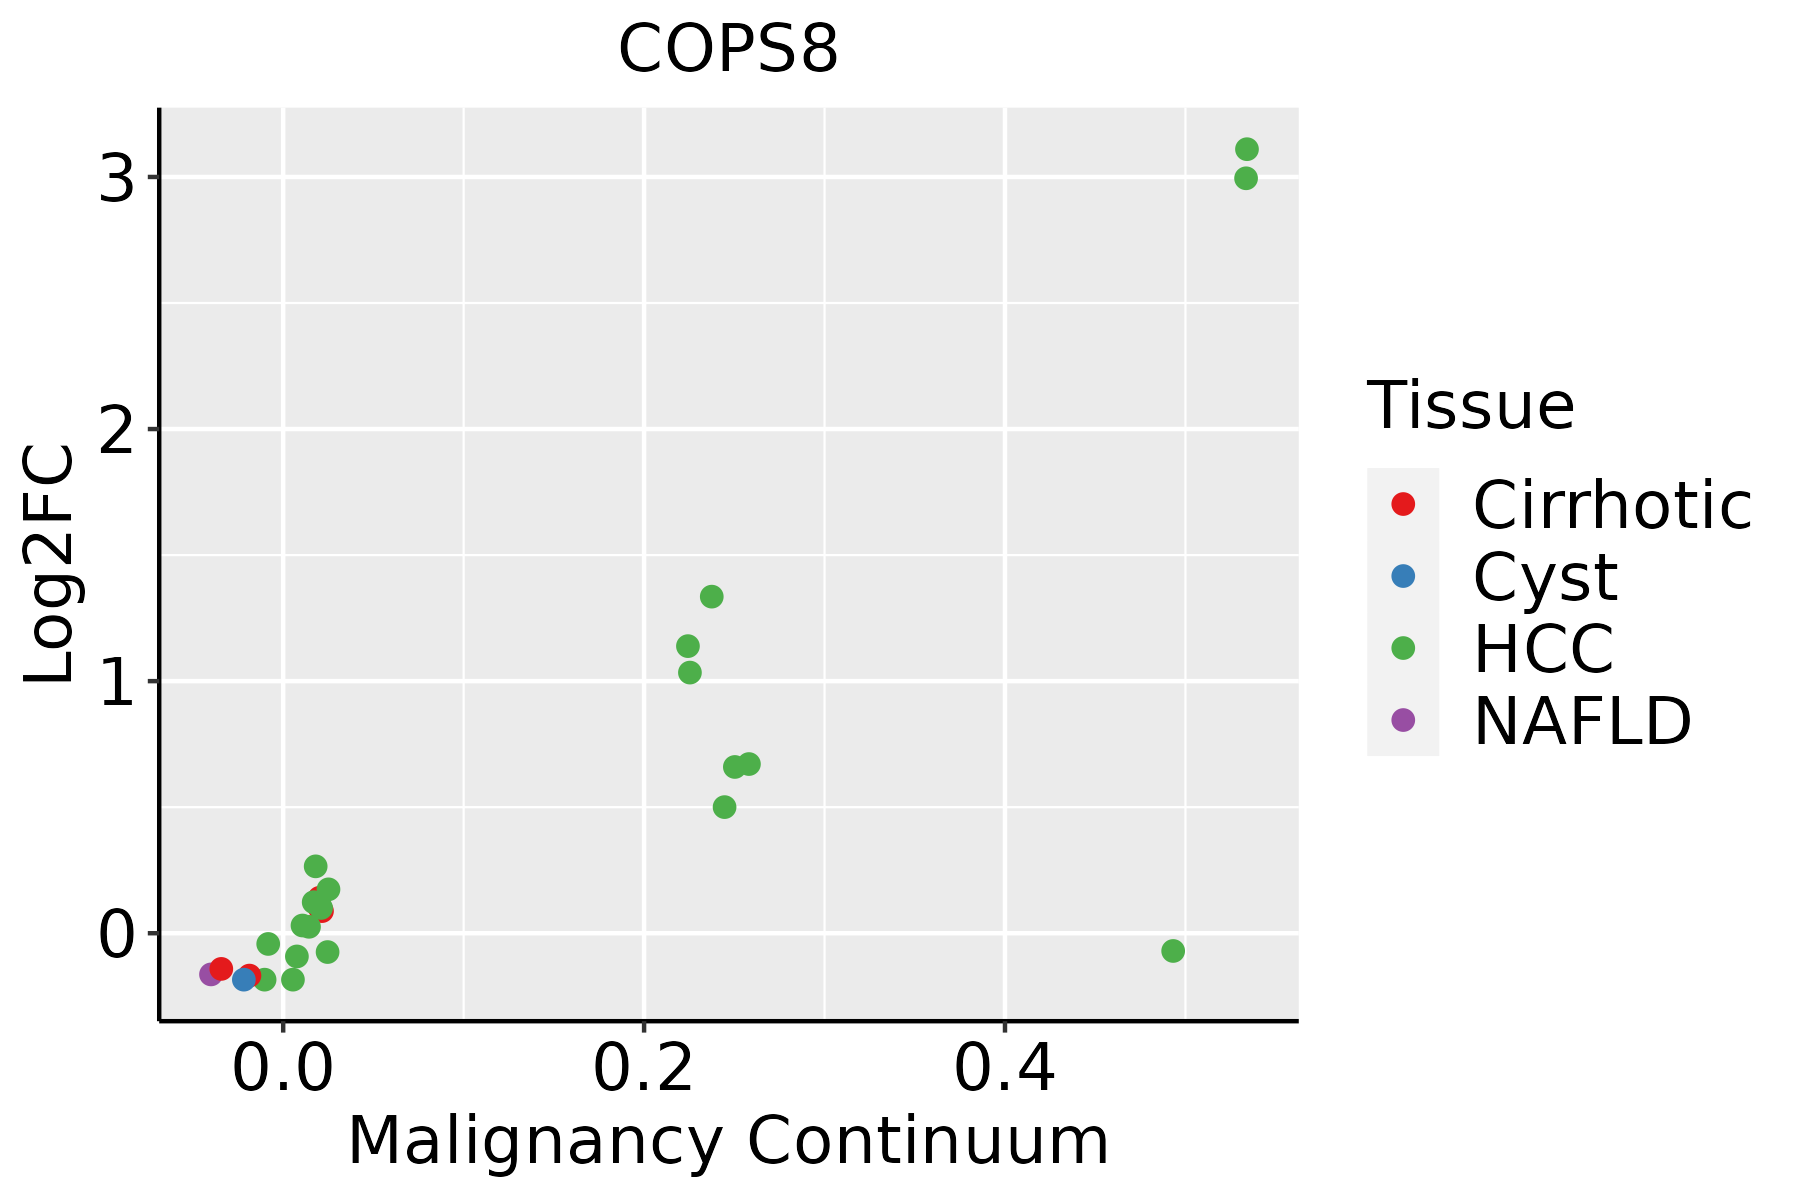
HCC: Hepatocellular carcinoma
NAFLD: Non-alcoholic fatty liver disease
Oral CavityThe image shows the transcriptomic changes along malignancy continuum.log2FC in expression of this searched gene in stem-like cells from each diseased tissue sample relative to stem-like cells in normal samples in each tissue plotted against the malignancy continuum. Samples are colored based on if they are from different disease stage.EOLP: Erosive Oral lichen planus
LP: leukoplakia
NEOLP: Non-erosive oral lichen planus
OSCC: Oral squamous cell carcinoma
SkinThe image shows the transcriptomic changes along malignancy continuum.log2FC in expression of this searched gene in stem-like cells from each diseased tissue sample relative to stem-like cells in normal samples in each tissue plotted against the malignancy continuum. Samples are colored based on if they are from different disease stage.
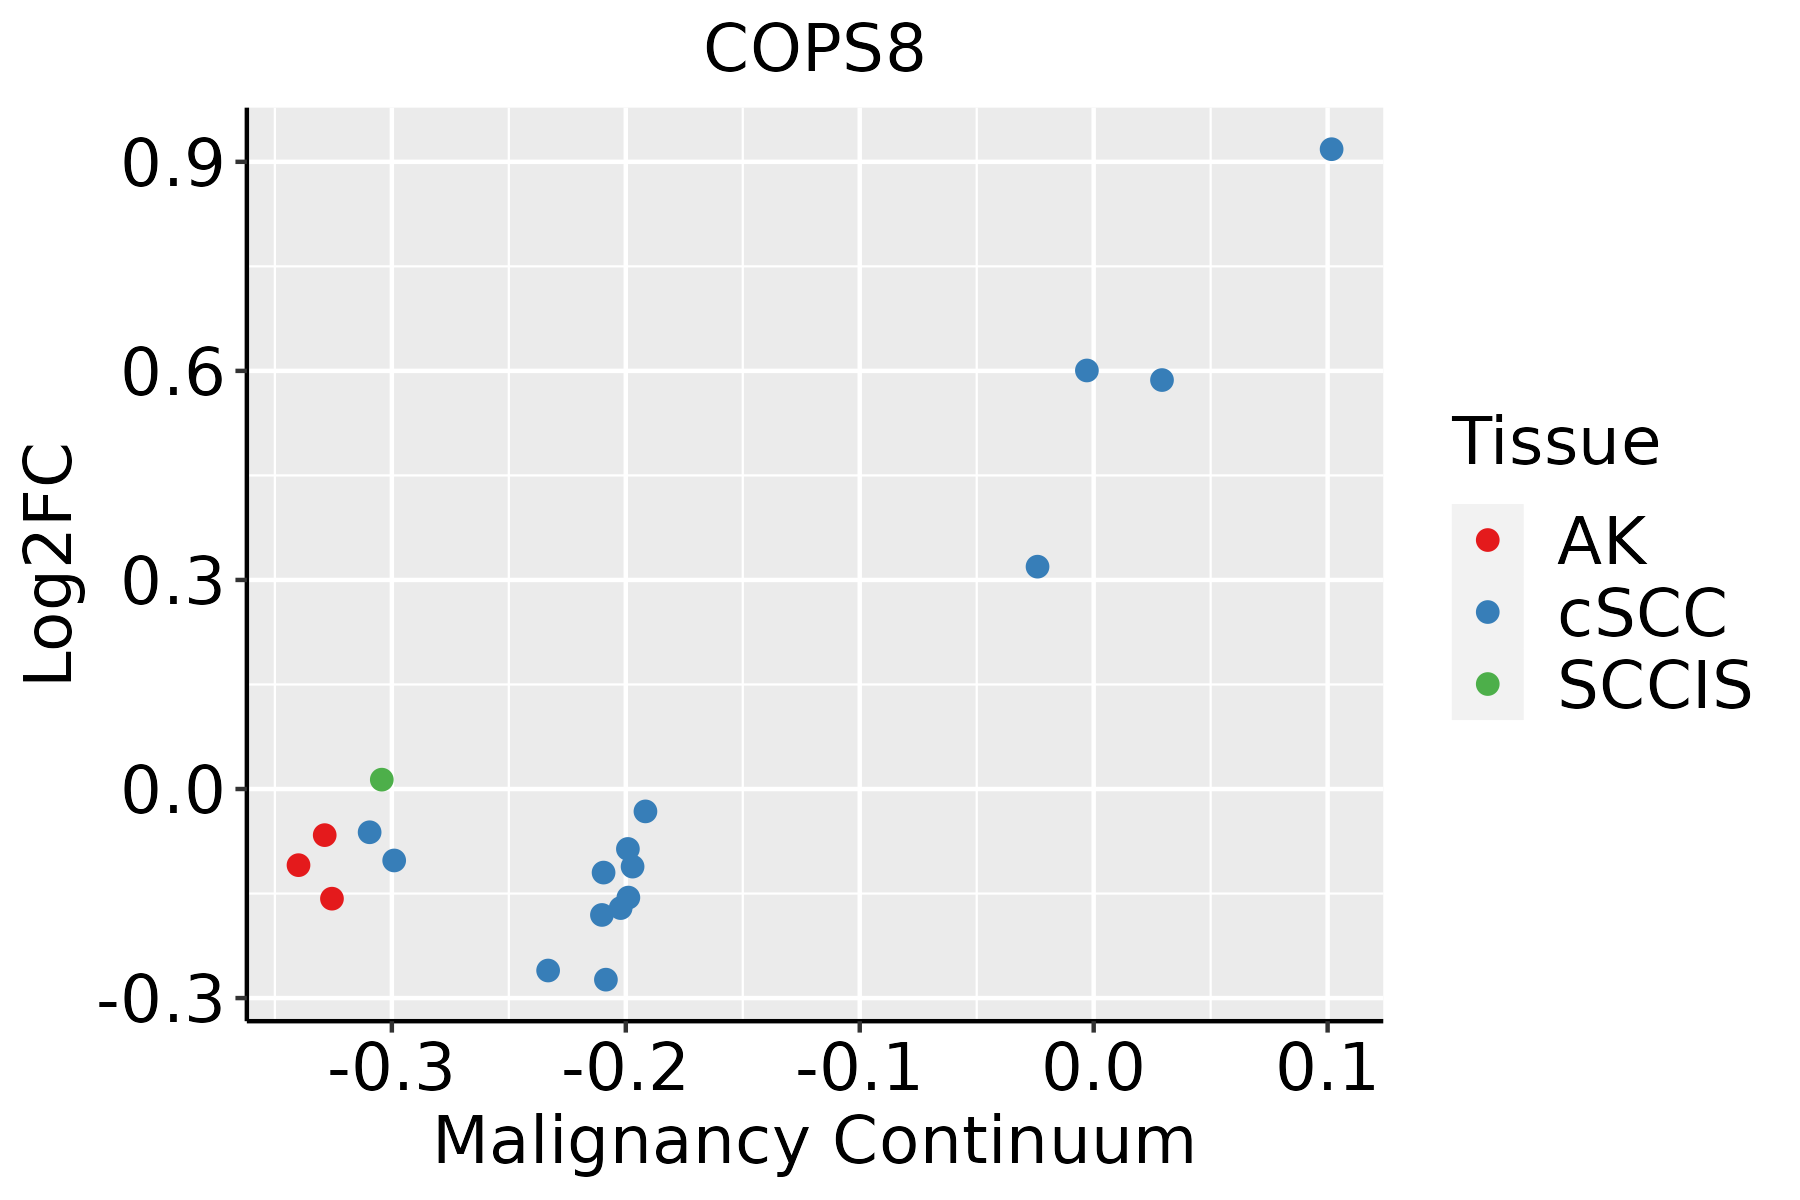
AK: Actinic keratosis
cSCC: Cutaneous squamous cell carcinoma
SCCIS:squamous cell carcinoma in situ
ThyroidThe image shows the transcriptomic changes along malignancy continuum.log2FC in expression of this searched gene in stem-like cells from each diseased tissue sample relative to stem-like cells in normal samples in each tissue plotted against the malignancy continuum. Samples are colored based on if they are from different disease stage.ATC: Anaplastic thyroid cancer
HT: Hashimoto's thyroiditis
PTC: Papillary thyroid cancer
∗log2FC in expression of this searched gene in stem-like cells from each diseased tissue sample relative to stem-like cells in normal samples in each tissue plotted against the malignancy continuum. Samples are colored based on if they are from different disease stage.

Top

Malignant transformation related pathway analysis

check buttonFind out the enriched GO biological processes and KEGG pathways involved in transition from healthy to precancer to cancer
check button Figure of enriched GO biological processes.
TissueDisease StageEnriched GO biological Processes
ColorectumADGO analysis - Figure of enriched GO biological processes: Top 15 enriched GO BP terms are showed in the bar plot of each disease state in each tissue. Each row represents a significant GO biological process which is colored according to the -log10(p.adjust).
ColorectumSERGO analysis - Figure of enriched GO biological processes: Top 15 enriched GO BP terms are showed in the bar plot of each disease state in each tissue. Each row represents a significant GO biological process which is colored according to the -log10(p.adjust).
ColorectumMSSGO analysis - Figure of enriched GO biological processes: Top 15 enriched GO BP terms are showed in the bar plot of each disease state in each tissue. Each row represents a significant GO biological process which is colored according to the -log10(p.adjust).
ColorectumMSI-HGO analysis - Figure of enriched GO biological processes: Top 15 enriched GO BP terms are showed in the bar plot of each disease state in each tissue. Each row represents a significant GO biological process which is colored according to the -log10(p.adjust).
ColorectumFAPGO analysis - Figure of enriched GO biological processes: Top 15 enriched GO BP terms are showed in the bar plot of each disease state in each tissue. Each row represents a significant GO biological process which is colored according to the -log10(p.adjust).
∗Top 15 enriched GO BP terms are showed in the bar plot of each disease state in each tissue. Each row represents a significant GO biological process which is colored according to the -log10(p.adjust).
Page: 1 2 3 4 5 6 7 8 9 

check button Enriched GO biological processes.
GO IDTissueDisease StageDescriptionGene RatioBg Ratiopvaluep.adjustCount
GO:004586018EsophagusESCCpositive regulation of protein kinase activity219/8552386/187236.91e-066.97e-05219
GO:003367420EsophagusESCCpositive regulation of kinase activity260/8552467/187237.26e-067.22e-05260
GO:007064612EsophagusESCCprotein modification by small protein removal95/8552157/187231.25e-048.56e-0495
GO:000033812EsophagusESCCprotein deneddylation10/855210/187233.94e-042.26e-0310
GO:00380615EsophagusESCCNIK/NF-kappaB signaling81/8552143/187235.33e-032.00e-0281
GO:0038061LiverCirrhoticNIK/NF-kappaB signaling54/4634143/187233.64e-043.07e-0354
GO:0000338LiverCirrhoticprotein deneddylation7/463410/187233.29e-031.83e-027
GO:004586011LiverCirrhoticpositive regulation of protein kinase activity117/4634386/187237.07e-033.41e-02117
GO:00706461LiverHCCprotein modification by small protein removal91/7958157/187236.50e-055.92e-0491
GO:004586021LiverHCCpositive regulation of protein kinase activity194/7958386/187231.16e-036.54e-03194
GO:003367411LiverHCCpositive regulation of kinase activity230/7958467/187231.72e-038.95e-03230
GO:00003381LiverHCCprotein deneddylation9/795810/187232.79e-031.31e-029
GO:00380611LiverHCCNIK/NF-kappaB signaling77/7958143/187233.98e-031.76e-0277
GO:00321471LiverHCCactivation of protein kinase activity72/7958134/187235.61e-032.33e-0272
GO:004586016Oral cavityOSCCpositive regulation of protein kinase activity194/7305386/187233.90e-064.59e-05194
GO:003367418Oral cavityOSCCpositive regulation of kinase activity228/7305467/187238.31e-068.90e-05228
GO:00003382Oral cavityOSCCprotein deneddylation10/730510/187238.14e-056.26e-0410
GO:00380614Oral cavityOSCCNIK/NF-kappaB signaling78/7305143/187231.14e-048.35e-0478
GO:00706462Oral cavityOSCCprotein modification by small protein removal77/7305157/187236.55e-032.43e-0277
GO:000033811Oral cavityLPprotein deneddylation9/462310/187232.64e-054.21e-049
Page: 1 2 

check button Enriched KEGG pathways.
Pathway IDTissueDisease StageDescriptionGene RatioBg Ratiopvaluep.adjustqvalueCount
Page: 1 

Top

Cell-cell communication analysis

check buttonIdentification of potential cell-cell interactions between two cell types and their ligand-receptor pairs for different disease states
LigandReceptorLRpairPathwayTissueDisease Stage
Page: 1 

Top

Single-cell gene regulatory network inference analysis

check buttonFind out the significant the regulons (TFs) and the target genes of each regulon across cell types for different disease states
TFCell TypeTissueDisease StageTarget GeneRSSRegulon Activity
∗The dot plots of a searched regulon are shown for all cell subpopulations in each disease state of each tissue based on the regulon specific score inferred using pySCENIC and by calculating the average expression.
Page: 1 

Top

Somatic mutation of malignant transformation related genes

check buttonAnnotation of somatic variants for genes involved in malignant transformation
Hugo SymbolVariant ClassVariant ClassificationdbSNP RSHGVScHGVSpHGVSp ShortSWISSPROTBIOTYPESIFTPolyPhenTumor Sample BarcodeTissueHistologySexAgeStageTherapy TypesDrugsOutcome
COPS8SNVMissense_Mutationc.61N>Ap.Glu21Lysp.E21KQ99627protein_codingdeleterious(0)possibly_damaging(0.77)TCGA-AN-A0FJ-01Breastbreast invasive carcinomaFemale<65III/IVUnknownUnknownSD
COPS8SNVMissense_Mutationc.158C>Gp.Ala53Glyp.A53GQ99627protein_codingdeleterious(0)possibly_damaging(0.613)TCGA-2W-A8YY-01Cervixcervical & endocervical cancerFemale<65I/IIChemotherapycisplatinCR
COPS8SNVMissense_Mutationc.349G>Tp.Ala117Serp.A117SQ99627protein_codingdeleterious(0.04)benign(0.026)TCGA-EK-A2R7-01Cervixcervical & endocervical cancerFemale<65I/IIUnknownUnknownSD
COPS8insertionFrame_Shift_Insnovelc.591_592insACTTTCTTAGATTTp.Ala198ThrfsTer8p.A198Tfs*8Q99627protein_codingTCGA-AM-5820-01Colorectumcolon adenocarcinomaFemale<65I/IIUnknownUnknownSD
COPS8SNVMissense_Mutationnovelc.197N>Ap.Ser66Tyrp.S66YQ99627protein_codingdeleterious(0)possibly_damaging(0.766)TCGA-A5-A0G2-01Endometriumuterine corpus endometrioid carcinomaFemale<65III/IVUnknownUnknownSD
COPS8SNVMissense_Mutationc.200C>Tp.Ala67Valp.A67VQ99627protein_codingtolerated(0.06)possibly_damaging(0.598)TCGA-AP-A059-01Endometriumuterine corpus endometrioid carcinomaFemale>=65I/IIUnknownUnknownSD
COPS8SNVMissense_Mutationrs760027685c.347N>Ap.Arg116Hisp.R116HQ99627protein_codingdeleterious(0)possibly_damaging(0.786)TCGA-AX-A1CE-01Endometriumuterine corpus endometrioid carcinomaFemale<65I/IIUnspecificPaclitaxelSD
COPS8SNVMissense_Mutationc.283G>Ap.Ala95Thrp.A95TQ99627protein_codingdeleterious(0.02)benign(0.058)TCGA-AX-A2HD-01Endometriumuterine corpus endometrioid carcinomaFemale>=65III/IVUnknownUnknownSD
COPS8SNVMissense_Mutationnovelc.204T>Ap.Asn68Lysp.N68KQ99627protein_codingtolerated(0.09)benign(0.339)TCGA-B5-A0JU-01Endometriumuterine corpus endometrioid carcinomaFemale<65I/IIUnknownUnknownSD
COPS8SNVMissense_Mutationc.329N>Tp.Arg110Ilep.R110IQ99627protein_codingdeleterious(0.03)possibly_damaging(0.745)TCGA-BS-A0UF-01Endometriumuterine corpus endometrioid carcinomaFemale>=65I/IIUnknownUnknownSD
Page: 1 2 3 

Top

Related drugs of malignant transformation related genes

check buttonIdentification of chemicals and drugs interact with genes involved in malignant transfromation
(DGIdb 4.0)
Entrez IDSymbolCategoryInteraction TypesDrug Claim NameDrug NamePMIDs
Page: 1