
|
|||||
|
 | |
| |
| |
| |
| |
| |
|
Gene: COPS7B |
Gene summary for COPS7B |
| Gene information | Species | Human | Gene symbol | COPS7B | Gene ID | 64708 |
| Gene name | COP9 signalosome subunit 7B | |
| Gene Alias | CSN7B | |
| Cytomap | 2q37.1 | |
| Gene Type | protein-coding | GO ID | GO:0000338 | UniProtAcc | J3KQ34 |
Top |
Malignant transformation analysis |
| Identification of the aberrant gene expression in precancerous and cancerous lesions by comparing the gene expression of stem-like cells in diseased tissues with normal stem cells |
| Entrez ID | Symbol | Replicates | Species | Organ | Tissue | Adj P-value | Log2FC | Malignancy |
| 64708 | COPS7B | LZE4T | Human | Esophagus | ESCC | 9.40e-04 | 8.71e-02 | 0.0811 |
| 64708 | COPS7B | LZE7T | Human | Esophagus | ESCC | 1.73e-06 | 1.98e-01 | 0.0667 |
| 64708 | COPS7B | LZE8T | Human | Esophagus | ESCC | 1.65e-08 | 1.67e-01 | 0.067 |
| 64708 | COPS7B | LZE20T | Human | Esophagus | ESCC | 1.46e-08 | 1.96e-01 | 0.0662 |
| 64708 | COPS7B | LZE24T | Human | Esophagus | ESCC | 6.32e-14 | 4.34e-01 | 0.0596 |
| 64708 | COPS7B | LZE21T | Human | Esophagus | ESCC | 1.38e-03 | 2.66e-01 | 0.0655 |
| 64708 | COPS7B | LZE6T | Human | Esophagus | ESCC | 1.70e-04 | 2.17e-01 | 0.0845 |
| 64708 | COPS7B | P1T-E | Human | Esophagus | ESCC | 1.40e-02 | 2.79e-01 | 0.0875 |
| 64708 | COPS7B | P2T-E | Human | Esophagus | ESCC | 2.26e-16 | 2.92e-01 | 0.1177 |
| 64708 | COPS7B | P4T-E | Human | Esophagus | ESCC | 8.42e-20 | 2.52e-01 | 0.1323 |
| 64708 | COPS7B | P5T-E | Human | Esophagus | ESCC | 8.25e-13 | 2.80e-01 | 0.1327 |
| 64708 | COPS7B | P8T-E | Human | Esophagus | ESCC | 2.83e-14 | 2.85e-01 | 0.0889 |
| 64708 | COPS7B | P9T-E | Human | Esophagus | ESCC | 5.84e-05 | 1.09e-01 | 0.1131 |
| 64708 | COPS7B | P10T-E | Human | Esophagus | ESCC | 3.18e-21 | 4.14e-01 | 0.116 |
| 64708 | COPS7B | P11T-E | Human | Esophagus | ESCC | 1.71e-14 | 5.74e-01 | 0.1426 |
| 64708 | COPS7B | P12T-E | Human | Esophagus | ESCC | 1.42e-20 | 4.11e-01 | 0.1122 |
| 64708 | COPS7B | P15T-E | Human | Esophagus | ESCC | 4.80e-17 | 4.52e-01 | 0.1149 |
| 64708 | COPS7B | P16T-E | Human | Esophagus | ESCC | 8.26e-33 | 5.22e-01 | 0.1153 |
| 64708 | COPS7B | P17T-E | Human | Esophagus | ESCC | 2.44e-03 | 2.20e-01 | 0.1278 |
| 64708 | COPS7B | P19T-E | Human | Esophagus | ESCC | 7.49e-04 | 4.57e-01 | 0.1662 |
| Page: 1 2 3 4 5 |
| Tissue | Expression Dynamics | Abbreviation |
| Esophagus | 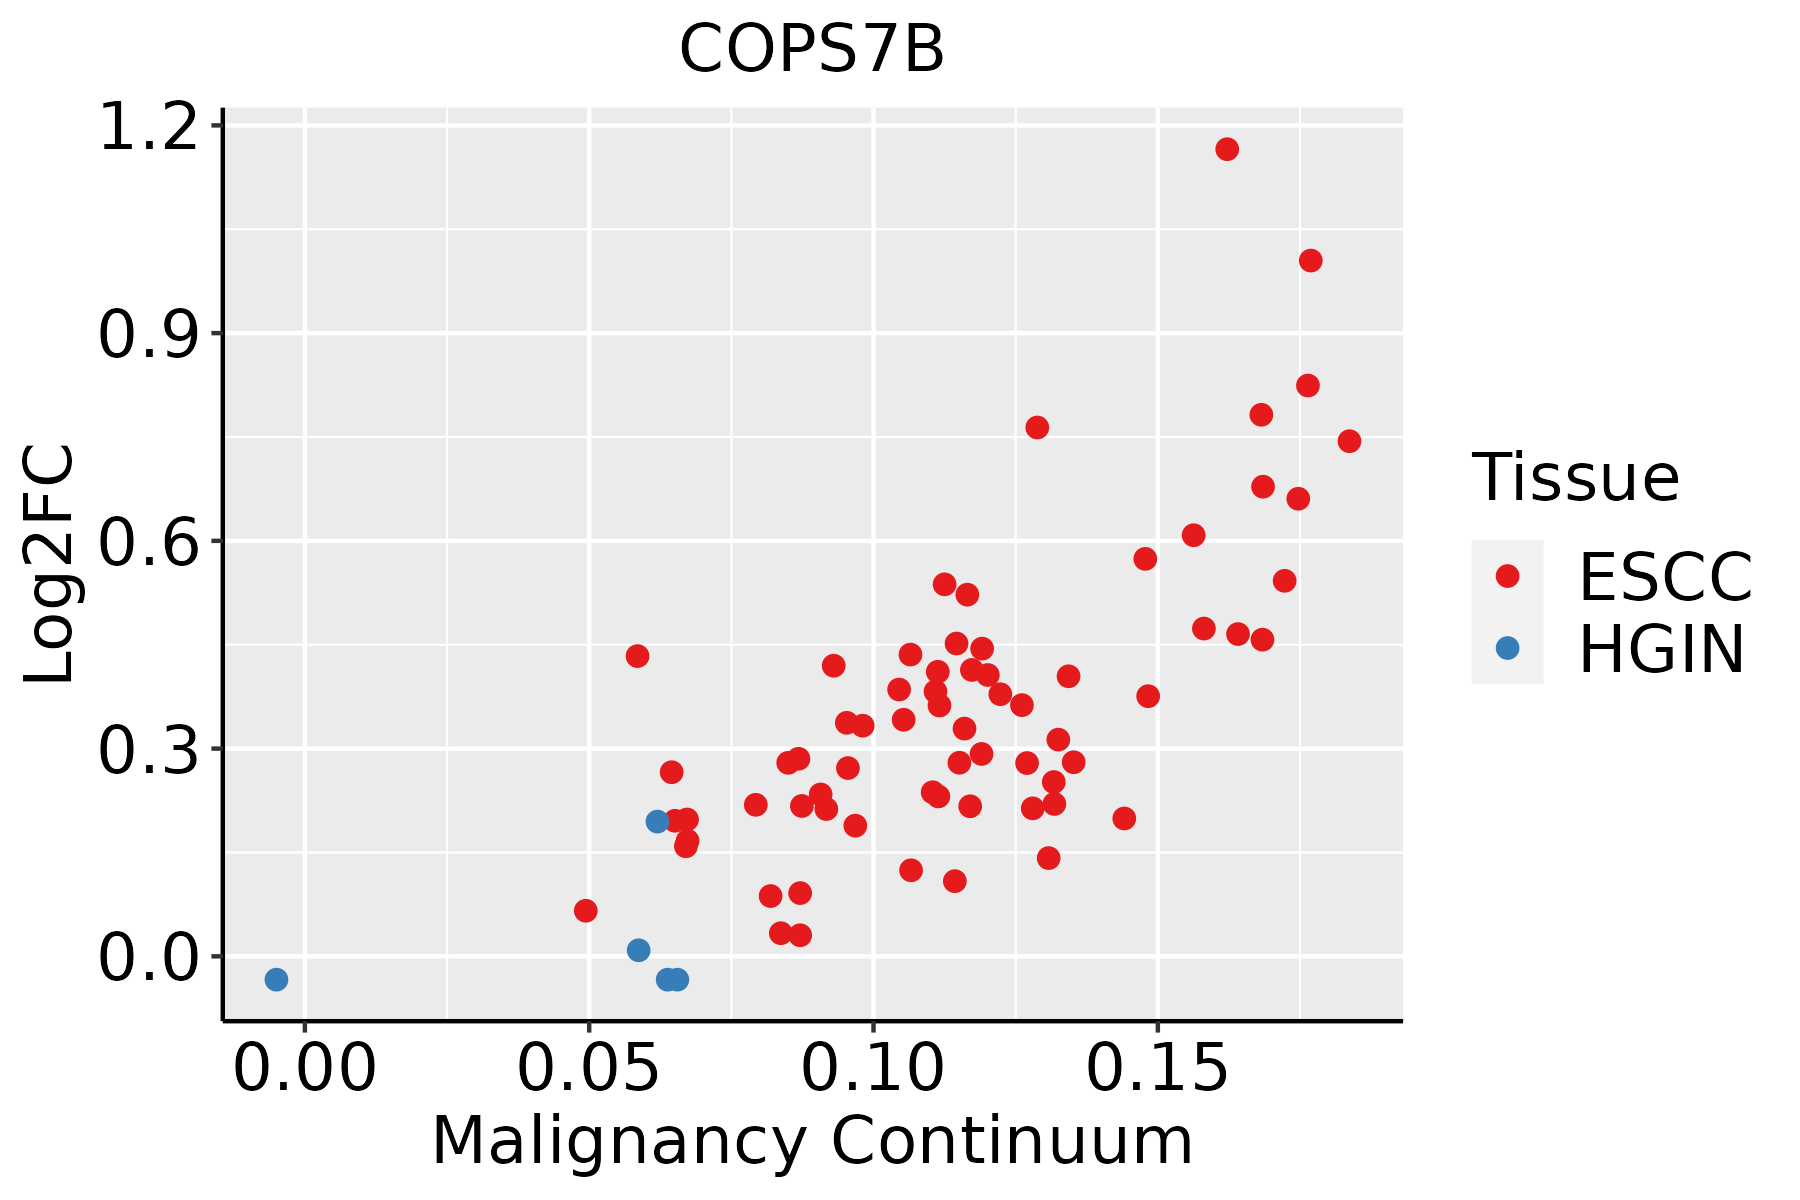 | ESCC: Esophageal squamous cell carcinoma |
| HGIN: High-grade intraepithelial neoplasias | ||
| LGIN: Low-grade intraepithelial neoplasias | ||
| Liver | 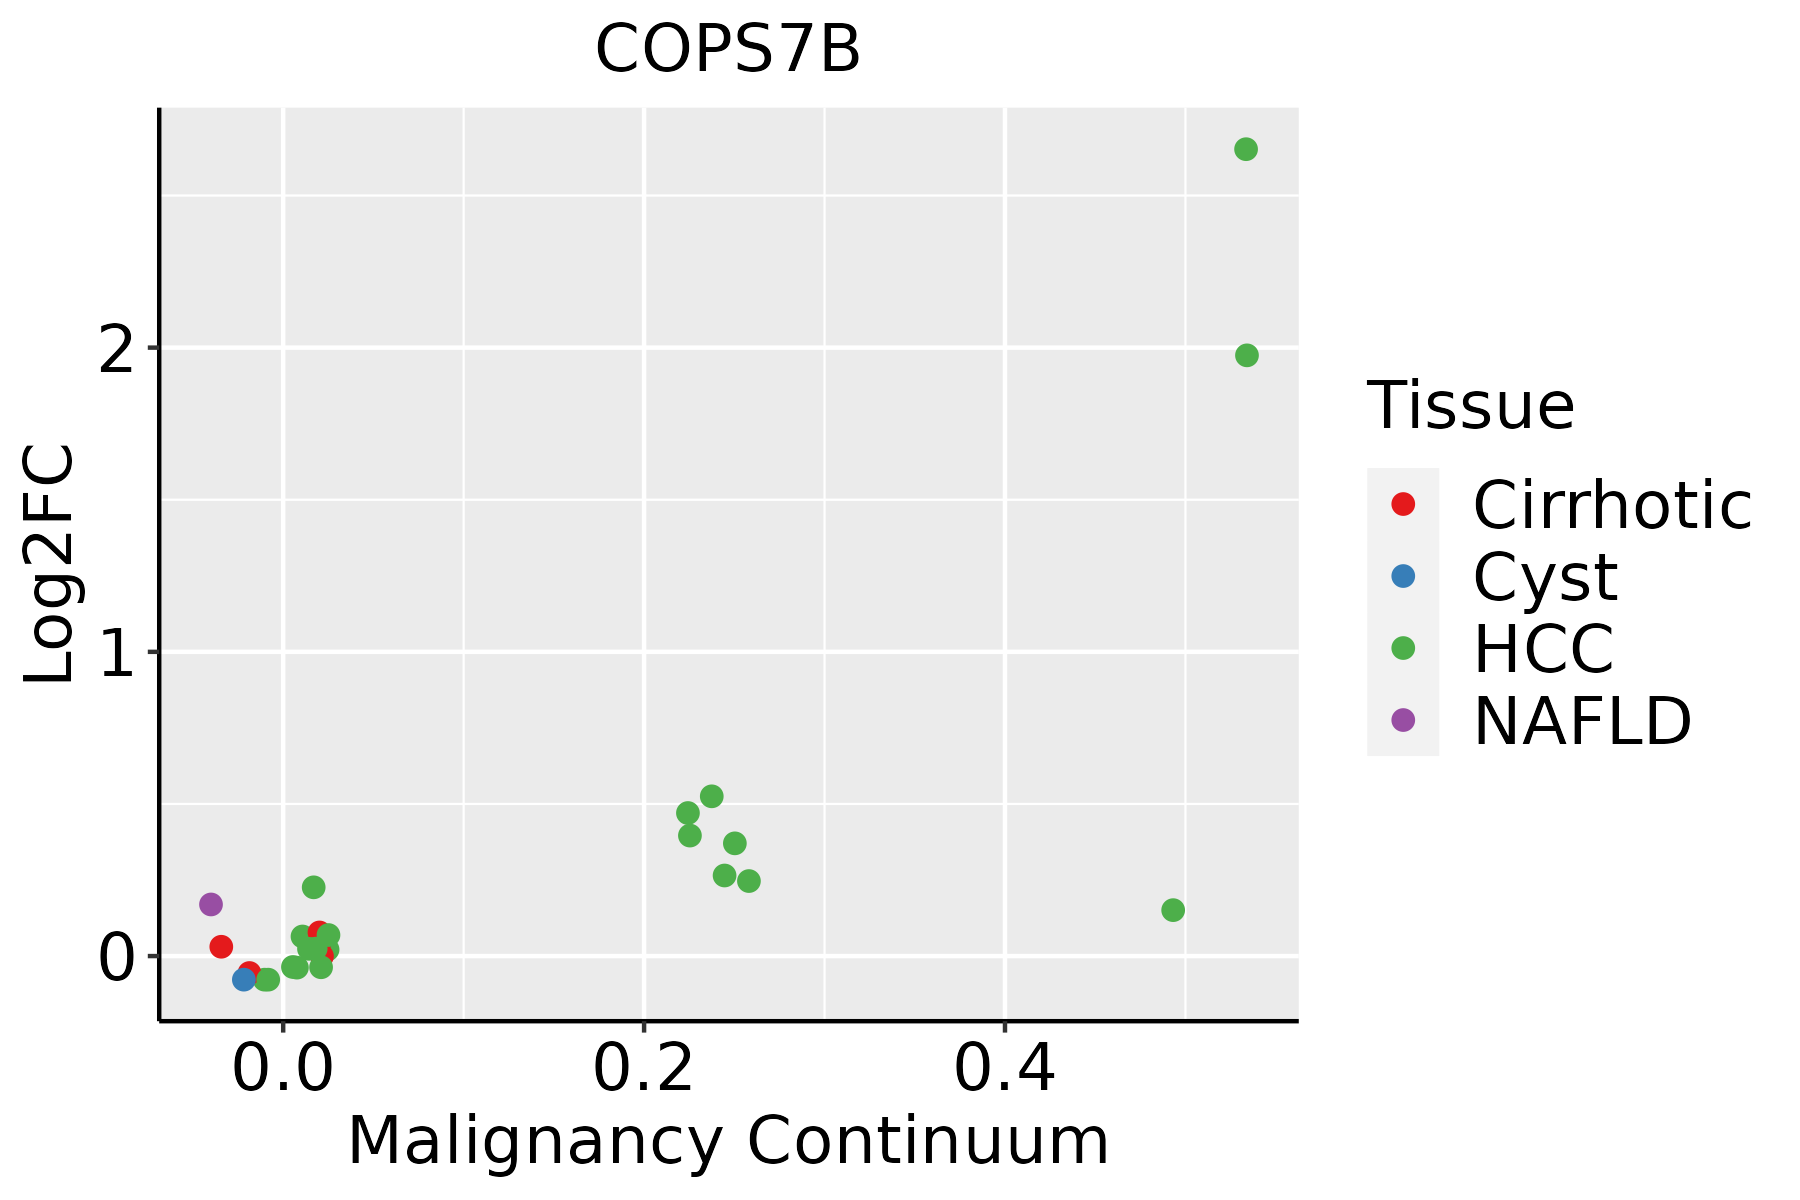 | HCC: Hepatocellular carcinoma |
| NAFLD: Non-alcoholic fatty liver disease | ||
| Oral Cavity |  | EOLP: Erosive Oral lichen planus |
| LP: leukoplakia | ||
| NEOLP: Non-erosive oral lichen planus | ||
| OSCC: Oral squamous cell carcinoma | ||
| Skin | 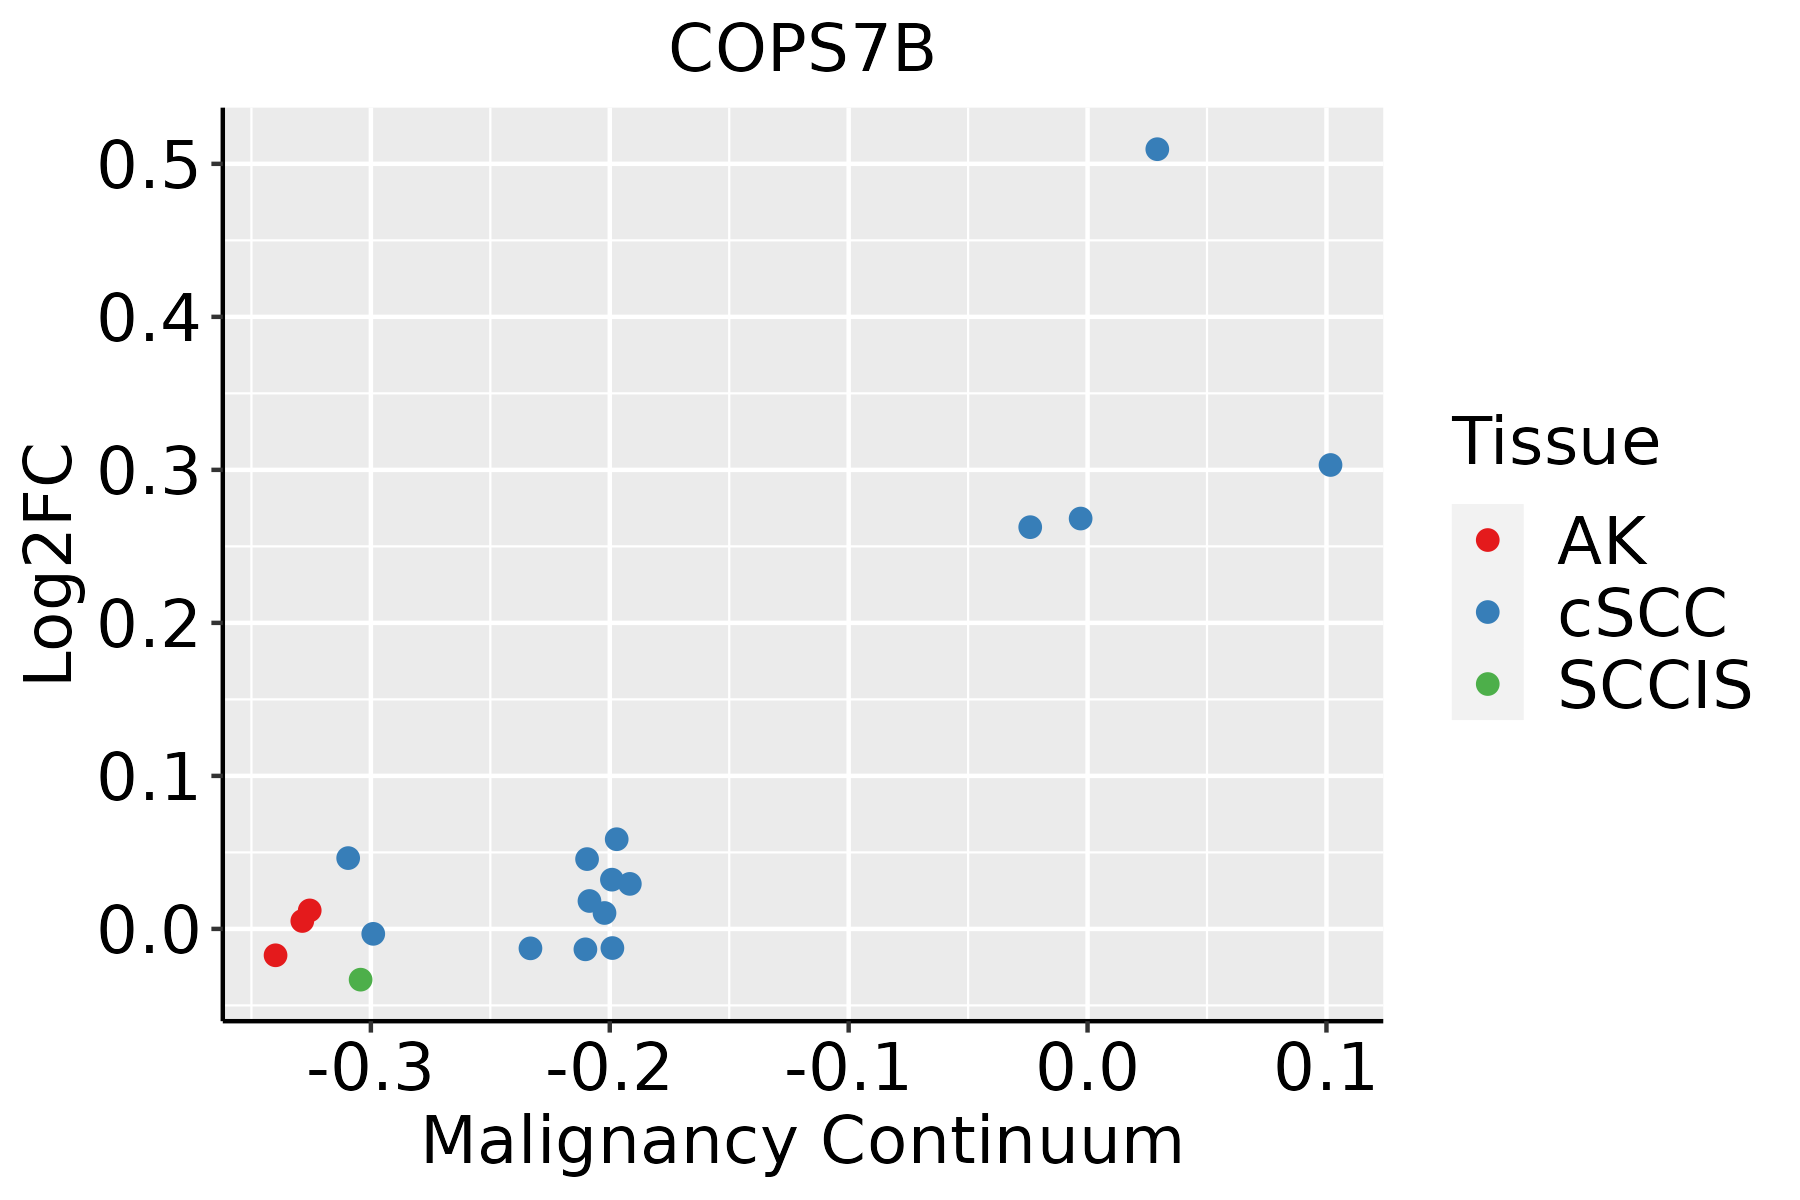 | AK: Actinic keratosis |
| cSCC: Cutaneous squamous cell carcinoma | ||
| SCCIS:squamous cell carcinoma in situ |
| ∗log2FC in expression of this searched gene in stem-like cells from each diseased tissue sample relative to stem-like cells in normal samples in each tissue plotted against the malignancy continuum. Samples are colored based on if they are from different disease stage. |
Top |
Malignant transformation related pathway analysis |
| Find out the enriched GO biological processes and KEGG pathways involved in transition from healthy to precancer to cancer |
| Tissue | Disease Stage | Enriched GO biological Processes |
| Colorectum | AD |  |
| Colorectum | SER |  |
| Colorectum | MSS |  |
| Colorectum | MSI-H |  |
| Colorectum | FAP |  |
| ∗Top 15 enriched GO BP terms are showed in the bar plot of each disease state in each tissue. Each row represents a significant GO biological process which is colored according to the -log10(p.adjust). |
| Page: 1 2 3 4 5 6 7 8 9 |
| GO ID | Tissue | Disease Stage | Description | Gene Ratio | Bg Ratio | pvalue | p.adjust | Count |
| GO:007064612 | Esophagus | ESCC | protein modification by small protein removal | 95/8552 | 157/18723 | 1.25e-04 | 8.56e-04 | 95 |
| GO:000033812 | Esophagus | ESCC | protein deneddylation | 10/8552 | 10/18723 | 3.94e-04 | 2.26e-03 | 10 |
| GO:00706461 | Liver | HCC | protein modification by small protein removal | 91/7958 | 157/18723 | 6.50e-05 | 5.92e-04 | 91 |
| GO:00003381 | Liver | HCC | protein deneddylation | 9/7958 | 10/18723 | 2.79e-03 | 1.31e-02 | 9 |
| GO:00003382 | Oral cavity | OSCC | protein deneddylation | 10/7305 | 10/18723 | 8.14e-05 | 6.26e-04 | 10 |
| GO:00706462 | Oral cavity | OSCC | protein modification by small protein removal | 77/7305 | 157/18723 | 6.55e-03 | 2.43e-02 | 77 |
| GO:000033811 | Oral cavity | LP | protein deneddylation | 9/4623 | 10/18723 | 2.64e-05 | 4.21e-04 | 9 |
| GO:00003384 | Skin | cSCC | protein deneddylation | 10/4864 | 10/18723 | 1.39e-06 | 2.40e-05 | 10 |
| GO:00706464 | Skin | cSCC | protein modification by small protein removal | 55/4864 | 157/18723 | 7.29e-03 | 3.46e-02 | 55 |
| Page: 1 |
| Pathway ID | Tissue | Disease Stage | Description | Gene Ratio | Bg Ratio | pvalue | p.adjust | qvalue | Count |
| Page: 1 |
Top |
Cell-cell communication analysis |
| Identification of potential cell-cell interactions between two cell types and their ligand-receptor pairs for different disease states |
| Ligand | Receptor | LRpair | Pathway | Tissue | Disease Stage |
| Page: 1 |
Top |
Single-cell gene regulatory network inference analysis |
| Find out the significant the regulons (TFs) and the target genes of each regulon across cell types for different disease states |
| TF | Cell Type | Tissue | Disease Stage | Target Gene | RSS | Regulon Activity |
| ∗The dot plots of a searched regulon are shown for all cell subpopulations in each disease state of each tissue based on the regulon specific score inferred using pySCENIC and by calculating the average expression. |
| Page: 1 |
Top |
Somatic mutation of malignant transformation related genes |
| Annotation of somatic variants for genes involved in malignant transformation |
| Hugo Symbol | Variant Class | Variant Classification | dbSNP RS | HGVSc | HGVSp | HGVSp Short | SWISSPROT | BIOTYPE | SIFT | PolyPhen | Tumor Sample Barcode | Tissue | Histology | Sex | Age | Stage | Therapy Types | Drugs | Outcome |
| COPS7B | SNV | Missense_Mutation | c.112C>T | p.Pro38Ser | p.P38S | protein_coding | deleterious(0.04) | possibly_damaging(0.749) | TCGA-A1-A0SP-01 | Breast | breast invasive carcinoma | Female | <65 | I/II | Chemotherapy | SD | |||
| COPS7B | insertion | Frame_Shift_Ins | novel | c.162_162+1insCTTGCGGAAGGAGCTAATGCTGCTTATTTGCAGTTGTT | p.Leu67PhefsTer14 | p.L67Ffs*14 | protein_coding | TCGA-ZJ-AAXB-01 | Cervix | cervical & endocervical cancer | Female | <65 | I/II | Unknown | Unknown | SD | |||
| COPS7B | SNV | Missense_Mutation | c.391C>A | p.Leu131Ile | p.L131I | protein_coding | tolerated(0.06) | possibly_damaging(0.822) | TCGA-CM-6171-01 | Colorectum | colon adenocarcinoma | Female | >=65 | I/II | Unknown | Unknown | SD | ||
| COPS7B | SNV | Missense_Mutation | c.115N>A | p.Gly39Arg | p.G39R | protein_coding | deleterious(0) | possibly_damaging(0.721) | TCGA-WS-AB45-01 | Colorectum | colon adenocarcinoma | Female | <65 | I/II | Unknown | Unknown | SD | ||
| COPS7B | SNV | Missense_Mutation | rs774931366 | c.154N>A | p.Val52Met | p.V52M | protein_coding | deleterious(0) | probably_damaging(0.982) | TCGA-AJ-A3EL-01 | Endometrium | uterine corpus endometrioid carcinoma | Female | <65 | I/II | Unknown | Unknown | SD | |
| COPS7B | SNV | Missense_Mutation | novel | c.328N>C | p.Cys110Arg | p.C110R | protein_coding | tolerated(0.08) | benign(0.007) | TCGA-AP-A05O-01 | Endometrium | uterine corpus endometrioid carcinoma | Female | >=65 | I/II | Chemotherapy | carboplatin | PD | |
| COPS7B | SNV | Missense_Mutation | c.266G>A | p.Ser89Asn | p.S89N | protein_coding | deleterious(0.04) | benign(0.079) | TCGA-AX-A0J1-01 | Endometrium | uterine corpus endometrioid carcinoma | Female | >=65 | I/II | Unknown | Unknown | SD | ||
| COPS7B | SNV | Missense_Mutation | novel | c.181N>T | p.Ala61Ser | p.A61S | protein_coding | tolerated(0.23) | benign(0.036) | TCGA-AX-A1CE-01 | Endometrium | uterine corpus endometrioid carcinoma | Female | <65 | I/II | Unspecific | Paclitaxel | SD | |
| COPS7B | SNV | Missense_Mutation | novel | c.404N>A | p.Ala135Asp | p.A135D | protein_coding | deleterious(0) | probably_damaging(0.974) | TCGA-B5-A3FA-01 | Endometrium | uterine corpus endometrioid carcinoma | Female | >=65 | I/II | Unknown | Unknown | SD | |
| COPS7B | SNV | Missense_Mutation | novel | c.290N>C | p.Lys97Thr | p.K97T | protein_coding | deleterious(0.01) | possibly_damaging(0.802) | TCGA-EO-A22U-01 | Endometrium | uterine corpus endometrioid carcinoma | Female | >=65 | I/II | Unknown | Unknown | SD |
| Page: 1 2 |
Top |
Related drugs of malignant transformation related genes |
| Identification of chemicals and drugs interact with genes involved in malignant transfromation |
| (DGIdb 4.0) |
| Entrez ID | Symbol | Category | Interaction Types | Drug Claim Name | Drug Name | PMIDs |
| Page: 1 |

Copyright 2023-Present -The University of Texas Health Science Center at Houston |