
|
|||||
|
 | |
| |
| |
| |
| |
| |
|
Gene: COPS3 |
Gene summary for COPS3 |
| Gene information | Species | Human | Gene symbol | COPS3 | Gene ID | 8533 |
| Gene name | COP9 signalosome subunit 3 | |
| Gene Alias | CSN3 | |
| Cytomap | 17p11.2 | |
| Gene Type | protein-coding | GO ID | GO:0000338 | UniProtAcc | Q9UNS2 |
Top |
Malignant transformation analysis |
| Identification of the aberrant gene expression in precancerous and cancerous lesions by comparing the gene expression of stem-like cells in diseased tissues with normal stem cells |
| Entrez ID | Symbol | Replicates | Species | Organ | Tissue | Adj P-value | Log2FC | Malignancy |
| 8533 | COPS3 | LZE4T | Human | Esophagus | ESCC | 7.38e-17 | 5.02e-01 | 0.0811 |
| 8533 | COPS3 | LZE7T | Human | Esophagus | ESCC | 8.90e-06 | 7.10e-01 | 0.0667 |
| 8533 | COPS3 | LZE8T | Human | Esophagus | ESCC | 4.59e-10 | 2.02e-01 | 0.067 |
| 8533 | COPS3 | LZE20T | Human | Esophagus | ESCC | 8.39e-04 | -1.79e-02 | 0.0662 |
| 8533 | COPS3 | LZE22D1 | Human | Esophagus | HGIN | 4.62e-05 | -4.91e-02 | 0.0595 |
| 8533 | COPS3 | LZE24T | Human | Esophagus | ESCC | 9.34e-20 | 7.70e-01 | 0.0596 |
| 8533 | COPS3 | LZE21T | Human | Esophagus | ESCC | 1.03e-02 | 2.41e-01 | 0.0655 |
| 8533 | COPS3 | LZE6T | Human | Esophagus | ESCC | 5.78e-07 | 4.72e-01 | 0.0845 |
| 8533 | COPS3 | P1T-E | Human | Esophagus | ESCC | 9.36e-05 | 3.02e-01 | 0.0875 |
| 8533 | COPS3 | P2T-E | Human | Esophagus | ESCC | 1.50e-24 | 7.46e-01 | 0.1177 |
| 8533 | COPS3 | P4T-E | Human | Esophagus | ESCC | 4.99e-39 | 1.13e+00 | 0.1323 |
| 8533 | COPS3 | P5T-E | Human | Esophagus | ESCC | 9.43e-17 | 2.62e-01 | 0.1327 |
| 8533 | COPS3 | P8T-E | Human | Esophagus | ESCC | 1.90e-20 | 6.00e-01 | 0.0889 |
| 8533 | COPS3 | P9T-E | Human | Esophagus | ESCC | 2.50e-15 | 3.87e-01 | 0.1131 |
| 8533 | COPS3 | P10T-E | Human | Esophagus | ESCC | 3.94e-29 | 6.14e-01 | 0.116 |
| 8533 | COPS3 | P11T-E | Human | Esophagus | ESCC | 3.51e-12 | 7.14e-01 | 0.1426 |
| 8533 | COPS3 | P12T-E | Human | Esophagus | ESCC | 4.56e-34 | 8.23e-01 | 0.1122 |
| 8533 | COPS3 | P15T-E | Human | Esophagus | ESCC | 9.16e-27 | 5.10e-01 | 0.1149 |
| 8533 | COPS3 | P16T-E | Human | Esophagus | ESCC | 7.77e-34 | 8.72e-01 | 0.1153 |
| 8533 | COPS3 | P17T-E | Human | Esophagus | ESCC | 1.95e-11 | 5.44e-01 | 0.1278 |
| Page: 1 2 3 4 5 |
| Tissue | Expression Dynamics | Abbreviation |
| Esophagus | 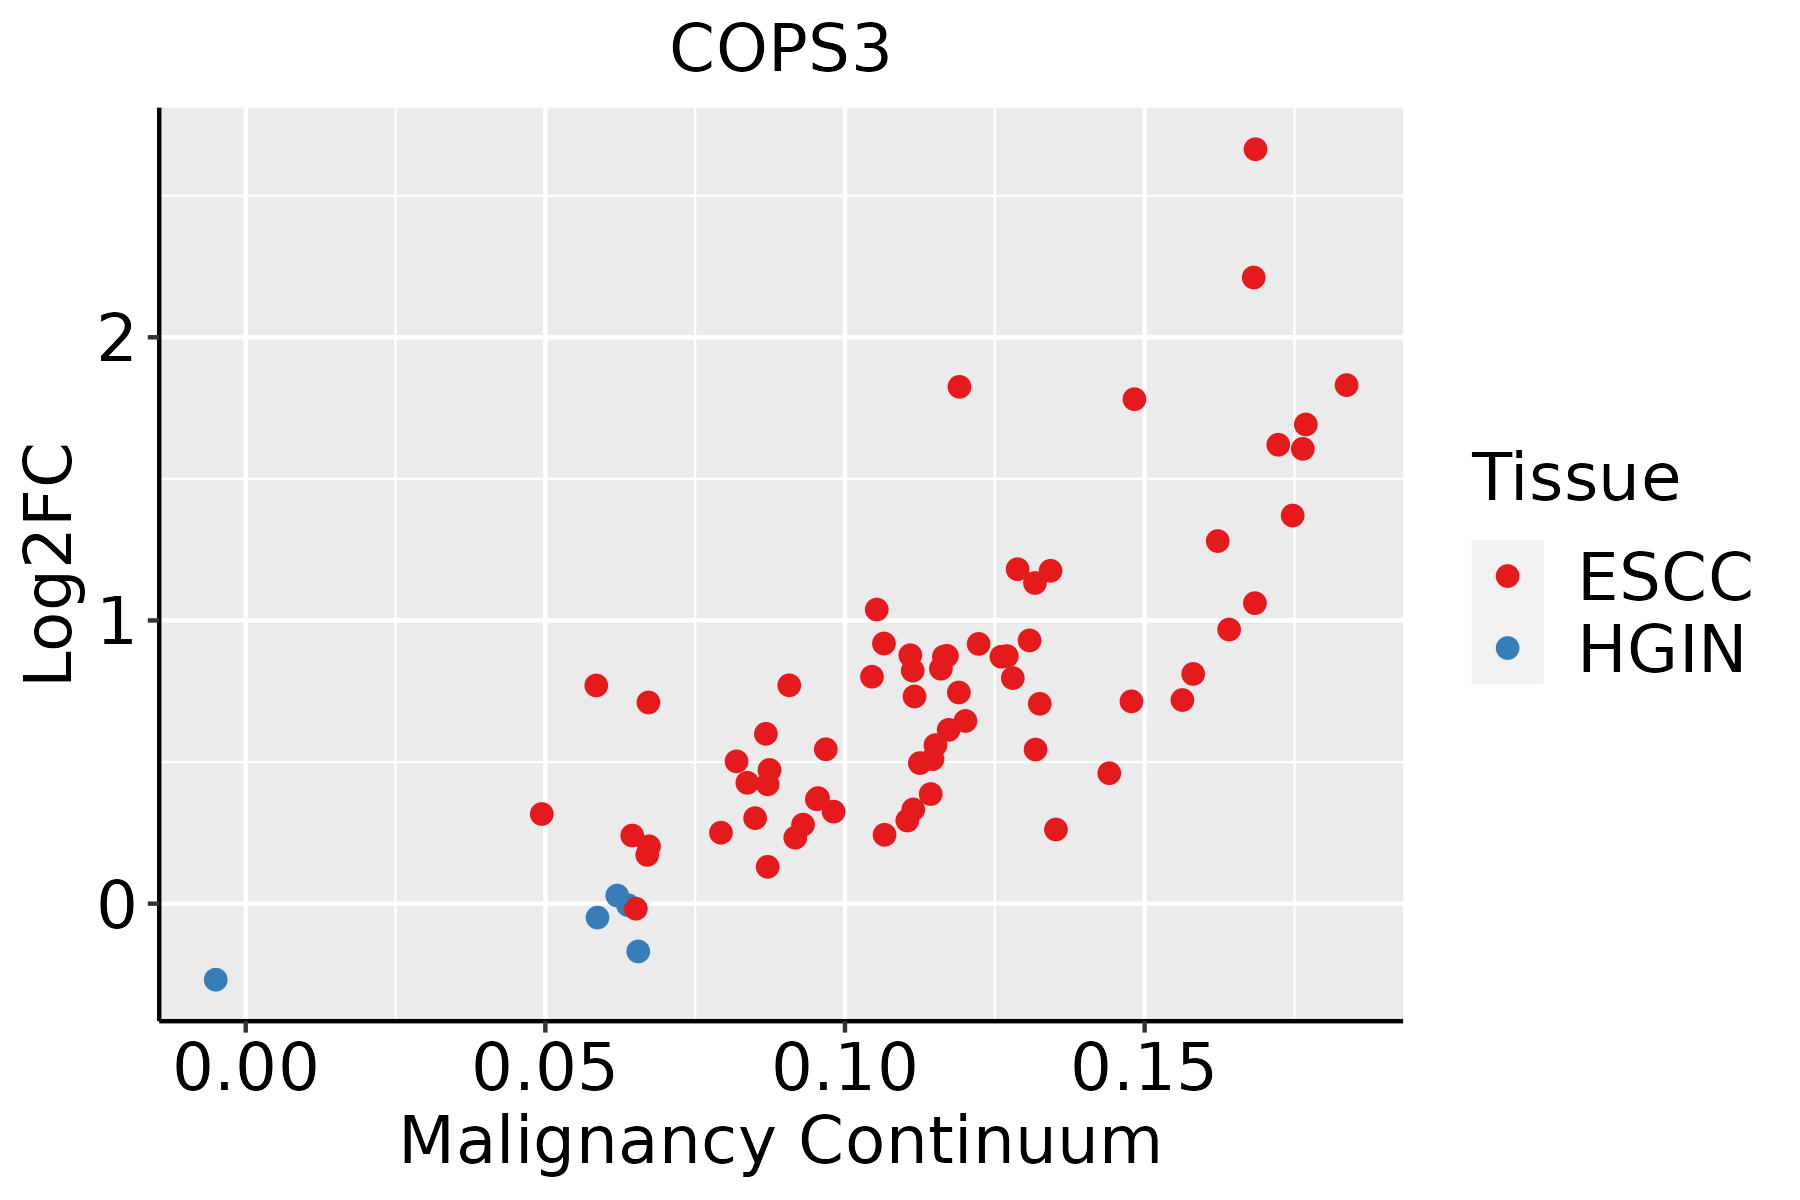 | ESCC: Esophageal squamous cell carcinoma |
| HGIN: High-grade intraepithelial neoplasias | ||
| LGIN: Low-grade intraepithelial neoplasias | ||
| Liver |  | HCC: Hepatocellular carcinoma |
| NAFLD: Non-alcoholic fatty liver disease | ||
| Oral Cavity | 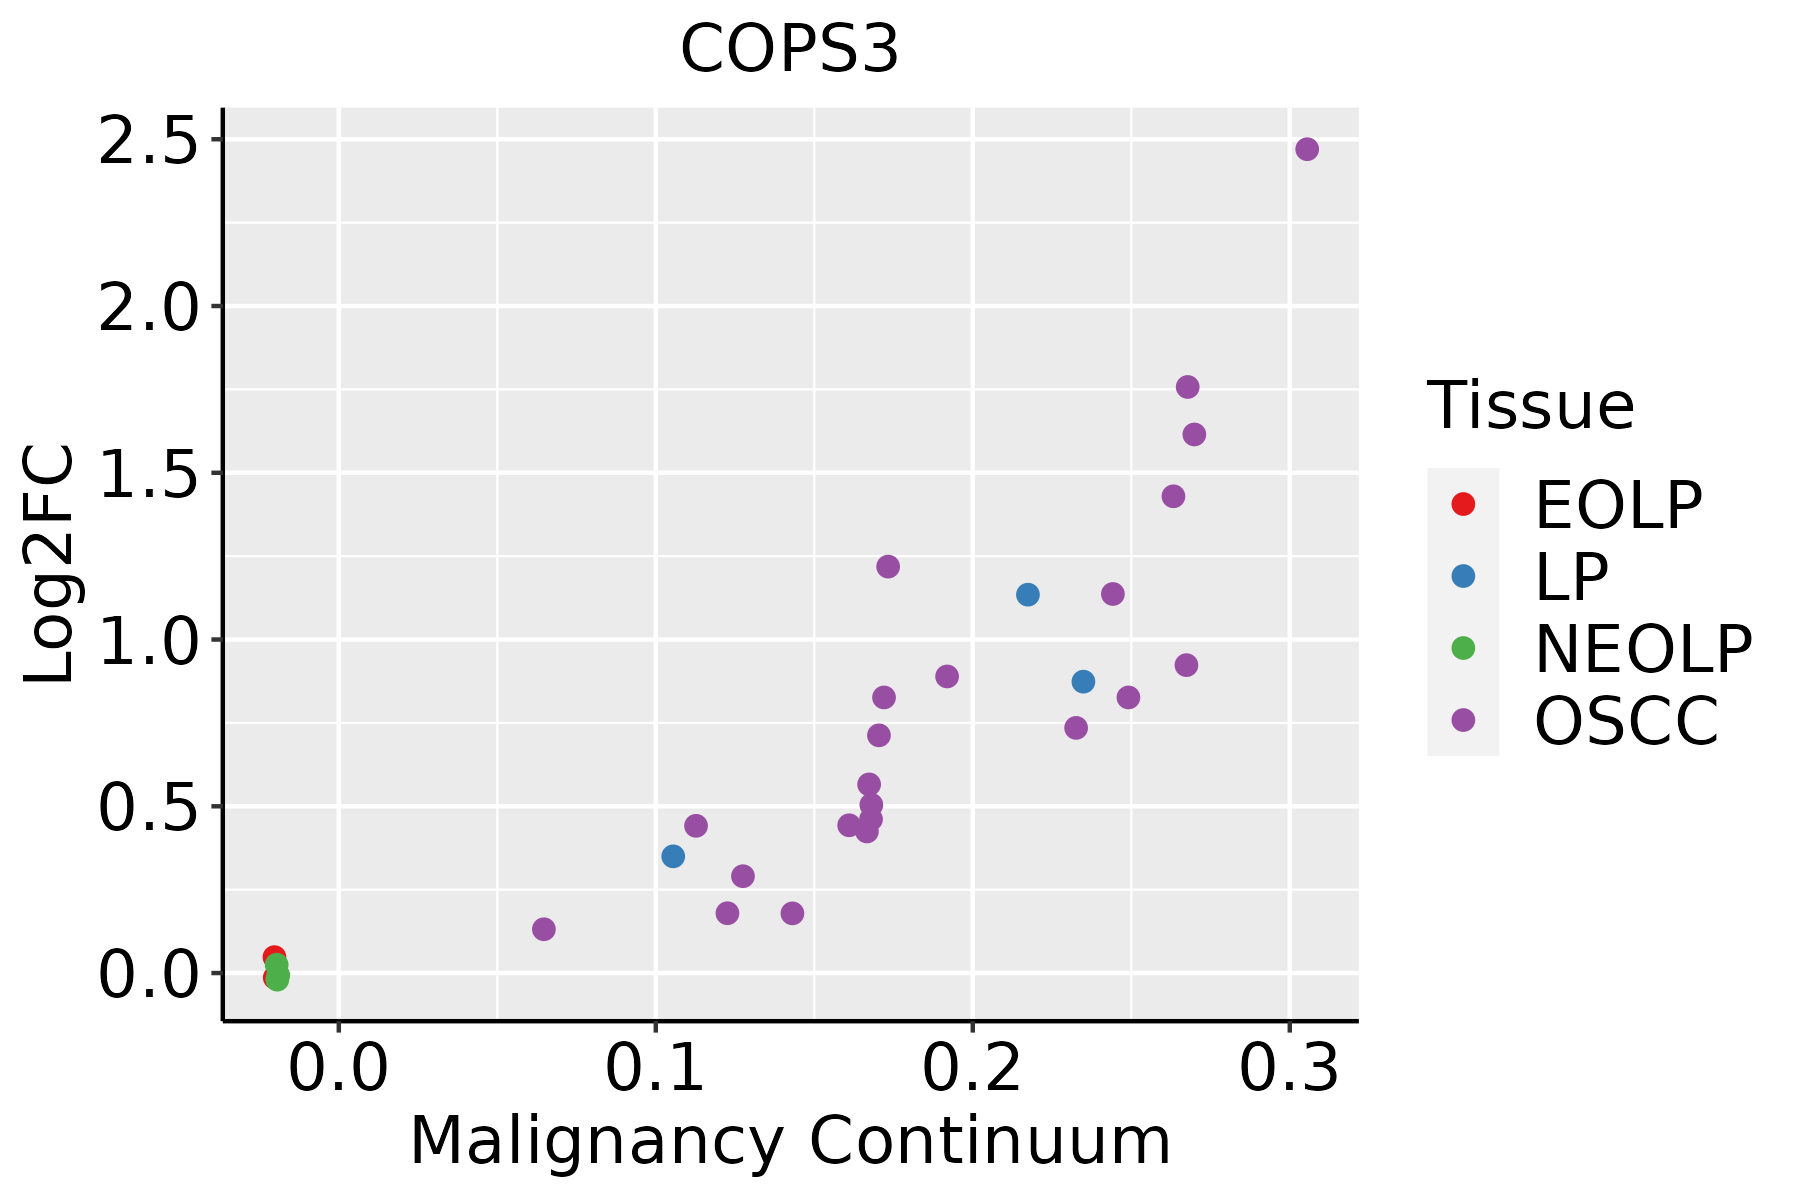 | EOLP: Erosive Oral lichen planus |
| LP: leukoplakia | ||
| NEOLP: Non-erosive oral lichen planus | ||
| OSCC: Oral squamous cell carcinoma | ||
| Skin | 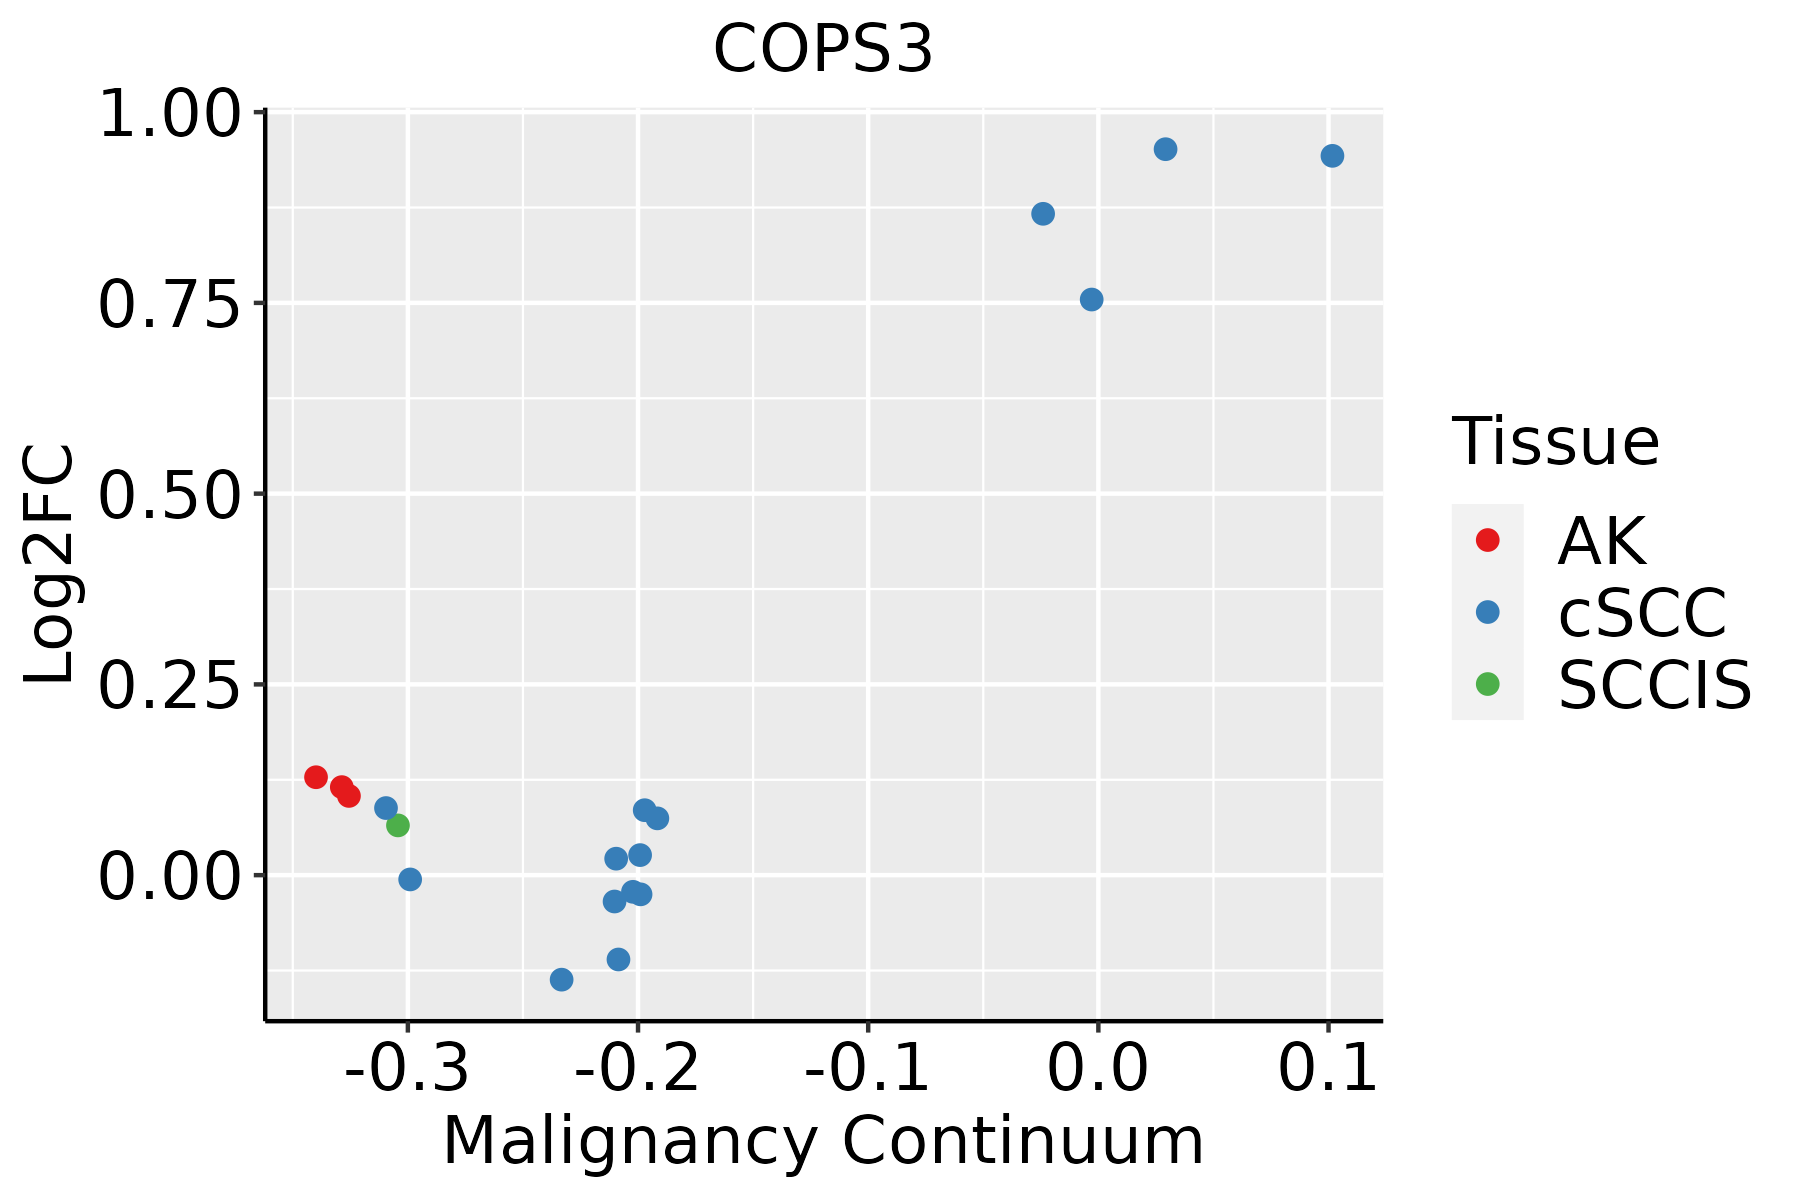 | AK: Actinic keratosis |
| cSCC: Cutaneous squamous cell carcinoma | ||
| SCCIS:squamous cell carcinoma in situ |
| ∗log2FC in expression of this searched gene in stem-like cells from each diseased tissue sample relative to stem-like cells in normal samples in each tissue plotted against the malignancy continuum. Samples are colored based on if they are from different disease stage. |
Top |
Malignant transformation related pathway analysis |
| Find out the enriched GO biological processes and KEGG pathways involved in transition from healthy to precancer to cancer |
| Tissue | Disease Stage | Enriched GO biological Processes |
| Colorectum | AD |  |
| Colorectum | SER |  |
| Colorectum | MSS |  |
| Colorectum | MSI-H |  |
| Colorectum | FAP |  |
| ∗Top 15 enriched GO BP terms are showed in the bar plot of each disease state in each tissue. Each row represents a significant GO biological process which is colored according to the -log10(p.adjust). |
| Page: 1 2 3 4 5 6 7 8 9 |
| GO ID | Tissue | Disease Stage | Description | Gene Ratio | Bg Ratio | pvalue | p.adjust | Count |
| GO:000170118 | Esophagus | HGIN | in utero embryonic development | 77/2587 | 367/18723 | 9.56e-05 | 2.05e-03 | 77 |
| GO:000931418 | Esophagus | HGIN | response to radiation | 88/2587 | 456/18723 | 6.26e-04 | 8.65e-03 | 88 |
| GO:00003383 | Esophagus | HGIN | protein deneddylation | 6/2587 | 10/18723 | 8.81e-04 | 1.13e-02 | 6 |
| GO:00706463 | Esophagus | HGIN | protein modification by small protein removal | 34/2587 | 157/18723 | 4.68e-03 | 4.02e-02 | 34 |
| GO:00094165 | Esophagus | HGIN | response to light stimulus | 61/2587 | 320/18723 | 5.20e-03 | 4.30e-02 | 61 |
| GO:000170119 | Esophagus | ESCC | in utero embryonic development | 243/8552 | 367/18723 | 1.00e-15 | 6.86e-14 | 243 |
| GO:000931419 | Esophagus | ESCC | response to radiation | 277/8552 | 456/18723 | 4.42e-11 | 1.43e-09 | 277 |
| GO:000941611 | Esophagus | ESCC | response to light stimulus | 183/8552 | 320/18723 | 2.03e-05 | 1.76e-04 | 183 |
| GO:007064612 | Esophagus | ESCC | protein modification by small protein removal | 95/8552 | 157/18723 | 1.25e-04 | 8.56e-04 | 95 |
| GO:000033812 | Esophagus | ESCC | protein deneddylation | 10/8552 | 10/18723 | 3.94e-04 | 2.26e-03 | 10 |
| GO:00017015 | Liver | Cirrhotic | in utero embryonic development | 134/4634 | 367/18723 | 2.78e-07 | 6.86e-06 | 134 |
| GO:0000338 | Liver | Cirrhotic | protein deneddylation | 7/4634 | 10/18723 | 3.29e-03 | 1.83e-02 | 7 |
| GO:000170111 | Liver | HCC | in utero embryonic development | 204/7958 | 367/18723 | 2.44e-07 | 4.30e-06 | 204 |
| GO:00706461 | Liver | HCC | protein modification by small protein removal | 91/7958 | 157/18723 | 6.50e-05 | 5.92e-04 | 91 |
| GO:00003381 | Liver | HCC | protein deneddylation | 9/7958 | 10/18723 | 2.79e-03 | 1.31e-02 | 9 |
| GO:00093146 | Liver | HCC | response to radiation | 223/7958 | 456/18723 | 3.08e-03 | 1.43e-02 | 223 |
| GO:000170116 | Oral cavity | OSCC | in utero embryonic development | 207/7305 | 367/18723 | 7.92e-12 | 2.95e-10 | 207 |
| GO:000931416 | Oral cavity | OSCC | response to radiation | 241/7305 | 456/18723 | 9.76e-10 | 2.40e-08 | 241 |
| GO:00094164 | Oral cavity | OSCC | response to light stimulus | 159/7305 | 320/18723 | 5.98e-05 | 4.92e-04 | 159 |
| GO:00003382 | Oral cavity | OSCC | protein deneddylation | 10/7305 | 10/18723 | 8.14e-05 | 6.26e-04 | 10 |
| Page: 1 2 |
| Pathway ID | Tissue | Disease Stage | Description | Gene Ratio | Bg Ratio | pvalue | p.adjust | qvalue | Count |
| Page: 1 |
Top |
Cell-cell communication analysis |
| Identification of potential cell-cell interactions between two cell types and their ligand-receptor pairs for different disease states |
| Ligand | Receptor | LRpair | Pathway | Tissue | Disease Stage |
| Page: 1 |
Top |
Single-cell gene regulatory network inference analysis |
| Find out the significant the regulons (TFs) and the target genes of each regulon across cell types for different disease states |
| TF | Cell Type | Tissue | Disease Stage | Target Gene | RSS | Regulon Activity |
| ∗The dot plots of a searched regulon are shown for all cell subpopulations in each disease state of each tissue based on the regulon specific score inferred using pySCENIC and by calculating the average expression. |
| Page: 1 |
Top |
Somatic mutation of malignant transformation related genes |
| Annotation of somatic variants for genes involved in malignant transformation |
| Hugo Symbol | Variant Class | Variant Classification | dbSNP RS | HGVSc | HGVSp | HGVSp Short | SWISSPROT | BIOTYPE | SIFT | PolyPhen | Tumor Sample Barcode | Tissue | Histology | Sex | Age | Stage | Therapy Types | Drugs | Outcome |
| COPS3 | SNV | Missense_Mutation | c.527N>G | p.Tyr176Cys | p.Y176C | Q9UNS2 | protein_coding | tolerated(0.07) | benign(0.007) | TCGA-A8-A06X-01 | Breast | breast invasive carcinoma | Female | >=65 | I/II | Unknown | Unknown | SD | |
| COPS3 | SNV | Missense_Mutation | c.387N>A | p.Asp129Glu | p.D129E | Q9UNS2 | protein_coding | tolerated(1) | benign(0.001) | TCGA-BH-A18V-01 | Breast | breast invasive carcinoma | Female | <65 | I/II | Unknown | Unknown | SD | |
| COPS3 | SNV | Missense_Mutation | novel | c.842N>G | p.Lys281Arg | p.K281R | Q9UNS2 | protein_coding | deleterious(0.03) | benign(0.03) | TCGA-C8-A12M-01 | Breast | breast invasive carcinoma | Female | >=65 | I/II | Unknown | Unknown | SD |
| COPS3 | SNV | Missense_Mutation | c.797N>C | p.Val266Ala | p.V266A | Q9UNS2 | protein_coding | tolerated(1) | benign(0) | TCGA-D8-A140-01 | Breast | breast invasive carcinoma | Female | <65 | I/II | Chemotherapy | doxorubicin+cyclophosphamid | SD | |
| COPS3 | SNV | Missense_Mutation | c.430G>C | p.Asp144His | p.D144H | Q9UNS2 | protein_coding | deleterious(0.01) | possibly_damaging(0.71) | TCGA-EW-A1J5-01 | Breast | breast invasive carcinoma | Female | <65 | I/II | Chemotherapy | adriamycin | SD | |
| COPS3 | insertion | Frame_Shift_Ins | novel | c.1031_1032insA | p.Asp344GlufsTer3 | p.D344Efs*3 | Q9UNS2 | protein_coding | TCGA-C8-A26Z-01 | Breast | breast invasive carcinoma | Female | <65 | I/II | Hormone Therapy | tamoxiphen | CR | ||
| COPS3 | insertion | Frame_Shift_Ins | novel | c.1029_1030insCCCATCCGAGTGGAATGGAATGGACTGGAATG | p.Asp344ProfsTer49 | p.D344Pfs*49 | Q9UNS2 | protein_coding | TCGA-C8-A26Z-01 | Breast | breast invasive carcinoma | Female | <65 | I/II | Hormone Therapy | tamoxiphen | CR | ||
| COPS3 | deletion | Frame_Shift_Del | novel | c.970delA | p.Ser324ValfsTer18 | p.S324Vfs*18 | Q9UNS2 | protein_coding | TCGA-EW-A2FV-01 | Breast | breast invasive carcinoma | Female | <65 | III/IV | Chemotherapy | docetaxel | SD | ||
| COPS3 | SNV | Missense_Mutation | novel | c.820N>A | p.Glu274Lys | p.E274K | Q9UNS2 | protein_coding | tolerated(0.08) | benign(0.377) | TCGA-EA-A3HU-01 | Cervix | cervical & endocervical cancer | Female | <65 | I/II | Unknown | Unknown | SD |
| COPS3 | SNV | Missense_Mutation | novel | c.818N>T | p.Ser273Leu | p.S273L | Q9UNS2 | protein_coding | tolerated(0.24) | benign(0.015) | TCGA-XS-A8TJ-01 | Cervix | cervical & endocervical cancer | Female | <65 | I/II | Chemotherapy | cisplatin | SD |
| Page: 1 2 3 4 5 |
Top |
Related drugs of malignant transformation related genes |
| Identification of chemicals and drugs interact with genes involved in malignant transfromation |
| (DGIdb 4.0) |
| Entrez ID | Symbol | Category | Interaction Types | Drug Claim Name | Drug Name | PMIDs |
| Page: 1 |

Copyright 2023-Present -The University of Texas Health Science Center at Houston |