
|
|||||
|
 | |
| |
| |
| |
| |
| |
|
Gene: COPS2 |
Gene summary for COPS2 |
| Gene information | Species | Human | Gene symbol | COPS2 | Gene ID | 9318 |
| Gene name | COP9 signalosome subunit 2 | |
| Gene Alias | ALIEN | |
| Cytomap | 15q21.1 | |
| Gene Type | protein-coding | GO ID | GO:0000122 | UniProtAcc | P61201 |
Top |
Malignant transformation analysis |
| Identification of the aberrant gene expression in precancerous and cancerous lesions by comparing the gene expression of stem-like cells in diseased tissues with normal stem cells |
| Entrez ID | Symbol | Replicates | Species | Organ | Tissue | Adj P-value | Log2FC | Malignancy |
| 9318 | COPS2 | LZE4T | Human | Esophagus | ESCC | 1.94e-18 | 7.17e-01 | 0.0811 |
| 9318 | COPS2 | LZE5T | Human | Esophagus | ESCC | 2.18e-03 | 5.40e-01 | 0.0514 |
| 9318 | COPS2 | LZE8T | Human | Esophagus | ESCC | 9.68e-07 | 2.39e-01 | 0.067 |
| 9318 | COPS2 | LZE20T | Human | Esophagus | ESCC | 9.89e-06 | 9.37e-02 | 0.0662 |
| 9318 | COPS2 | LZE22D1 | Human | Esophagus | HGIN | 1.07e-04 | -3.36e-03 | 0.0595 |
| 9318 | COPS2 | LZE24T | Human | Esophagus | ESCC | 7.77e-12 | 3.42e-01 | 0.0596 |
| 9318 | COPS2 | LZE6T | Human | Esophagus | ESCC | 3.26e-05 | 3.62e-01 | 0.0845 |
| 9318 | COPS2 | P1T-E | Human | Esophagus | ESCC | 5.69e-07 | 4.86e-01 | 0.0875 |
| 9318 | COPS2 | P2T-E | Human | Esophagus | ESCC | 2.90e-19 | 2.76e-01 | 0.1177 |
| 9318 | COPS2 | P4T-E | Human | Esophagus | ESCC | 1.81e-36 | 9.99e-01 | 0.1323 |
| 9318 | COPS2 | P5T-E | Human | Esophagus | ESCC | 1.38e-27 | 7.79e-01 | 0.1327 |
| 9318 | COPS2 | P8T-E | Human | Esophagus | ESCC | 1.46e-30 | 6.99e-01 | 0.0889 |
| 9318 | COPS2 | P9T-E | Human | Esophagus | ESCC | 5.81e-23 | 7.63e-01 | 0.1131 |
| 9318 | COPS2 | P10T-E | Human | Esophagus | ESCC | 1.37e-39 | 7.80e-01 | 0.116 |
| 9318 | COPS2 | P11T-E | Human | Esophagus | ESCC | 3.21e-17 | 5.78e-01 | 0.1426 |
| 9318 | COPS2 | P12T-E | Human | Esophagus | ESCC | 1.51e-32 | 8.60e-01 | 0.1122 |
| 9318 | COPS2 | P15T-E | Human | Esophagus | ESCC | 2.30e-51 | 1.25e+00 | 0.1149 |
| 9318 | COPS2 | P16T-E | Human | Esophagus | ESCC | 4.07e-28 | 7.19e-01 | 0.1153 |
| 9318 | COPS2 | P17T-E | Human | Esophagus | ESCC | 6.72e-03 | 4.15e-01 | 0.1278 |
| 9318 | COPS2 | P19T-E | Human | Esophagus | ESCC | 1.99e-09 | 1.23e+00 | 0.1662 |
| Page: 1 2 3 4 5 6 |
| Tissue | Expression Dynamics | Abbreviation |
| Esophagus | 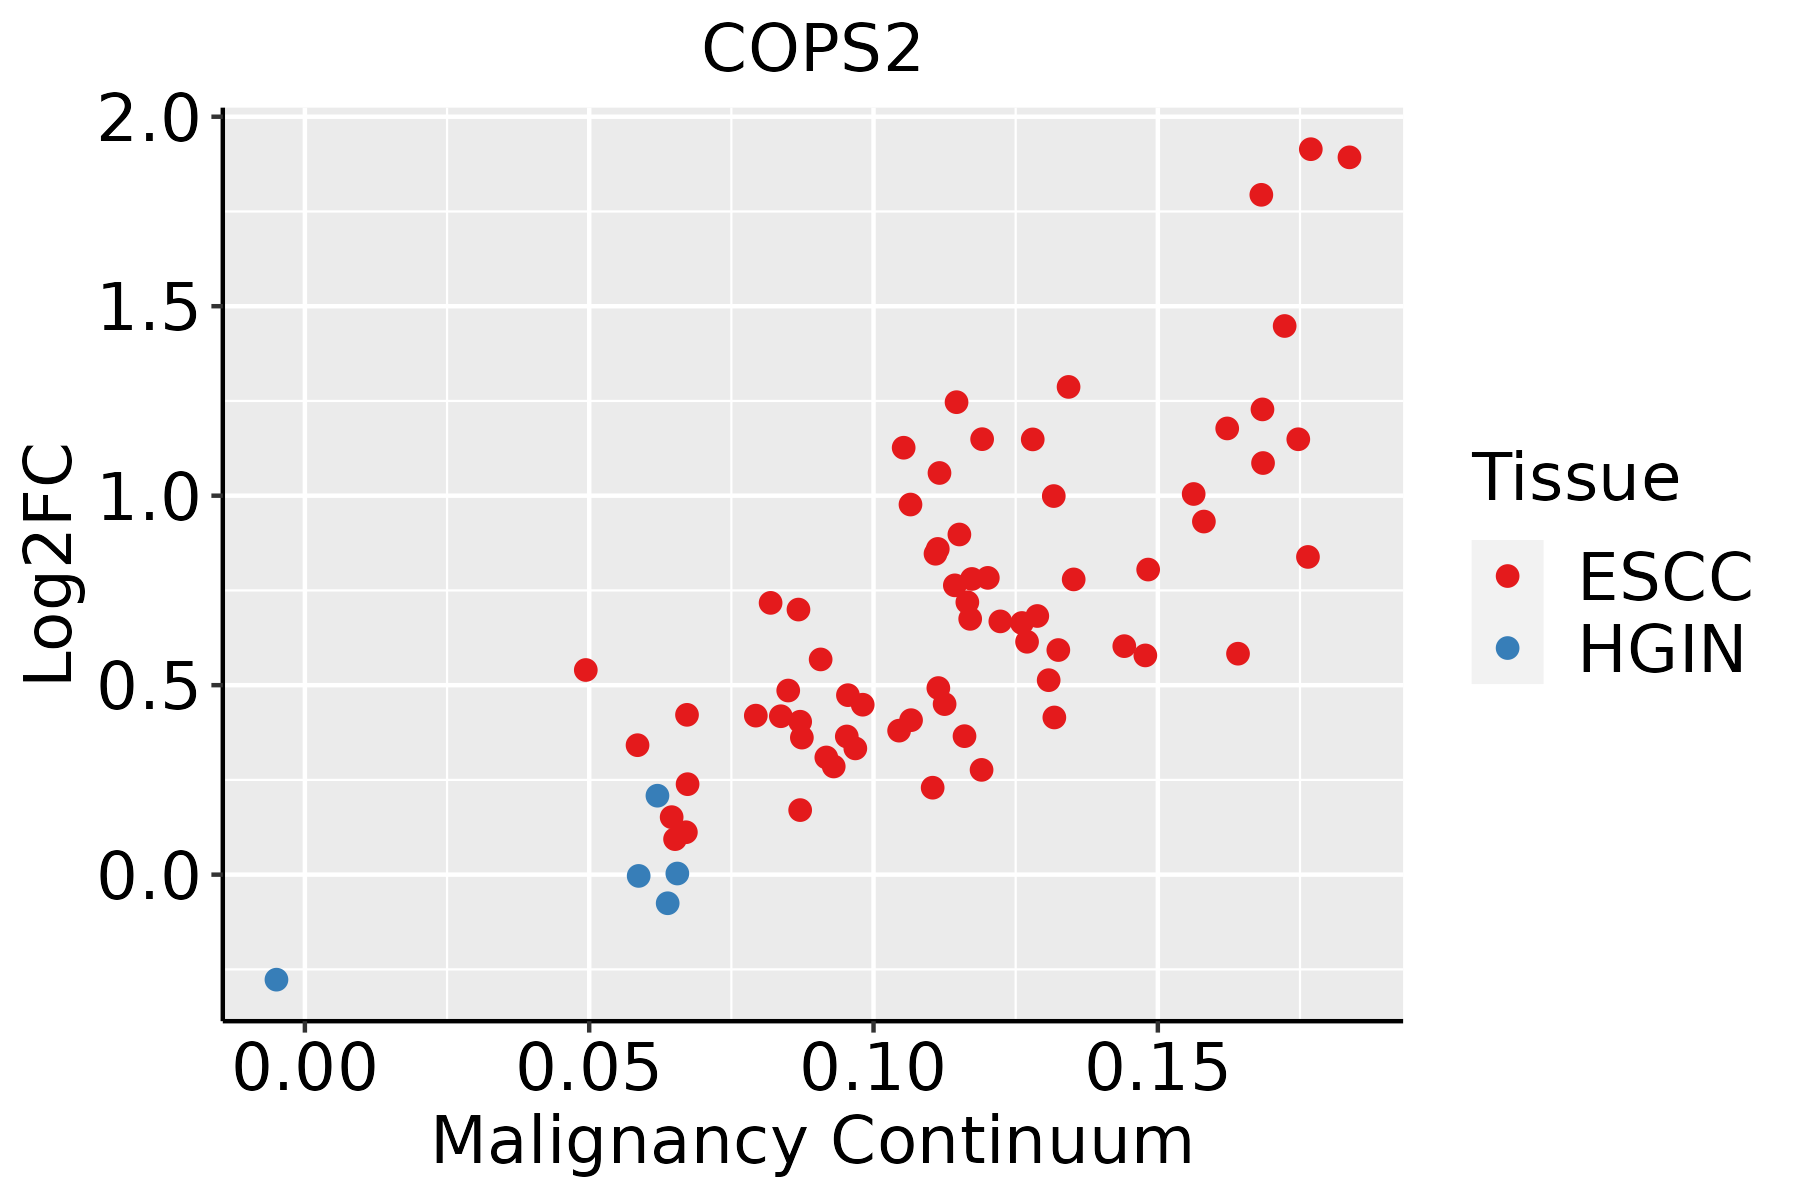 | ESCC: Esophageal squamous cell carcinoma |
| HGIN: High-grade intraepithelial neoplasias | ||
| LGIN: Low-grade intraepithelial neoplasias | ||
| Liver | 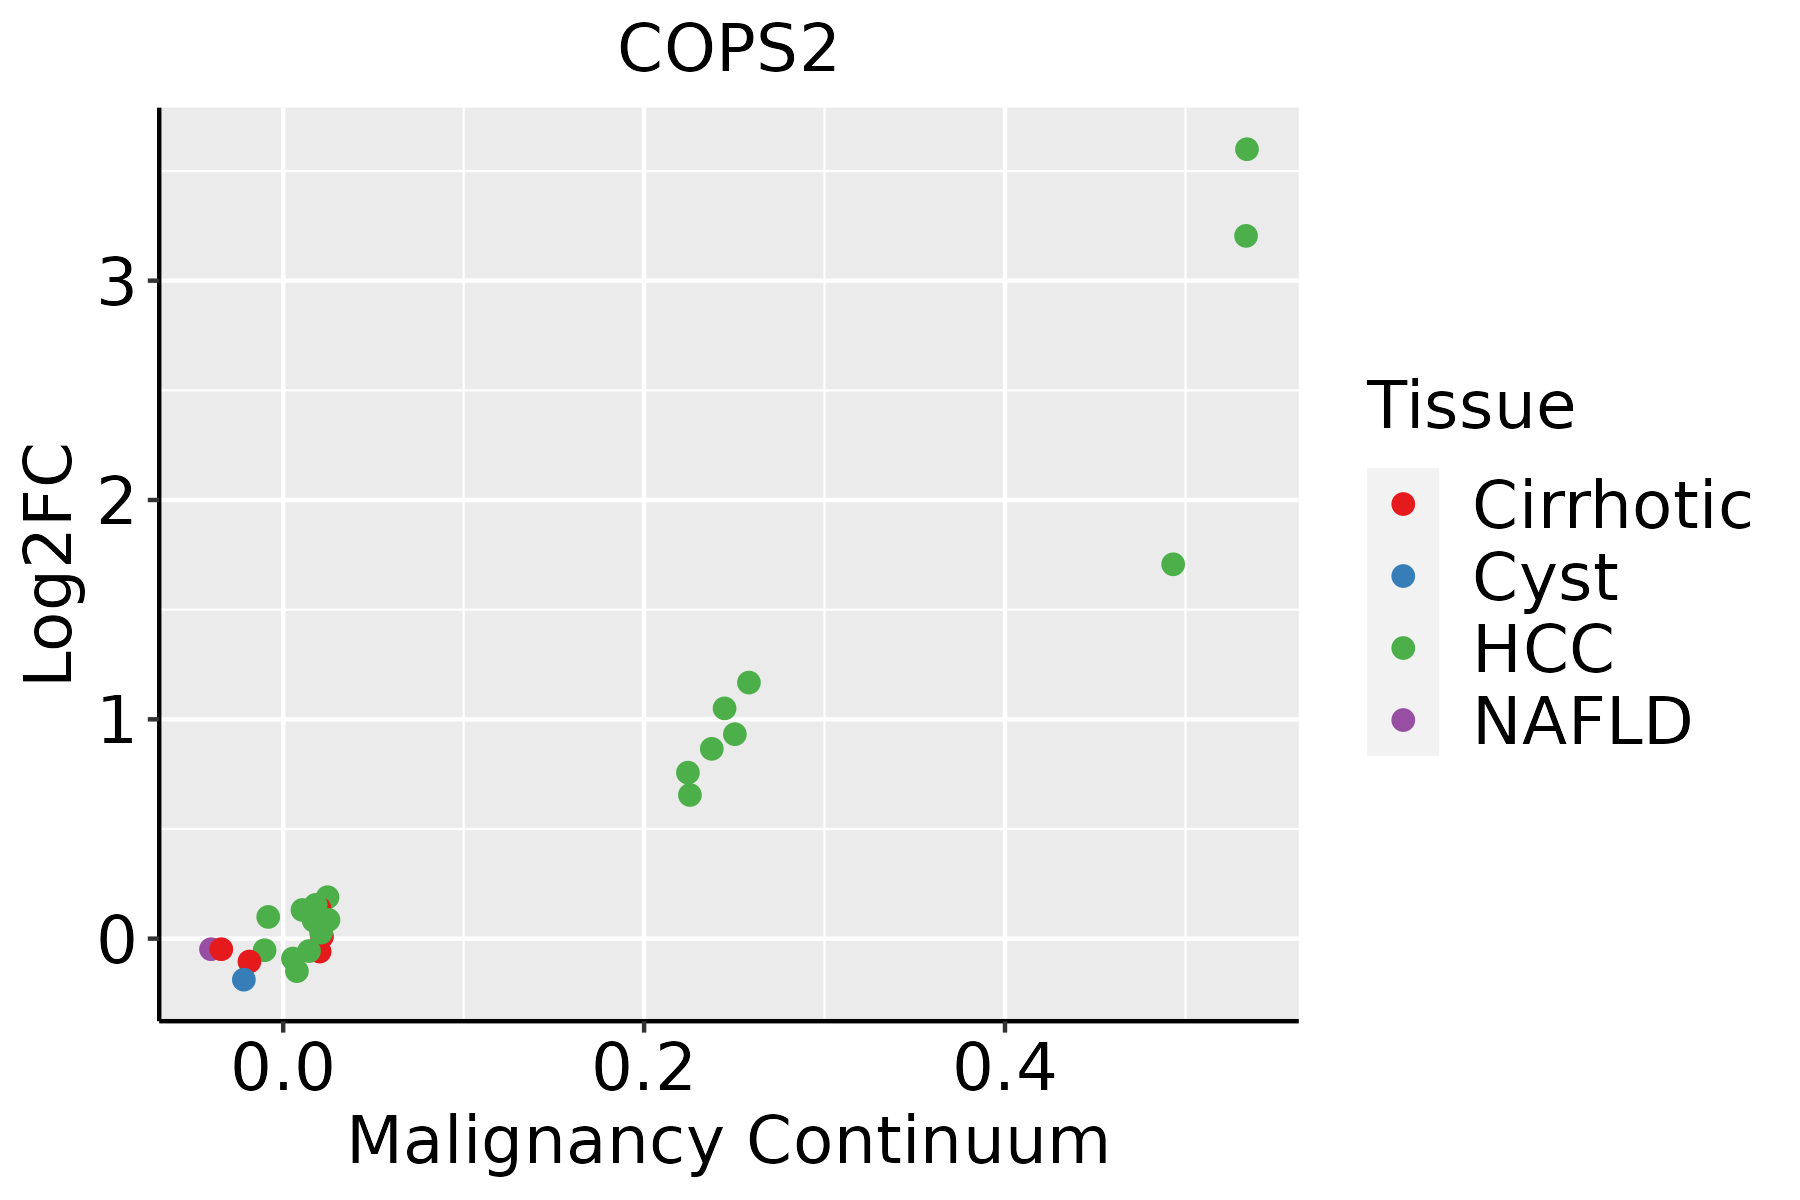 | HCC: Hepatocellular carcinoma |
| NAFLD: Non-alcoholic fatty liver disease | ||
| Oral Cavity |  | EOLP: Erosive Oral lichen planus |
| LP: leukoplakia | ||
| NEOLP: Non-erosive oral lichen planus | ||
| OSCC: Oral squamous cell carcinoma | ||
| Skin | 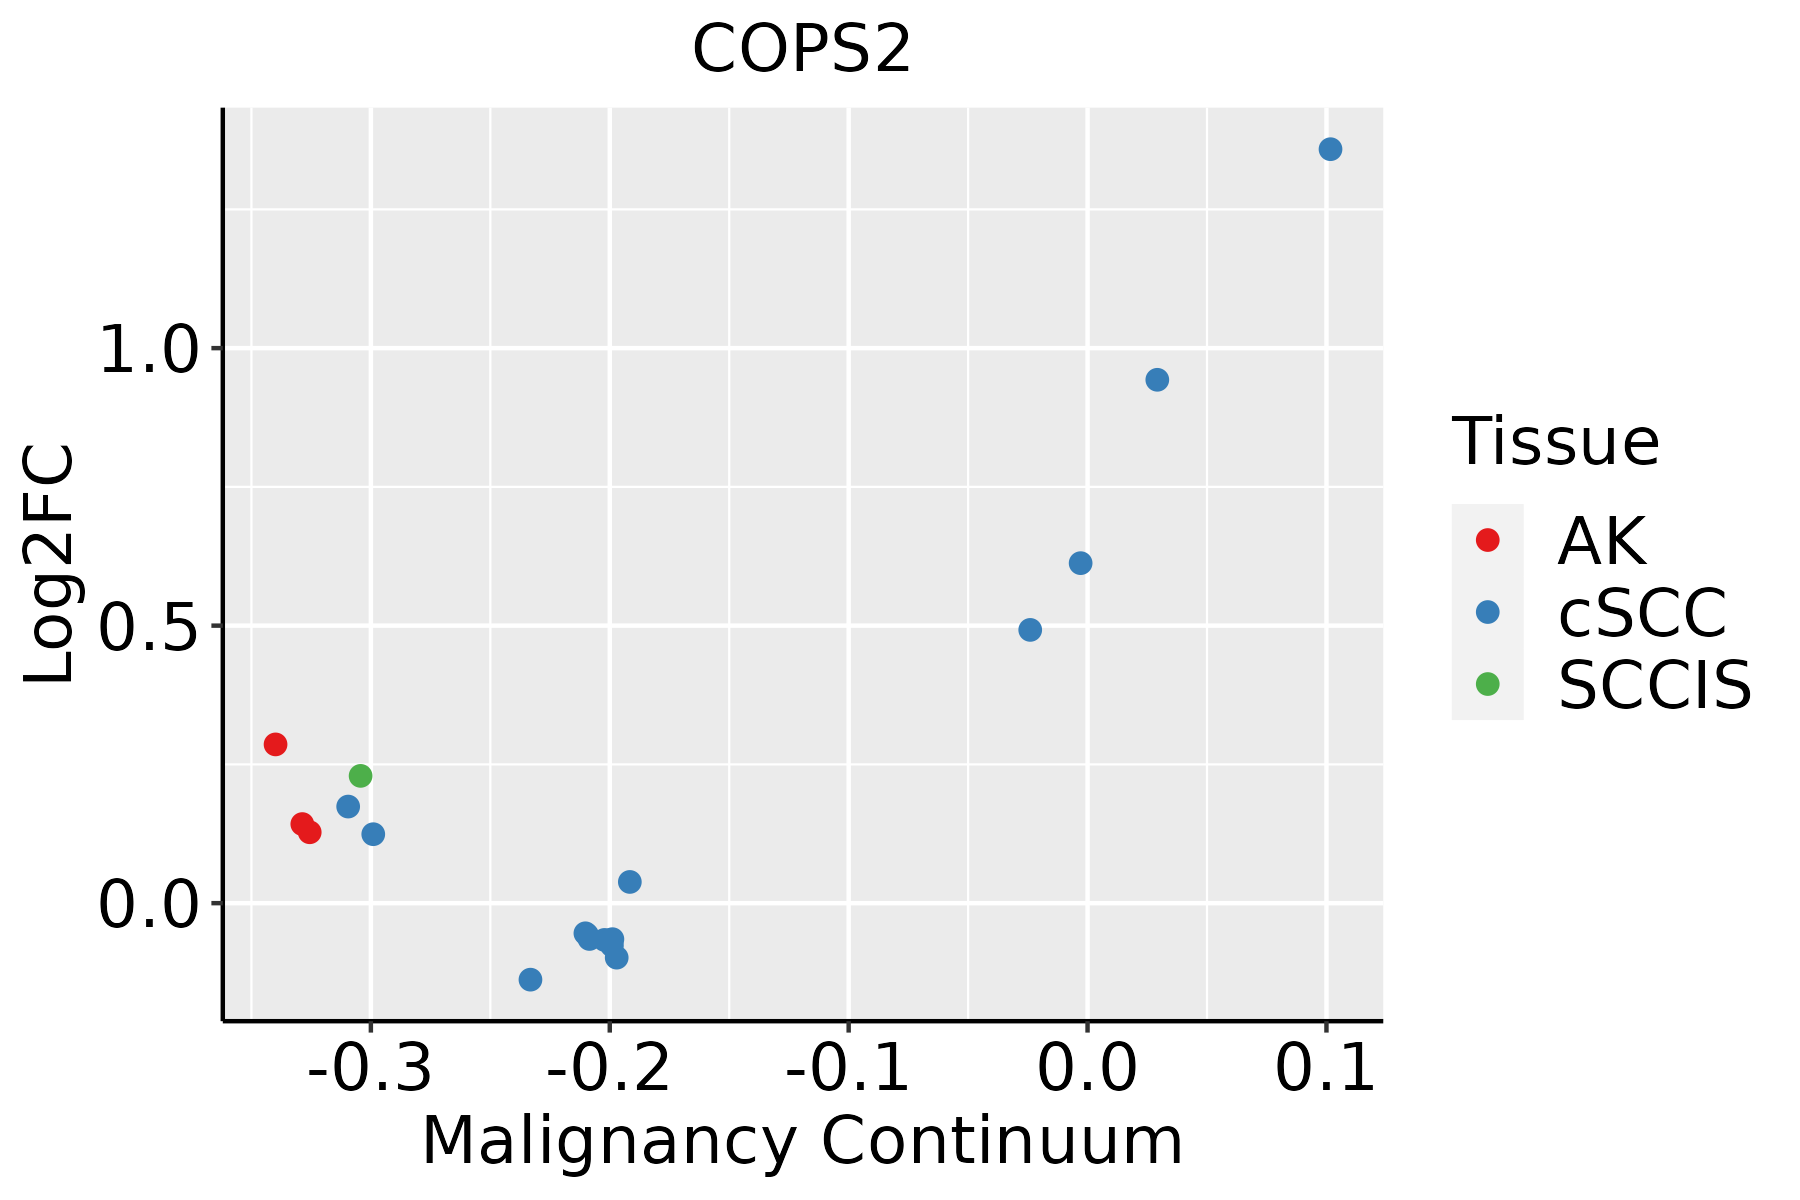 | AK: Actinic keratosis |
| cSCC: Cutaneous squamous cell carcinoma | ||
| SCCIS:squamous cell carcinoma in situ | ||
| Thyroid |  | ATC: Anaplastic thyroid cancer |
| HT: Hashimoto's thyroiditis | ||
| PTC: Papillary thyroid cancer |
| ∗log2FC in expression of this searched gene in stem-like cells from each diseased tissue sample relative to stem-like cells in normal samples in each tissue plotted against the malignancy continuum. Samples are colored based on if they are from different disease stage. |
Top |
Malignant transformation related pathway analysis |
| Find out the enriched GO biological processes and KEGG pathways involved in transition from healthy to precancer to cancer |
| Tissue | Disease Stage | Enriched GO biological Processes |
| Colorectum | AD |  |
| Colorectum | SER |  |
| Colorectum | MSS |  |
| Colorectum | MSI-H |  |
| Colorectum | FAP |  |
| ∗Top 15 enriched GO BP terms are showed in the bar plot of each disease state in each tissue. Each row represents a significant GO biological process which is colored according to the -log10(p.adjust). |
| Page: 1 2 3 4 5 6 7 8 9 |
| GO ID | Tissue | Disease Stage | Description | Gene Ratio | Bg Ratio | pvalue | p.adjust | Count |
| GO:000170118 | Esophagus | HGIN | in utero embryonic development | 77/2587 | 367/18723 | 9.56e-05 | 2.05e-03 | 77 |
| GO:00018244 | Esophagus | HGIN | blastocyst development | 28/2587 | 106/18723 | 4.30e-04 | 6.47e-03 | 28 |
| GO:00003383 | Esophagus | HGIN | protein deneddylation | 6/2587 | 10/18723 | 8.81e-04 | 1.13e-02 | 6 |
| GO:00605379 | Esophagus | HGIN | muscle tissue development | 76/2587 | 403/18723 | 2.67e-03 | 2.63e-02 | 76 |
| GO:00147068 | Esophagus | HGIN | striated muscle tissue development | 72/2587 | 384/18723 | 3.94e-03 | 3.56e-02 | 72 |
| GO:00706463 | Esophagus | HGIN | protein modification by small protein removal | 34/2587 | 157/18723 | 4.68e-03 | 4.02e-02 | 34 |
| GO:000170119 | Esophagus | ESCC | in utero embryonic development | 243/8552 | 367/18723 | 1.00e-15 | 6.86e-14 | 243 |
| GO:000182412 | Esophagus | ESCC | blastocyst development | 73/8552 | 106/18723 | 1.13e-06 | 1.40e-05 | 73 |
| GO:007064612 | Esophagus | ESCC | protein modification by small protein removal | 95/8552 | 157/18723 | 1.25e-04 | 8.56e-04 | 95 |
| GO:000033812 | Esophagus | ESCC | protein deneddylation | 10/8552 | 10/18723 | 3.94e-04 | 2.26e-03 | 10 |
| GO:006053716 | Esophagus | ESCC | muscle tissue development | 211/8552 | 403/18723 | 3.84e-03 | 1.56e-02 | 211 |
| GO:001470615 | Esophagus | ESCC | striated muscle tissue development | 197/8552 | 384/18723 | 1.46e-02 | 4.74e-02 | 197 |
| GO:00017015 | Liver | Cirrhotic | in utero embryonic development | 134/4634 | 367/18723 | 2.78e-07 | 6.86e-06 | 134 |
| GO:0000338 | Liver | Cirrhotic | protein deneddylation | 7/4634 | 10/18723 | 3.29e-03 | 1.83e-02 | 7 |
| GO:000170111 | Liver | HCC | in utero embryonic development | 204/7958 | 367/18723 | 2.44e-07 | 4.30e-06 | 204 |
| GO:00706461 | Liver | HCC | protein modification by small protein removal | 91/7958 | 157/18723 | 6.50e-05 | 5.92e-04 | 91 |
| GO:00003381 | Liver | HCC | protein deneddylation | 9/7958 | 10/18723 | 2.79e-03 | 1.31e-02 | 9 |
| GO:000170116 | Oral cavity | OSCC | in utero embryonic development | 207/7305 | 367/18723 | 7.92e-12 | 2.95e-10 | 207 |
| GO:00018243 | Oral cavity | OSCC | blastocyst development | 66/7305 | 106/18723 | 1.04e-06 | 1.40e-05 | 66 |
| GO:00003382 | Oral cavity | OSCC | protein deneddylation | 10/7305 | 10/18723 | 8.14e-05 | 6.26e-04 | 10 |
| Page: 1 2 3 |
| Pathway ID | Tissue | Disease Stage | Description | Gene Ratio | Bg Ratio | pvalue | p.adjust | qvalue | Count |
| Page: 1 |
Top |
Cell-cell communication analysis |
| Identification of potential cell-cell interactions between two cell types and their ligand-receptor pairs for different disease states |
| Ligand | Receptor | LRpair | Pathway | Tissue | Disease Stage |
| Page: 1 |
Top |
Single-cell gene regulatory network inference analysis |
| Find out the significant the regulons (TFs) and the target genes of each regulon across cell types for different disease states |
| TF | Cell Type | Tissue | Disease Stage | Target Gene | RSS | Regulon Activity |
| ∗The dot plots of a searched regulon are shown for all cell subpopulations in each disease state of each tissue based on the regulon specific score inferred using pySCENIC and by calculating the average expression. |
| Page: 1 |
Top |
Somatic mutation of malignant transformation related genes |
| Annotation of somatic variants for genes involved in malignant transformation |
| Hugo Symbol | Variant Class | Variant Classification | dbSNP RS | HGVSc | HGVSp | HGVSp Short | SWISSPROT | BIOTYPE | SIFT | PolyPhen | Tumor Sample Barcode | Tissue | Histology | Sex | Age | Stage | Therapy Types | Drugs | Outcome |
| COPS2 | SNV | Missense_Mutation | c.1169N>T | p.Ala390Val | p.A390V | P61201 | protein_coding | tolerated(0.24) | benign(0.007) | TCGA-D8-A147-01 | Breast | breast invasive carcinoma | Female | <65 | I/II | Chemotherapy | doxorubicine | SD | |
| COPS2 | SNV | Missense_Mutation | c.1149N>T | p.Lys383Asn | p.K383N | P61201 | protein_coding | deleterious(0.04) | benign(0.022) | TCGA-C5-A7CH-01 | Cervix | cervical & endocervical cancer | Female | <65 | I/II | Unspecific | SD | ||
| COPS2 | SNV | Missense_Mutation | c.1348N>A | p.Ala450Thr | p.A450T | P61201 | protein_coding | tolerated(0.13) | benign(0.007) | TCGA-DR-A0ZL-01 | Cervix | cervical & endocervical cancer | Female | <65 | I/II | Unknown | Unknown | SD | |
| COPS2 | SNV | Missense_Mutation | novel | c.759G>C | p.Leu253Phe | p.L253F | P61201 | protein_coding | deleterious(0) | probably_damaging(0.951) | TCGA-VS-A9U5-01 | Cervix | cervical & endocervical cancer | Female | <65 | I/II | Chemotherapy | cisplatin | CR |
| COPS2 | SNV | Missense_Mutation | c.346N>A | p.Leu116Ile | p.L116I | P61201 | protein_coding | deleterious(0.01) | possibly_damaging(0.725) | TCGA-A6-6141-01 | Colorectum | colon adenocarcinoma | Male | <65 | I/II | Chemotherapy | 5-fu | SD | |
| COPS2 | SNV | Missense_Mutation | c.1319N>A | p.Ser440Tyr | p.S440Y | P61201 | protein_coding | deleterious(0) | benign(0.287) | TCGA-CA-6718-01 | Colorectum | colon adenocarcinoma | Male | <65 | I/II | Unknown | Unknown | PD | |
| COPS2 | SNV | Missense_Mutation | c.533T>A | p.Ile178Asn | p.I178N | P61201 | protein_coding | deleterious(0.02) | probably_damaging(0.99) | TCGA-D5-6927-01 | Colorectum | colon adenocarcinoma | Male | <65 | I/II | Unknown | Unknown | SD | |
| COPS2 | SNV | Missense_Mutation | c.826N>A | p.Gly276Arg | p.G276R | P61201 | protein_coding | deleterious(0.02) | probably_damaging(1) | TCGA-AF-2693-01 | Colorectum | rectum adenocarcinoma | Male | >=65 | I/II | Unknown | Unknown | SD | |
| COPS2 | SNV | Missense_Mutation | novel | c.662N>G | p.Leu221Arg | p.L221R | P61201 | protein_coding | deleterious(0) | probably_damaging(0.997) | TCGA-F5-6814-01 | Colorectum | rectum adenocarcinoma | Male | <65 | I/II | Unknown | Unknown | SD |
| COPS2 | insertion | Frame_Shift_Ins | novel | c.546_547insA | p.His183ThrfsTer7 | p.H183Tfs*7 | P61201 | protein_coding | TCGA-5M-AATE-01 | Colorectum | colon adenocarcinoma | Male | >=65 | I/II | Unknown | Unknown | PD |
| Page: 1 2 3 4 5 6 |
Top |
Related drugs of malignant transformation related genes |
| Identification of chemicals and drugs interact with genes involved in malignant transfromation |
| (DGIdb 4.0) |
| Entrez ID | Symbol | Category | Interaction Types | Drug Claim Name | Drug Name | PMIDs |
| Page: 1 |

Copyright 2023-Present -The University of Texas Health Science Center at Houston |