
|
|||||
|
 | |
| |
| |
| |
| |
| |
|
Gene: COPRS |
Gene summary for COPRS |
| Gene information | Species | Human | Gene symbol | COPRS | Gene ID | 55352 |
| Gene name | coordinator of PRMT5 and differentiation stimulator | |
| Gene Alias | C17orf79 | |
| Cytomap | 17q11.2 | |
| Gene Type | protein-coding | GO ID | GO:0006464 | UniProtAcc | H9KV77 |
Top |
Malignant transformation analysis |
| Identification of the aberrant gene expression in precancerous and cancerous lesions by comparing the gene expression of stem-like cells in diseased tissues with normal stem cells |
| Entrez ID | Symbol | Replicates | Species | Organ | Tissue | Adj P-value | Log2FC | Malignancy |
| 55352 | COPRS | GSM4909281 | Human | Breast | IDC | 1.70e-07 | 3.01e-01 | 0.21 |
| 55352 | COPRS | GSM4909282 | Human | Breast | IDC | 6.72e-09 | 2.55e-01 | -0.0288 |
| 55352 | COPRS | GSM4909286 | Human | Breast | IDC | 2.75e-17 | 3.40e-01 | 0.1081 |
| 55352 | COPRS | GSM4909293 | Human | Breast | IDC | 2.68e-18 | 4.62e-01 | 0.1581 |
| 55352 | COPRS | GSM4909297 | Human | Breast | IDC | 5.37e-03 | 3.54e-02 | 0.1517 |
| 55352 | COPRS | GSM4909298 | Human | Breast | IDC | 1.52e-05 | 2.23e-01 | 0.1551 |
| 55352 | COPRS | GSM4909301 | Human | Breast | IDC | 8.58e-03 | 1.98e-01 | 0.1577 |
| 55352 | COPRS | GSM4909306 | Human | Breast | IDC | 4.32e-03 | 2.22e-01 | 0.1564 |
| 55352 | COPRS | GSM4909307 | Human | Breast | IDC | 2.46e-02 | 2.02e-01 | 0.1569 |
| 55352 | COPRS | GSM4909308 | Human | Breast | IDC | 1.87e-10 | 3.37e-01 | 0.158 |
| 55352 | COPRS | GSM4909311 | Human | Breast | IDC | 4.79e-05 | -1.49e-01 | 0.1534 |
| 55352 | COPRS | GSM4909317 | Human | Breast | IDC | 1.39e-03 | 2.15e-01 | 0.1355 |
| 55352 | COPRS | GSM4909319 | Human | Breast | IDC | 3.71e-26 | 1.84e-01 | 0.1563 |
| 55352 | COPRS | GSM4909321 | Human | Breast | IDC | 2.82e-02 | 5.76e-02 | 0.1559 |
| 55352 | COPRS | brca1 | Human | Breast | Precancer | 2.09e-06 | 2.87e-01 | -0.0338 |
| 55352 | COPRS | brca2 | Human | Breast | Precancer | 3.79e-04 | 2.47e-01 | -0.024 |
| 55352 | COPRS | M1 | Human | Breast | IDC | 2.41e-11 | 4.50e-01 | 0.1577 |
| 55352 | COPRS | M2 | Human | Breast | IDC | 2.23e-03 | 5.06e-01 | 0.21 |
| 55352 | COPRS | NCCBC5 | Human | Breast | DCIS | 3.62e-17 | 6.06e-01 | 0.2046 |
| 55352 | COPRS | DCIS2 | Human | Breast | DCIS | 6.25e-58 | 2.89e-01 | 0.0085 |
| Page: 1 2 3 4 5 6 7 |
| Tissue | Expression Dynamics | Abbreviation |
| Breast | 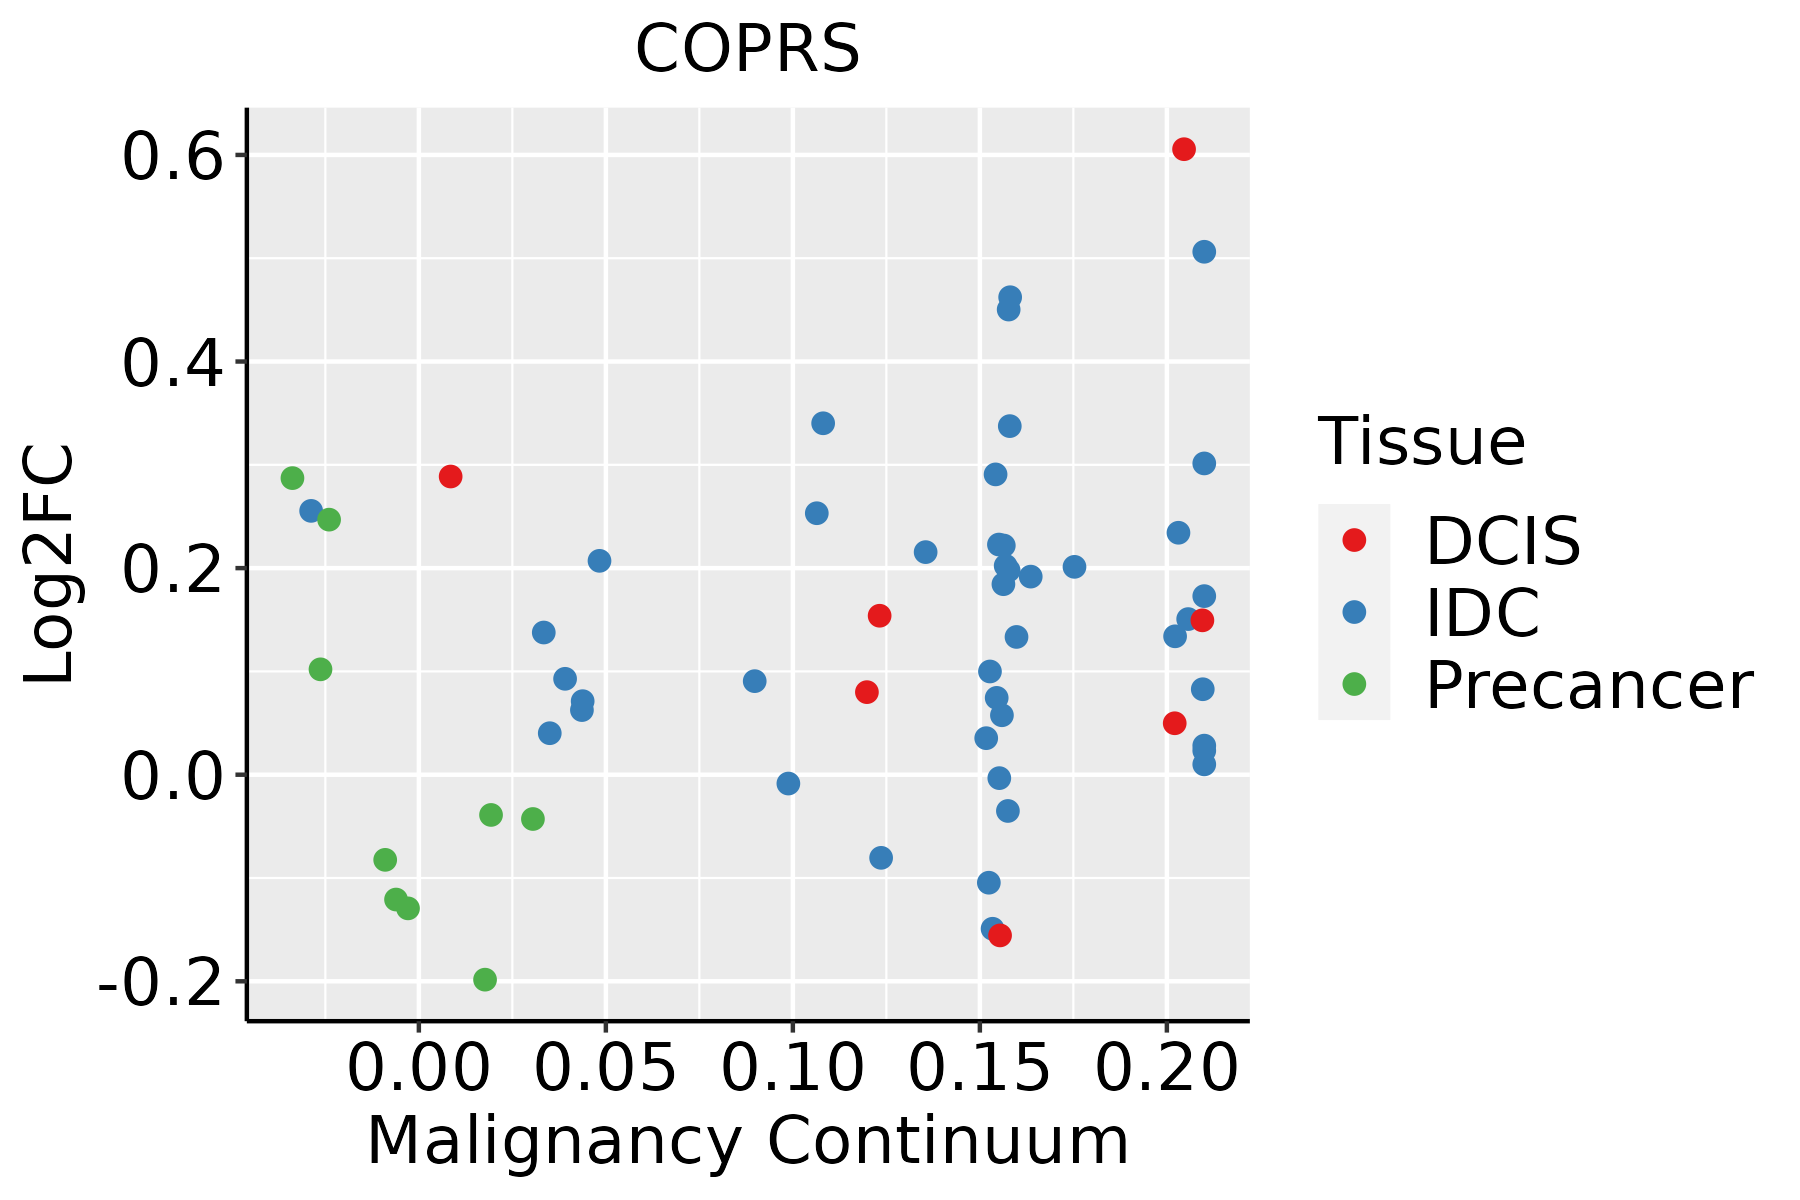 | IDC: Invasive ductal carcinoma |
| DCIS: Ductal carcinoma in situ | ||
| Precancer(BRCA1-mut): Precancerous lesion from BRCA1 mutation carriers | ||
| Esophagus | 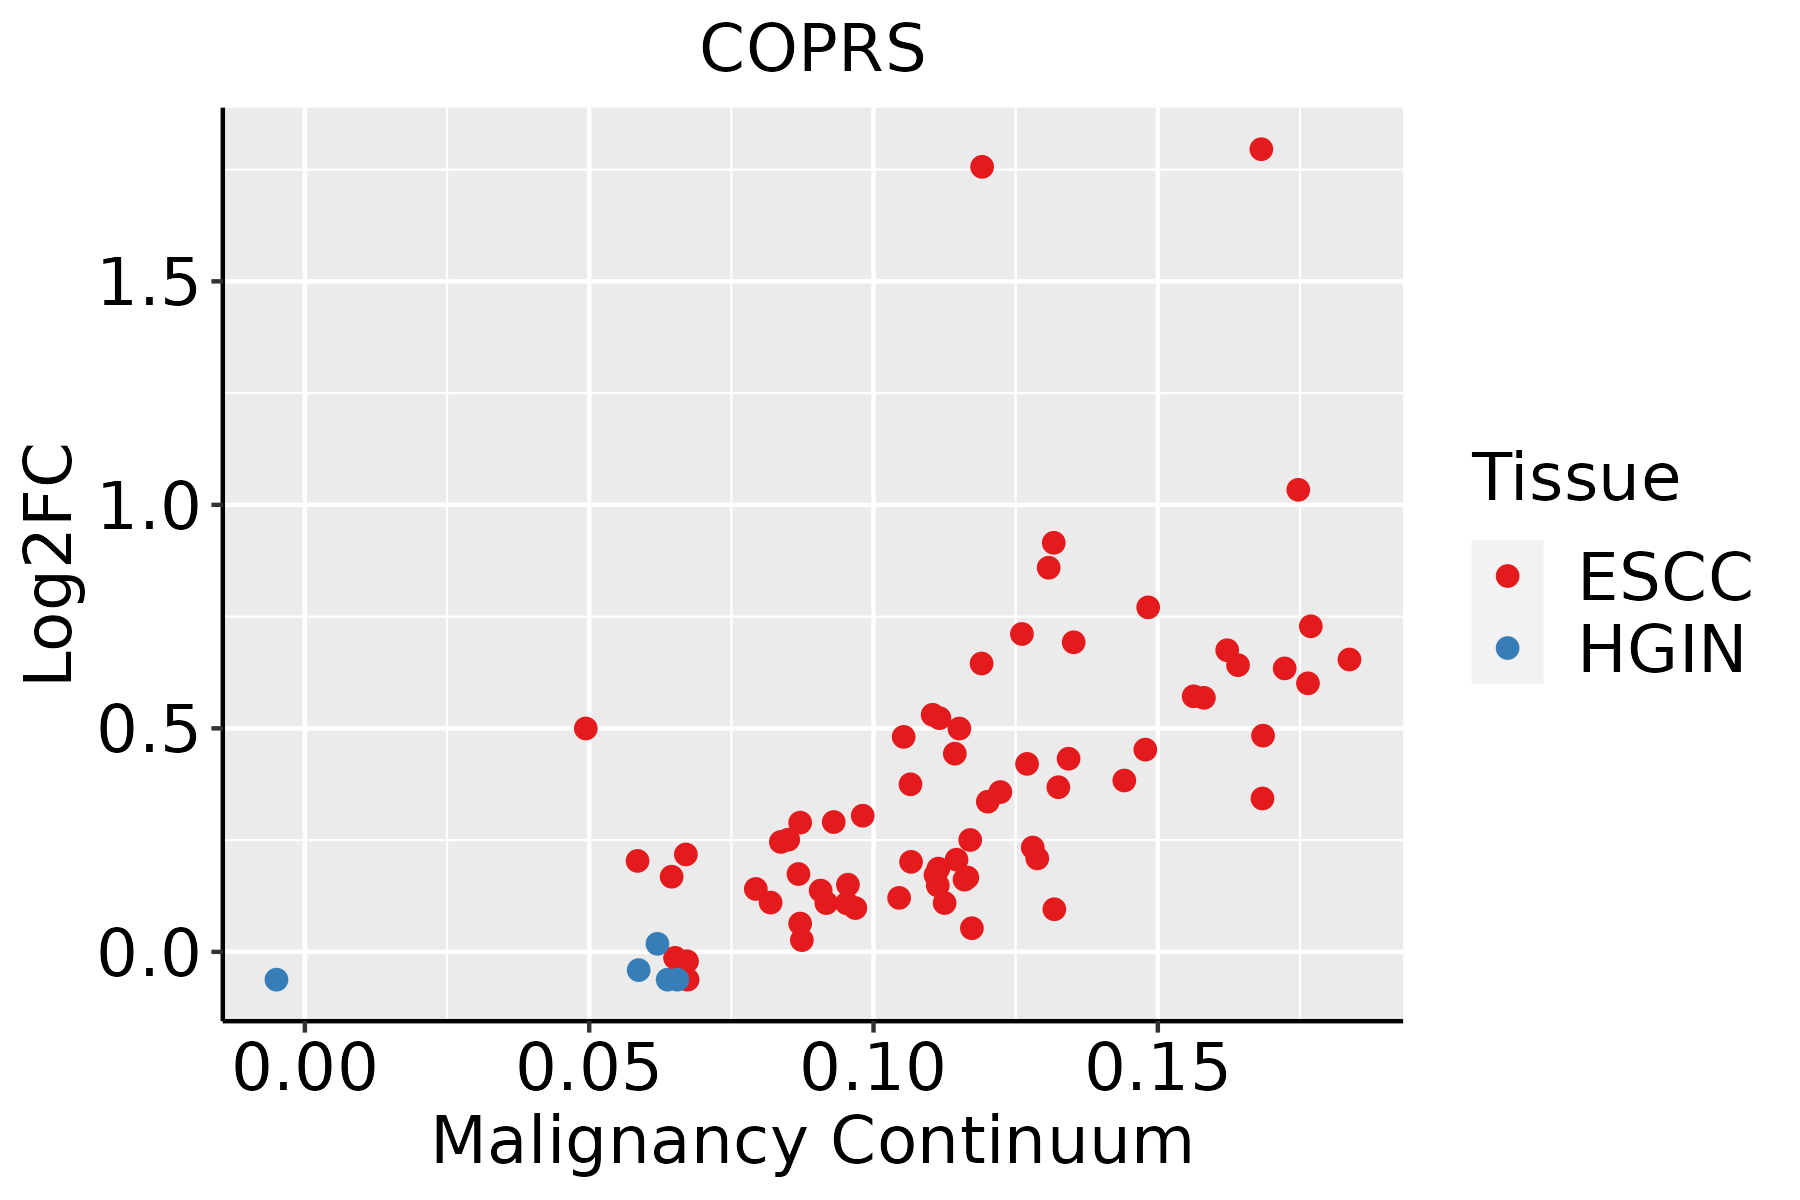 | ESCC: Esophageal squamous cell carcinoma |
| HGIN: High-grade intraepithelial neoplasias | ||
| LGIN: Low-grade intraepithelial neoplasias | ||
| Liver |  | HCC: Hepatocellular carcinoma |
| NAFLD: Non-alcoholic fatty liver disease | ||
| Oral Cavity | 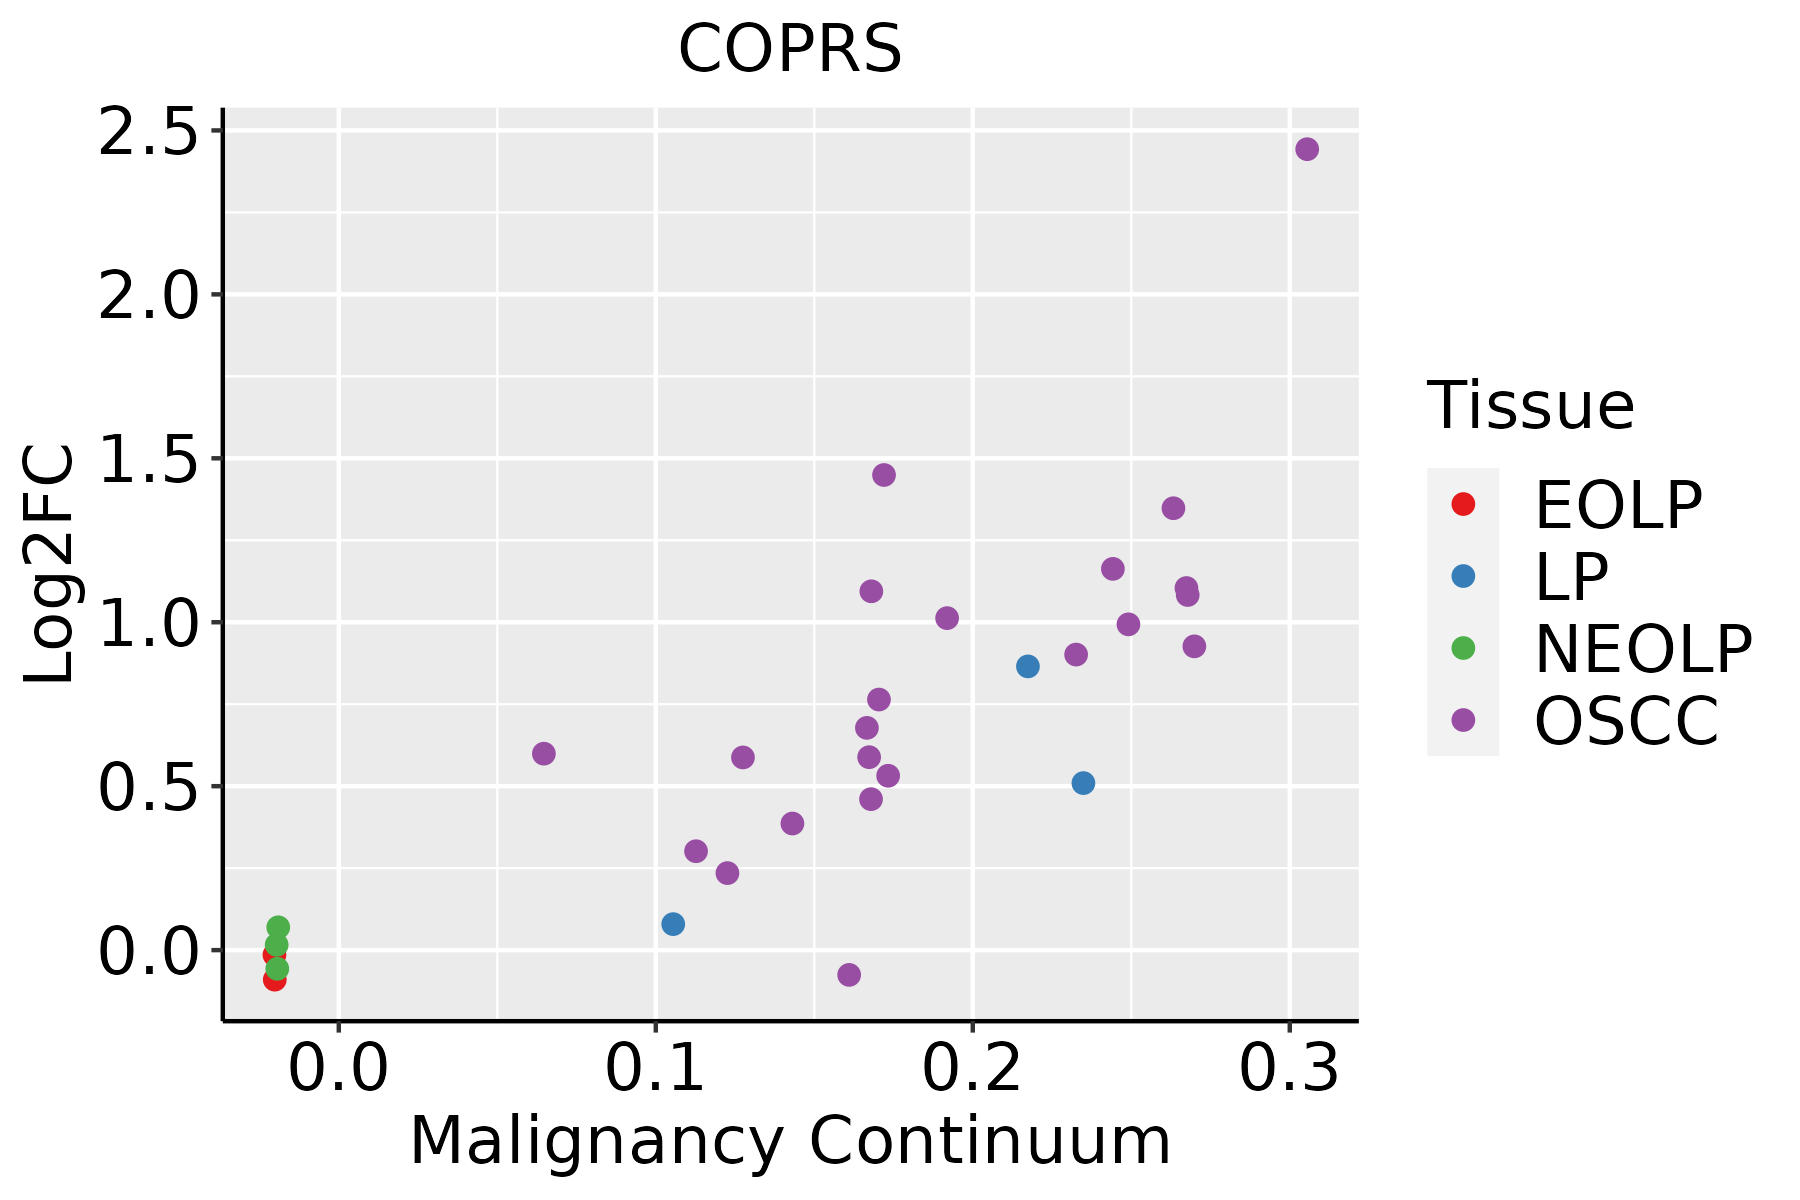 | EOLP: Erosive Oral lichen planus |
| LP: leukoplakia | ||
| NEOLP: Non-erosive oral lichen planus | ||
| OSCC: Oral squamous cell carcinoma | ||
| Prostate | 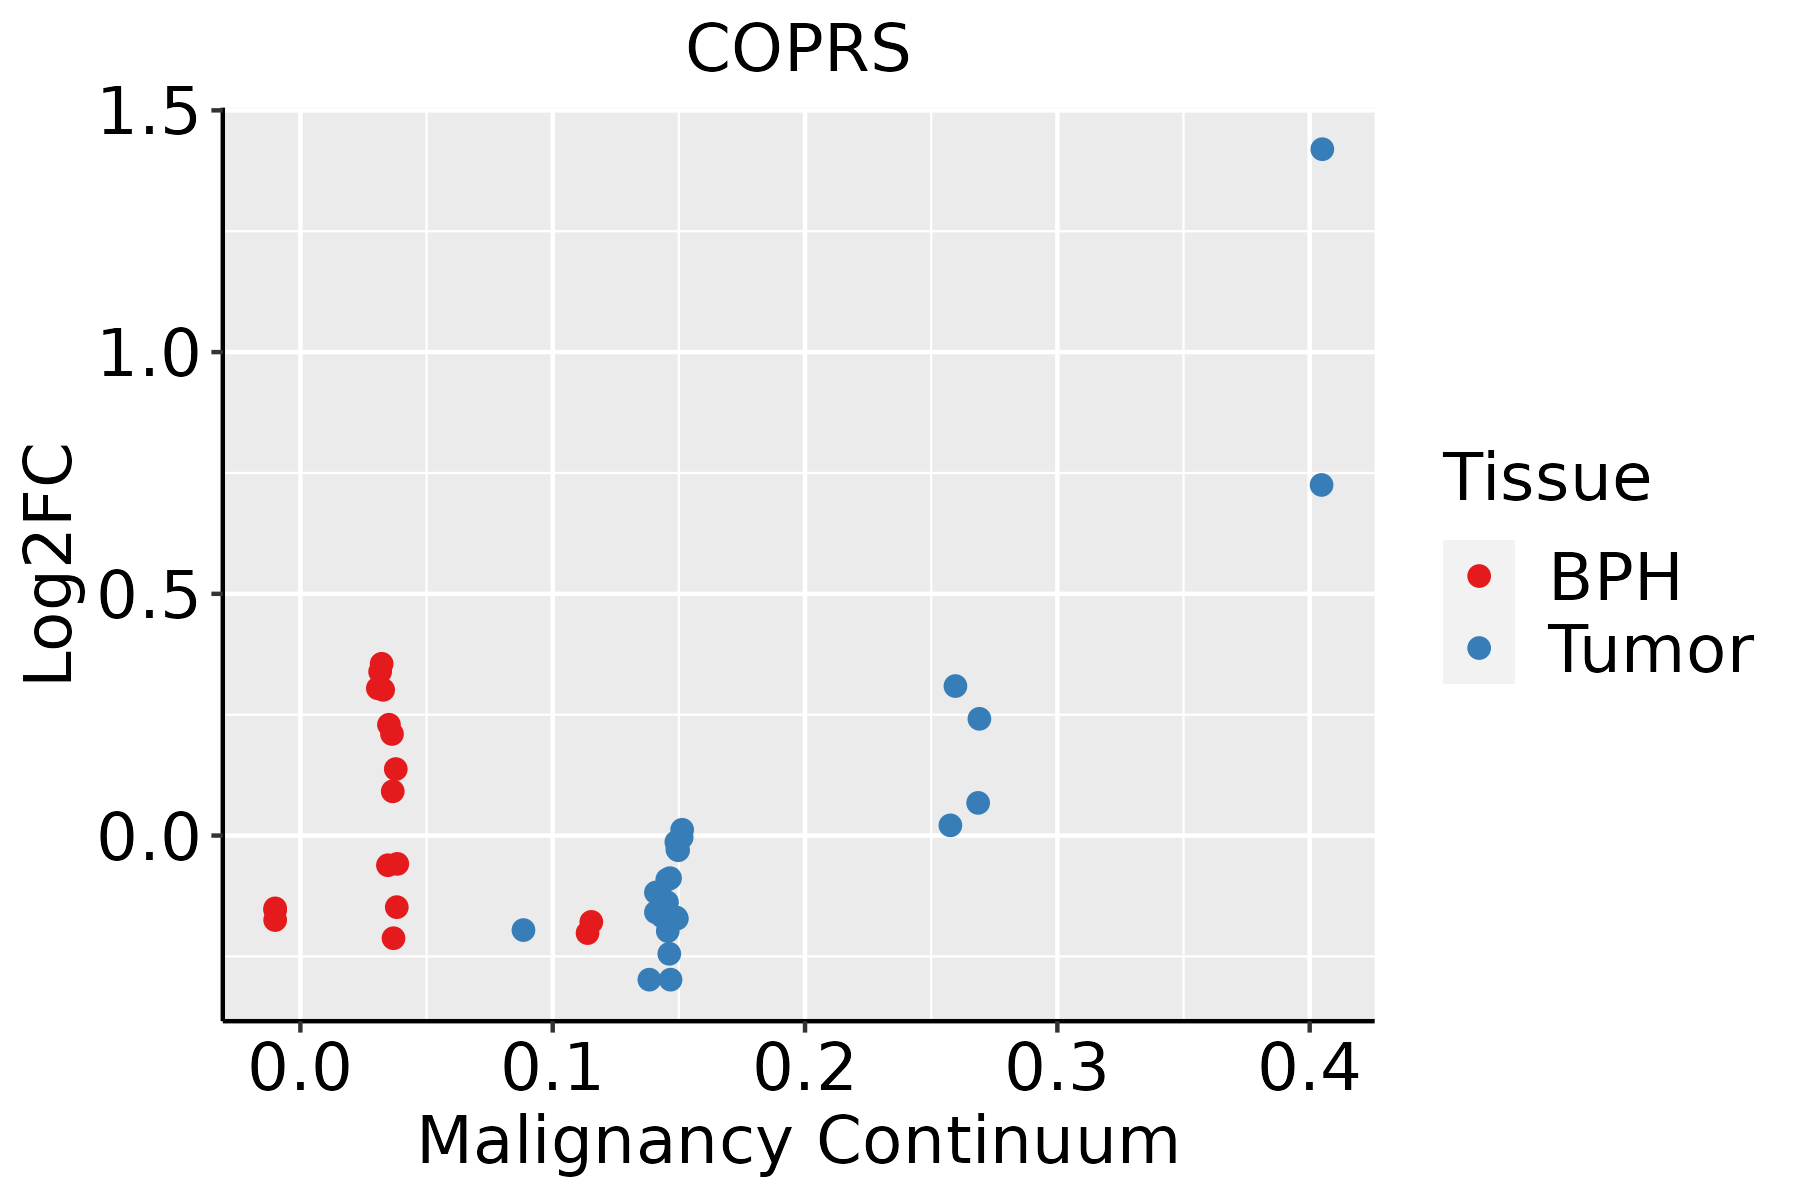 | BPH: Benign Prostatic Hyperplasia |
| Skin | 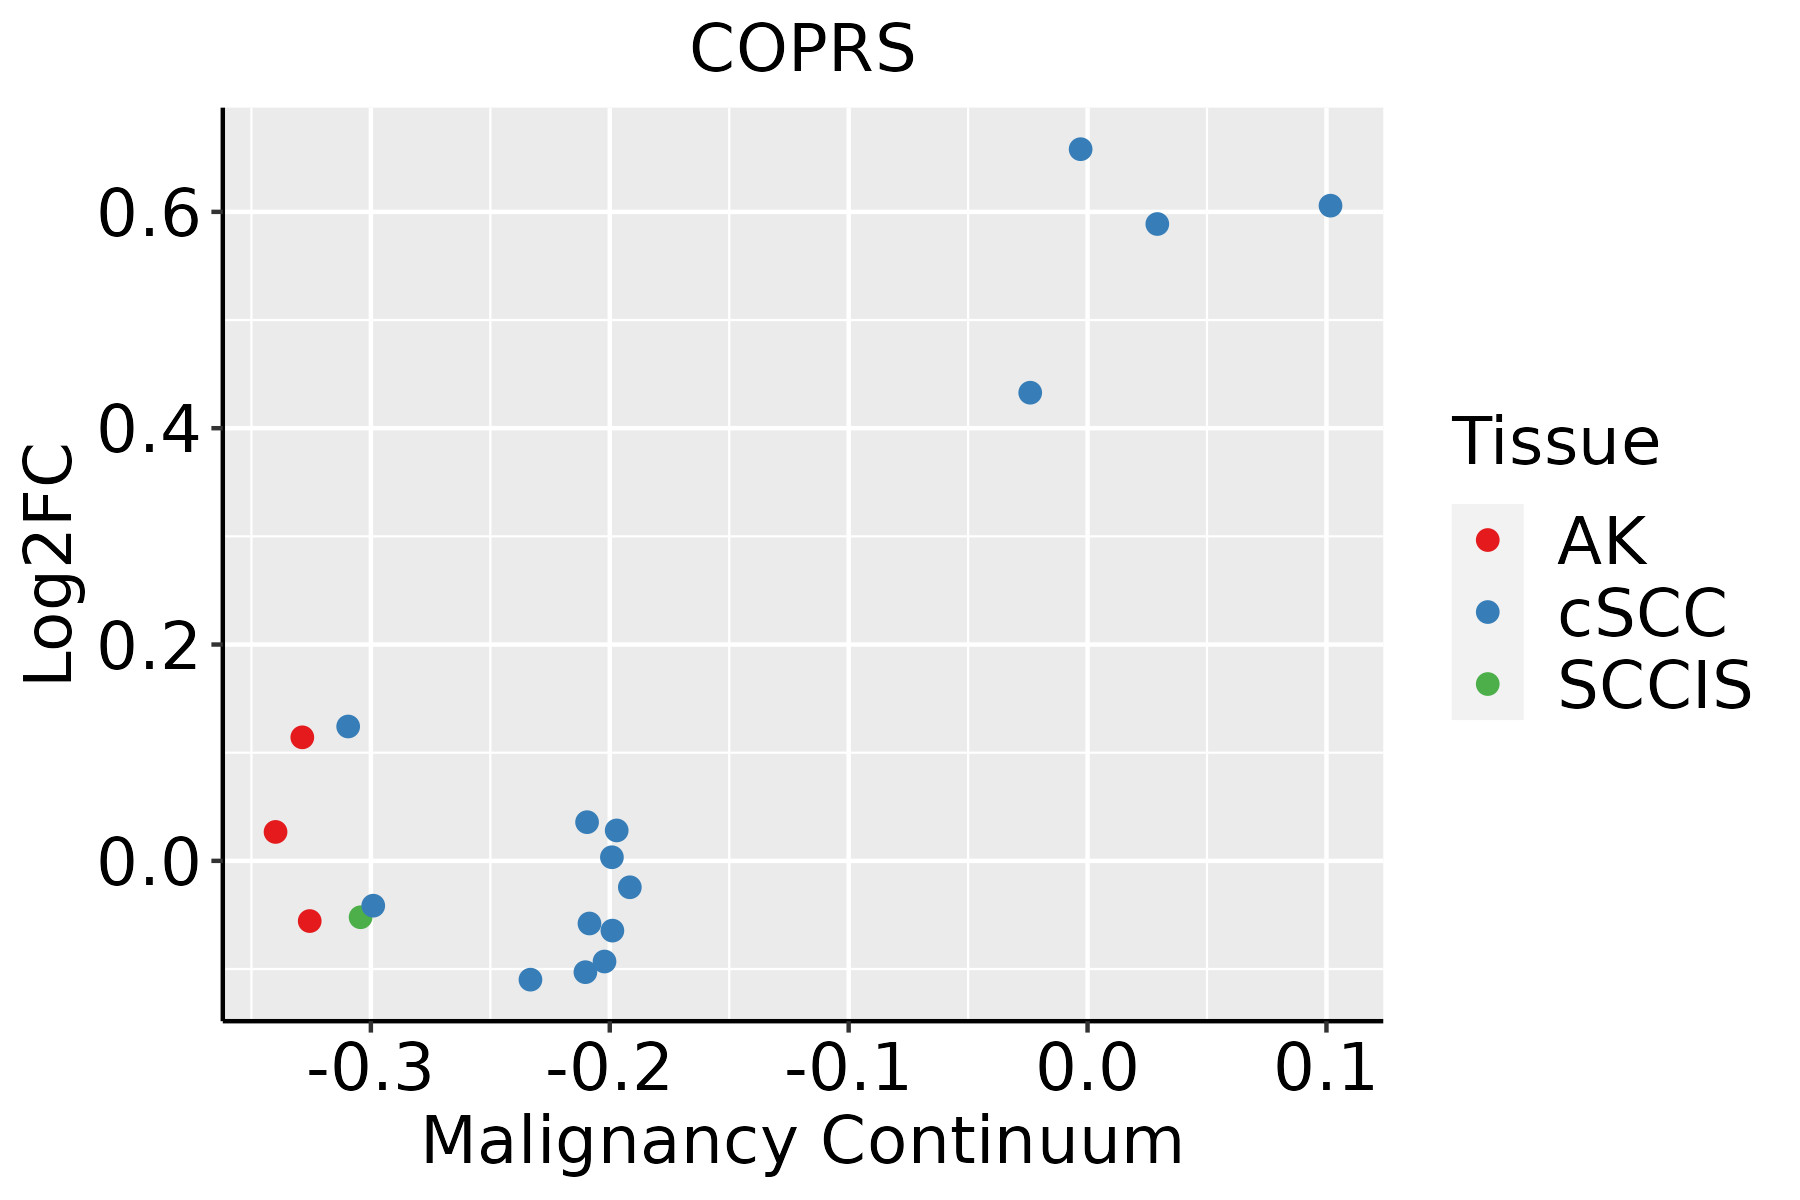 | AK: Actinic keratosis |
| cSCC: Cutaneous squamous cell carcinoma | ||
| SCCIS:squamous cell carcinoma in situ | ||
| Thyroid | 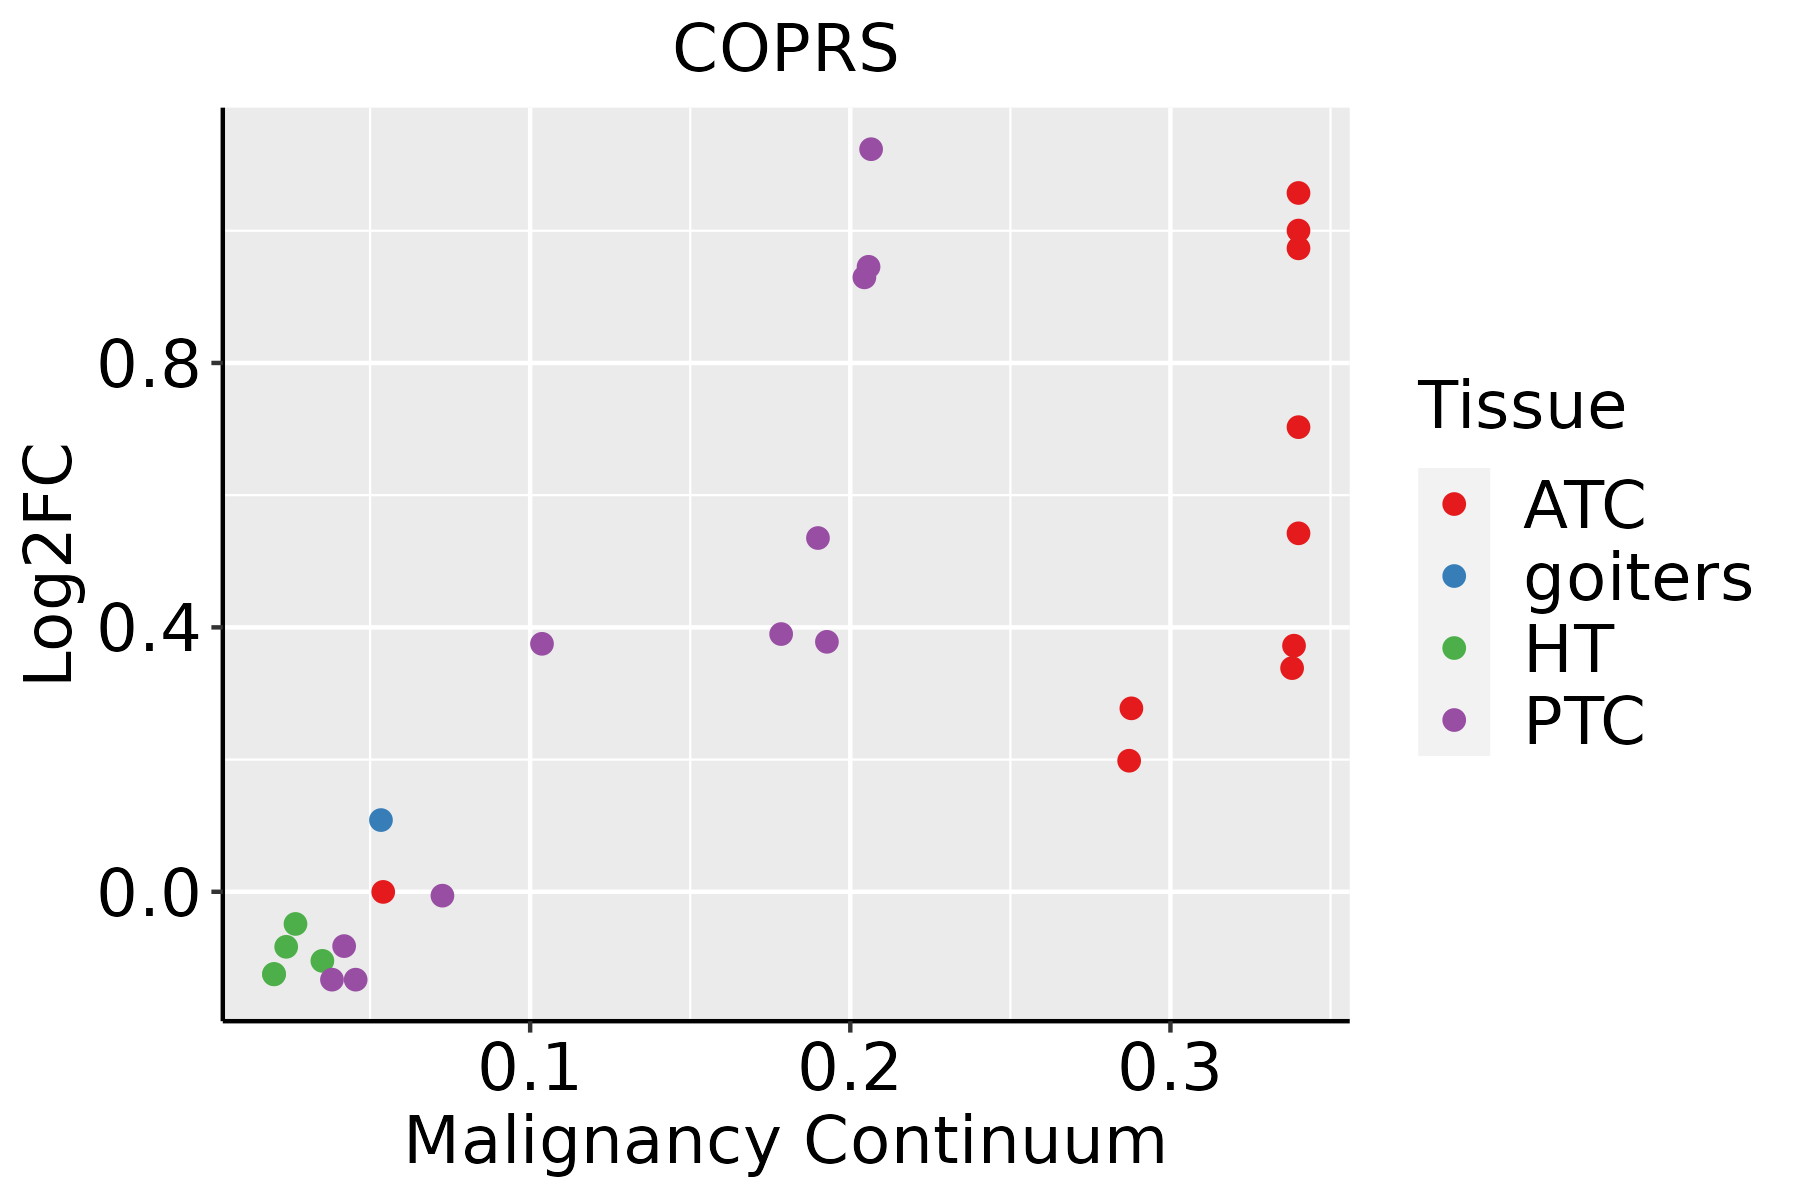 | ATC: Anaplastic thyroid cancer |
| HT: Hashimoto's thyroiditis | ||
| PTC: Papillary thyroid cancer |
| ∗log2FC in expression of this searched gene in stem-like cells from each diseased tissue sample relative to stem-like cells in normal samples in each tissue plotted against the malignancy continuum. Samples are colored based on if they are from different disease stage. |
Top |
Malignant transformation related pathway analysis |
| Find out the enriched GO biological processes and KEGG pathways involved in transition from healthy to precancer to cancer |
| Tissue | Disease Stage | Enriched GO biological Processes |
| Colorectum | AD |  |
| Colorectum | SER |  |
| Colorectum | MSS |  |
| Colorectum | MSI-H |  |
| Colorectum | FAP |  |
| ∗Top 15 enriched GO BP terms are showed in the bar plot of each disease state in each tissue. Each row represents a significant GO biological process which is colored according to the -log10(p.adjust). |
| Page: 1 2 3 4 5 6 7 8 9 |
| GO ID | Tissue | Disease Stage | Description | Gene Ratio | Bg Ratio | pvalue | p.adjust | Count |
| GO:00075172 | Breast | IDC | muscle organ development | 38/1434 | 327/18723 | 6.63e-03 | 4.62e-02 | 38 |
| GO:00075171 | Breast | DCIS | muscle organ development | 37/1390 | 327/18723 | 6.86e-03 | 4.75e-02 | 37 |
| GO:001657015 | Esophagus | ESCC | histone modification | 323/8552 | 463/18723 | 2.61e-26 | 7.88e-24 | 323 |
| GO:00434143 | Esophagus | ESCC | macromolecule methylation | 199/8552 | 316/18723 | 3.44e-10 | 9.57e-09 | 199 |
| GO:00322592 | Esophagus | ESCC | methylation | 222/8552 | 364/18723 | 2.26e-09 | 5.09e-08 | 222 |
| GO:000647914 | Esophagus | ESCC | protein methylation | 115/8552 | 181/18723 | 9.07e-07 | 1.16e-05 | 115 |
| GO:000821314 | Esophagus | ESCC | protein alkylation | 115/8552 | 181/18723 | 9.07e-07 | 1.16e-05 | 115 |
| GO:00165718 | Esophagus | ESCC | histone methylation | 89/8552 | 141/18723 | 2.17e-05 | 1.87e-04 | 89 |
| GO:001657011 | Liver | Cirrhotic | histone modification | 154/4634 | 463/18723 | 1.92e-05 | 2.57e-04 | 154 |
| GO:00064791 | Liver | Cirrhotic | protein methylation | 61/4634 | 181/18723 | 4.13e-03 | 2.21e-02 | 61 |
| GO:00082131 | Liver | Cirrhotic | protein alkylation | 61/4634 | 181/18723 | 4.13e-03 | 2.21e-02 | 61 |
| GO:00165711 | Liver | Cirrhotic | histone methylation | 49/4634 | 141/18723 | 4.90e-03 | 2.56e-02 | 49 |
| GO:001657021 | Liver | HCC | histone modification | 283/7958 | 463/18723 | 2.68e-16 | 2.33e-14 | 283 |
| GO:00434141 | Liver | HCC | macromolecule methylation | 183/7958 | 316/18723 | 2.00e-08 | 4.72e-07 | 183 |
| GO:0032259 | Liver | HCC | methylation | 206/7958 | 364/18723 | 3.35e-08 | 7.53e-07 | 206 |
| GO:00064792 | Liver | HCC | protein methylation | 111/7958 | 181/18723 | 2.36e-07 | 4.18e-06 | 111 |
| GO:00082132 | Liver | HCC | protein alkylation | 111/7958 | 181/18723 | 2.36e-07 | 4.18e-06 | 111 |
| GO:00165712 | Liver | HCC | histone methylation | 88/7958 | 141/18723 | 1.41e-06 | 2.02e-05 | 88 |
| GO:00165707 | Oral cavity | OSCC | histone modification | 270/7305 | 463/18723 | 1.59e-17 | 1.50e-15 | 270 |
| GO:00064797 | Oral cavity | OSCC | protein methylation | 92/7305 | 181/18723 | 7.86e-04 | 4.26e-03 | 92 |
| Page: 1 2 3 |
| Pathway ID | Tissue | Disease Stage | Description | Gene Ratio | Bg Ratio | pvalue | p.adjust | qvalue | Count |
| Page: 1 |
Top |
Cell-cell communication analysis |
| Identification of potential cell-cell interactions between two cell types and their ligand-receptor pairs for different disease states |
| Ligand | Receptor | LRpair | Pathway | Tissue | Disease Stage |
| Page: 1 |
Top |
Single-cell gene regulatory network inference analysis |
| Find out the significant the regulons (TFs) and the target genes of each regulon across cell types for different disease states |
| TF | Cell Type | Tissue | Disease Stage | Target Gene | RSS | Regulon Activity |
| ∗The dot plots of a searched regulon are shown for all cell subpopulations in each disease state of each tissue based on the regulon specific score inferred using pySCENIC and by calculating the average expression. |
| Page: 1 |
Top |
Somatic mutation of malignant transformation related genes |
| Annotation of somatic variants for genes involved in malignant transformation |
| Hugo Symbol | Variant Class | Variant Classification | dbSNP RS | HGVSc | HGVSp | HGVSp Short | SWISSPROT | BIOTYPE | SIFT | PolyPhen | Tumor Sample Barcode | Tissue | Histology | Sex | Age | Stage | Therapy Types | Drugs | Outcome |
| COPRS | SNV | Missense_Mutation | c.499N>A | p.Pro167Thr | p.P167T | Q9NQ92 | protein_coding | tolerated(0.11) | probably_damaging(0.998) | TCGA-B6-A0X5-01 | Breast | breast invasive carcinoma | Female | <65 | I/II | Unknown | Unknown | PD | |
| COPRS | SNV | Missense_Mutation | novel | c.469N>A | p.Pro157Thr | p.P157T | Q9NQ92 | protein_coding | deleterious(0) | probably_damaging(0.998) | TCGA-A6-2672-01 | Colorectum | colon adenocarcinoma | Female | >=65 | III/IV | Unknown | Unknown | SD |
| COPRS | SNV | Missense_Mutation | c.335N>A | p.Phe112Tyr | p.F112Y | Q9NQ92 | protein_coding | tolerated(0.16) | possibly_damaging(0.544) | TCGA-AA-3977-01 | Colorectum | colon adenocarcinoma | Male | >=65 | I/II | Unknown | Unknown | SD | |
| COPRS | deletion | Frame_Shift_Del | c.209delG | p.Gly70ValfsTer22 | p.G70Vfs*22 | Q9NQ92 | protein_coding | TCGA-AD-A5EJ-01 | Colorectum | colon adenocarcinoma | Female | >=65 | I/II | Unknown | Unknown | SD | |||
| COPRS | SNV | Missense_Mutation | novel | c.409N>G | p.Ile137Val | p.I137V | Q9NQ92 | protein_coding | tolerated(0.19) | benign(0.085) | TCGA-A5-A0G2-01 | Endometrium | uterine corpus endometrioid carcinoma | Female | <65 | III/IV | Unknown | Unknown | SD |
| COPRS | SNV | Missense_Mutation | c.513N>T | p.Lys171Asn | p.K171N | Q9NQ92 | protein_coding | deleterious(0.04) | probably_damaging(0.998) | TCGA-AP-A051-01 | Endometrium | uterine corpus endometrioid carcinoma | Female | >=65 | I/II | Unknown | Unknown | SD | |
| COPRS | SNV | Missense_Mutation | rs202013617 | c.394G>A | p.Asp132Asn | p.D132N | Q9NQ92 | protein_coding | deleterious(0) | probably_damaging(0.998) | TCGA-AP-A0LM-01 | Endometrium | uterine corpus endometrioid carcinoma | Female | <65 | III/IV | Chemotherapy | cisplatin | SD |
| COPRS | SNV | Missense_Mutation | c.283G>A | p.Glu95Lys | p.E95K | Q9NQ92 | protein_coding | tolerated(0.08) | probably_damaging(0.96) | TCGA-D1-A17Q-01 | Endometrium | uterine corpus endometrioid carcinoma | Female | <65 | I/II | Unknown | Unknown | SD | |
| COPRS | SNV | Missense_Mutation | novel | c.142N>G | p.Thr48Ala | p.T48A | Q9NQ92 | protein_coding | tolerated_low_confidence(0.13) | benign(0.031) | TCGA-DF-A2KN-01 | Endometrium | uterine corpus endometrioid carcinoma | Female | Unknown | I/II | Unknown | Unknown | SD |
| COPRS | SNV | Missense_Mutation | novel | c.342N>T | p.Glu114Asp | p.E114D | Q9NQ92 | protein_coding | deleterious(0.01) | probably_damaging(0.986) | TCGA-DF-A2KU-01 | Endometrium | uterine corpus endometrioid carcinoma | Female | Unknown | I/II | Unknown | Unknown | SD |
| Page: 1 2 |
Top |
Related drugs of malignant transformation related genes |
| Identification of chemicals and drugs interact with genes involved in malignant transfromation |
| (DGIdb 4.0) |
| Entrez ID | Symbol | Category | Interaction Types | Drug Claim Name | Drug Name | PMIDs |
| Page: 1 |

Copyright 2023-Present -The University of Texas Health Science Center at Houston |