Schematic overview of the cellular and molecular mechanisms involved in the cancer progression, including the proposed cellular and molecular mechanisms in cancer cells trajectory. AT1: alveolar type 1 cells; AT2: alveolar type 2 cells; AAH: atypical adenomatous hyperplasia; AIS: adenocarcinoma in situ; MIA: minimally invasive adenocarcinoma; IA: invasive adenocarcinoma; EMT: epithelial-mesenchymal transition

Home

Download

Statistics

Help

Contact

Center for Computational Systems Medicine
leaf

Gene summary

leaf

Malignant transformation analysis

leaf

Malignant transformation related pathway analysis

leaf

Cell-cell communication analysis

leaf

Single-cell gene regulatory network inference analysis

leaf

Somatic mutation of malignant transformation related genes

leaf

Related drugs of malignant transformation related genes

Gene: COPA

Gene summary for COPA

check button Gene summary.

Gene informationSpeciesHuman
Gene symbol

COPA

Gene ID

1314

Gene nameCOPI coat complex subunit alpha
Gene AliasAILJK
Cytomap1q23.2
Gene Typeprotein-coding
GO ID

GO:0003008

UniProtAcc

P53621


Top

Malignant transformation analysis

check button Identification of the aberrant gene expression in precancerous and cancerous lesions by comparing the gene expression of stem-like cells in diseased tissues with normal stem cells
check button Malignant transformation involving gene list.
Entrez IDSymbolReplicatesSpeciesOrganTissueAdj P-valueLog2FCMalignancy
1314COPAHTA11_1938_2000001011HumanColorectumAD3.14e-096.96e-01-0.0811
1314COPAHTA11_78_2000001011HumanColorectumAD1.45e-086.14e-01-0.1088
1314COPAHTA11_347_2000001011HumanColorectumAD7.30e-258.82e-01-0.1954
1314COPAHTA11_411_2000001011HumanColorectumSER3.51e-047.43e-01-0.2602
1314COPAHTA11_696_2000001011HumanColorectumAD3.05e-035.12e-01-0.1464
1314COPAHTA11_1391_2000001011HumanColorectumAD3.03e-097.04e-01-0.059
1314COPAHTA11_866_3004761011HumanColorectumAD1.49e-074.47e-010.096
1314COPAHTA11_7663_2000001011HumanColorectumSER3.34e-024.62e-010.0131
1314COPAHTA11_7469_2000001011HumanColorectumAD4.28e-025.58e-01-0.0124
1314COPAHTA11_6818_2000001021HumanColorectumAD1.59e-034.03e-010.0588
1314COPAHTA11_99999970781_79442HumanColorectumMSS2.34e-076.27e-010.294
1314COPAHTA11_99999965104_69814HumanColorectumMSS4.42e-189.28e-010.281
1314COPAHTA11_99999971662_82457HumanColorectumMSS3.60e-108.72e-010.3859
1314COPAA002-C-010HumanColorectumFAP1.23e-02-1.59e-010.242
1314COPAA015-C-203HumanColorectumFAP1.28e-20-3.65e-01-0.1294
1314COPAA014-C-040HumanColorectumFAP1.41e-03-5.21e-01-0.1184
1314COPAA002-C-201HumanColorectumFAP8.57e-09-2.34e-010.0324
1314COPAA002-C-203HumanColorectumFAP6.40e-04-8.64e-020.2786
1314COPAA001-C-108HumanColorectumFAP2.61e-15-3.02e-01-0.0272
1314COPAA002-C-205HumanColorectumFAP3.46e-17-4.86e-01-0.1236
Page: 1 2 3 4 5 6 7 8 9 10 

check button Transcriptomic changes along malignancy continuum.
TissueExpression DynamicsAbbreviation
Colorectum (GSE201348)The image shows the transcriptomic changes along malignancy continuum.log2FC in expression of this searched gene in stem-like cells from each diseased tissue sample relative to stem-like cells in normal samples in each tissue plotted against the malignancy continuum. Samples are colored based on if they are from different disease stage.FAP: Familial adenomatous polyposis
CRC: Colorectal cancer
Colorectum (HTA11)The image shows the transcriptomic changes along malignancy continuum.log2FC in expression of this searched gene in stem-like cells from each diseased tissue sample relative to stem-like cells in normal samples in each tissue plotted against the malignancy continuum. Samples are colored based on if they are from different disease stage.AD: Adenomas
SER: Sessile serrated lesions
MSI-H: Microsatellite-high colorectal cancer
MSS: Microsatellite stable colorectal cancer
EsophagusThe image shows the transcriptomic changes along malignancy continuum.log2FC in expression of this searched gene in stem-like cells from each diseased tissue sample relative to stem-like cells in normal samples in each tissue plotted against the malignancy continuum. Samples are colored based on if they are from different disease stage.
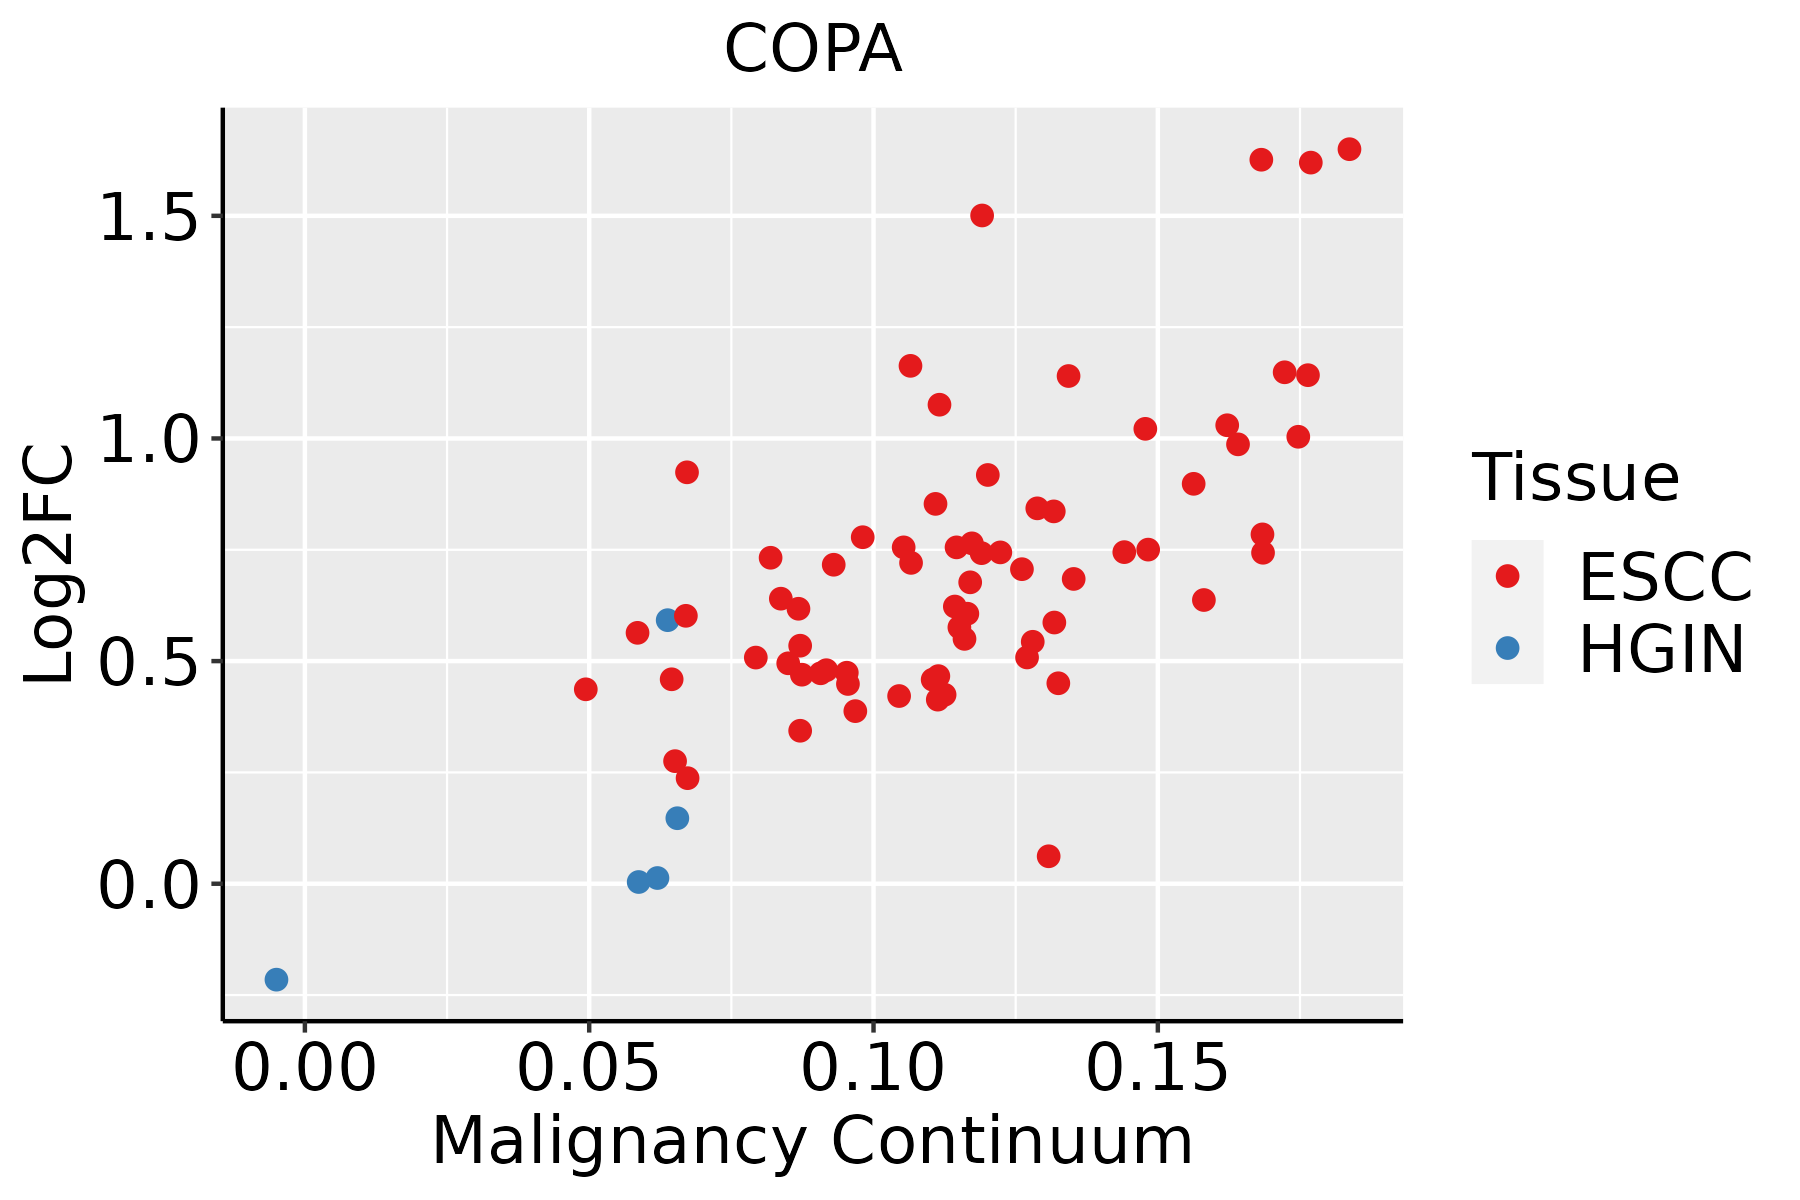
ESCC: Esophageal squamous cell carcinoma
HGIN: High-grade intraepithelial neoplasias
LGIN: Low-grade intraepithelial neoplasias
LiverThe image shows the transcriptomic changes along malignancy continuum.log2FC in expression of this searched gene in stem-like cells from each diseased tissue sample relative to stem-like cells in normal samples in each tissue plotted against the malignancy continuum. Samples are colored based on if they are from different disease stage.HCC: Hepatocellular carcinoma
NAFLD: Non-alcoholic fatty liver disease
LungThe image shows the transcriptomic changes along malignancy continuum.log2FC in expression of this searched gene in stem-like cells from each diseased tissue sample relative to stem-like cells in normal samples in each tissue plotted against the malignancy continuum. Samples are colored based on if they are from different disease stage.
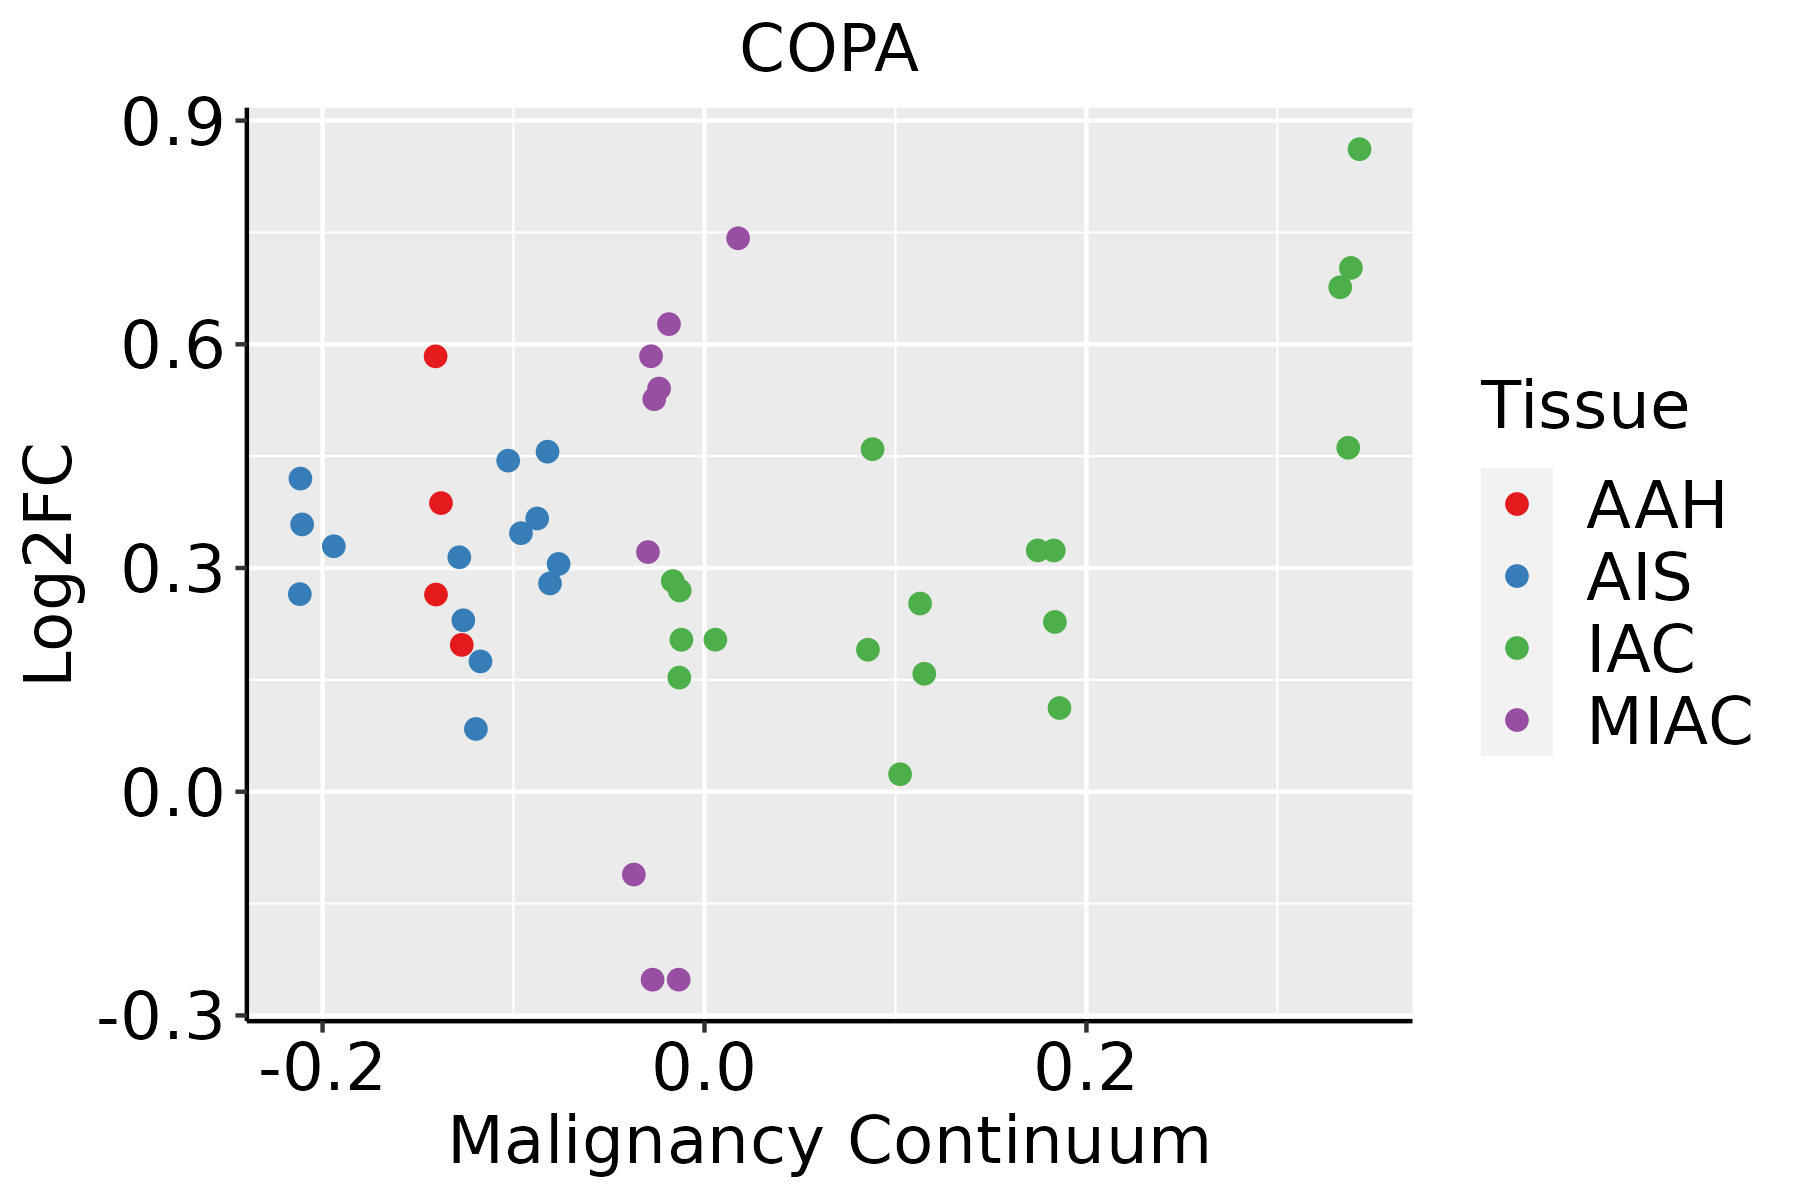
AAH: Atypical adenomatous hyperplasia
AIS: Adenocarcinoma in situ
IAC: Invasive lung adenocarcinoma
MIA: Minimally invasive adenocarcinoma
Oral CavityThe image shows the transcriptomic changes along malignancy continuum.log2FC in expression of this searched gene in stem-like cells from each diseased tissue sample relative to stem-like cells in normal samples in each tissue plotted against the malignancy continuum. Samples are colored based on if they are from different disease stage.
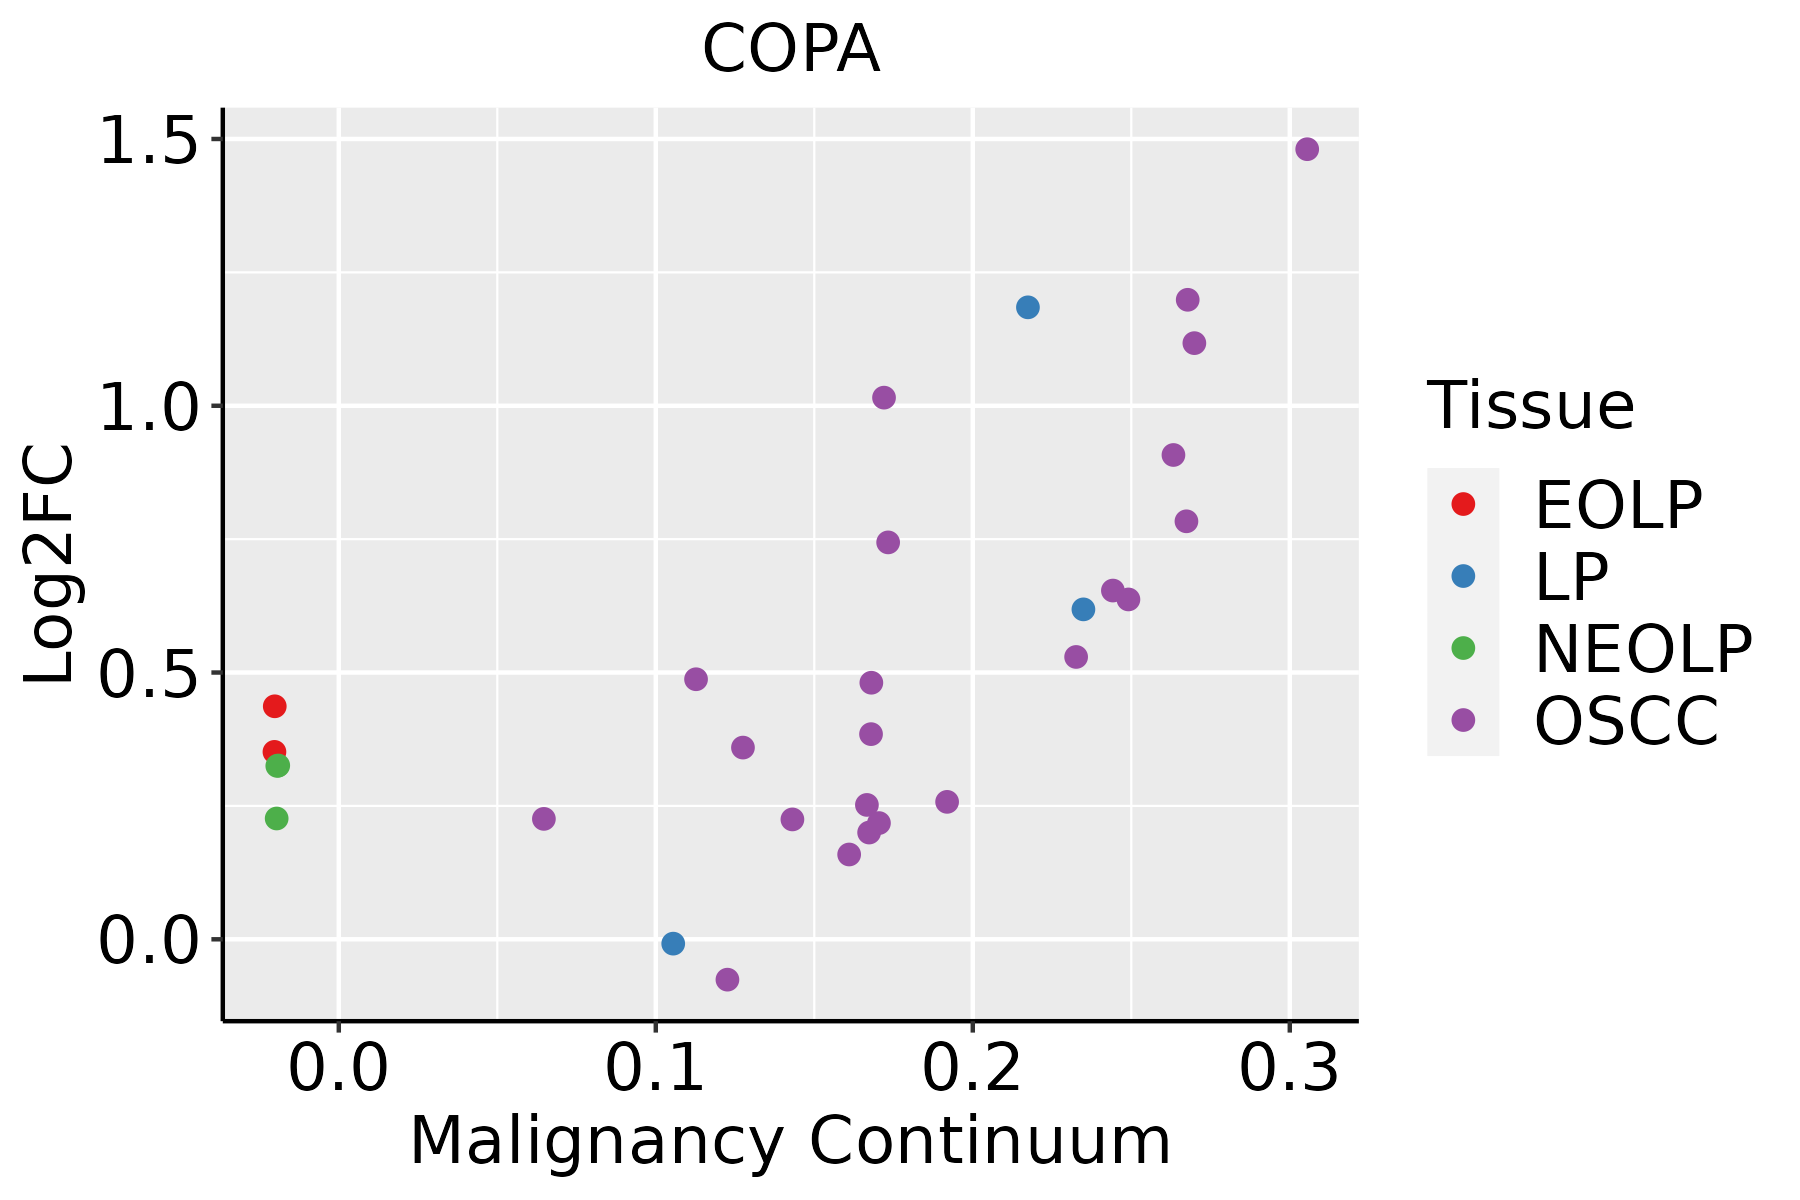
EOLP: Erosive Oral lichen planus
LP: leukoplakia
NEOLP: Non-erosive oral lichen planus
OSCC: Oral squamous cell carcinoma
ProstateThe image shows the transcriptomic changes along malignancy continuum.log2FC in expression of this searched gene in stem-like cells from each diseased tissue sample relative to stem-like cells in normal samples in each tissue plotted against the malignancy continuum. Samples are colored based on if they are from different disease stage.
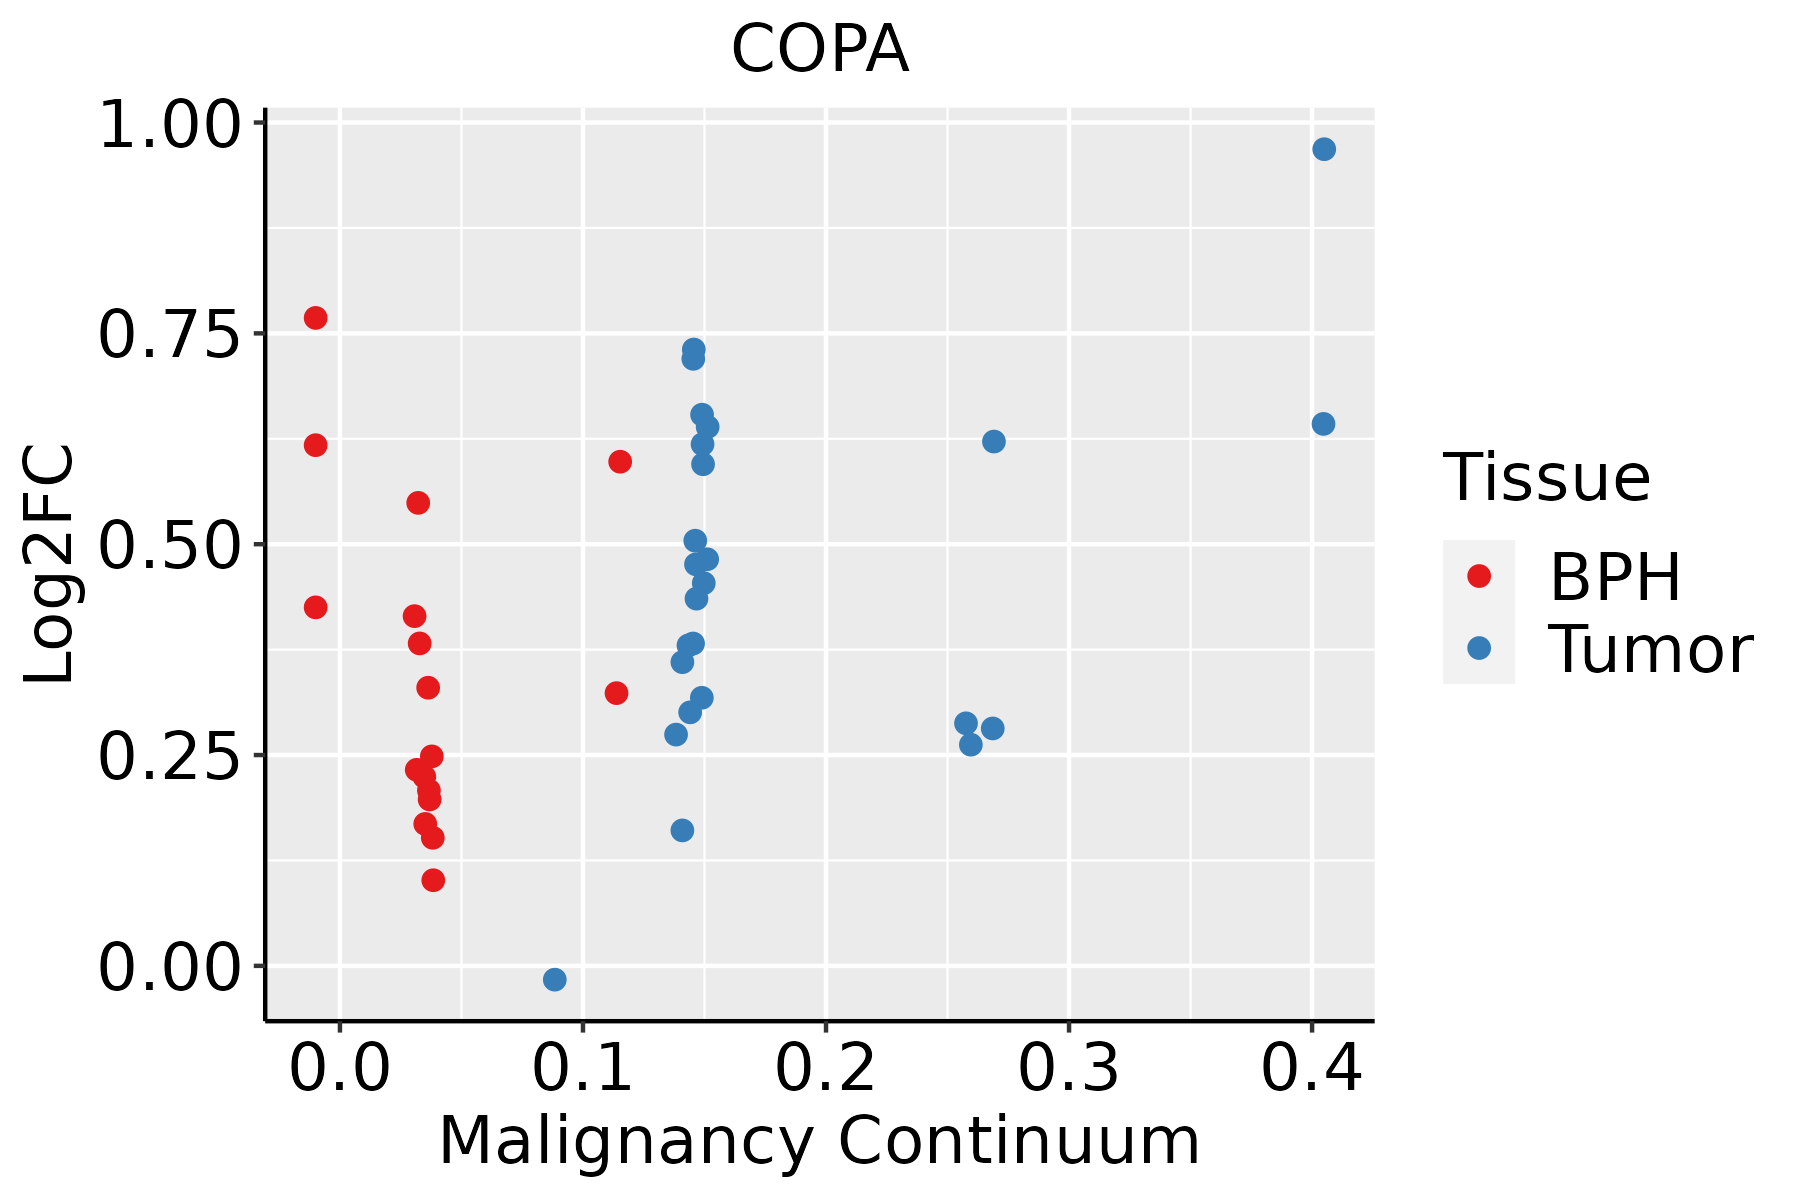
BPH: Benign Prostatic Hyperplasia
SkinThe image shows the transcriptomic changes along malignancy continuum.log2FC in expression of this searched gene in stem-like cells from each diseased tissue sample relative to stem-like cells in normal samples in each tissue plotted against the malignancy continuum. Samples are colored based on if they are from different disease stage.
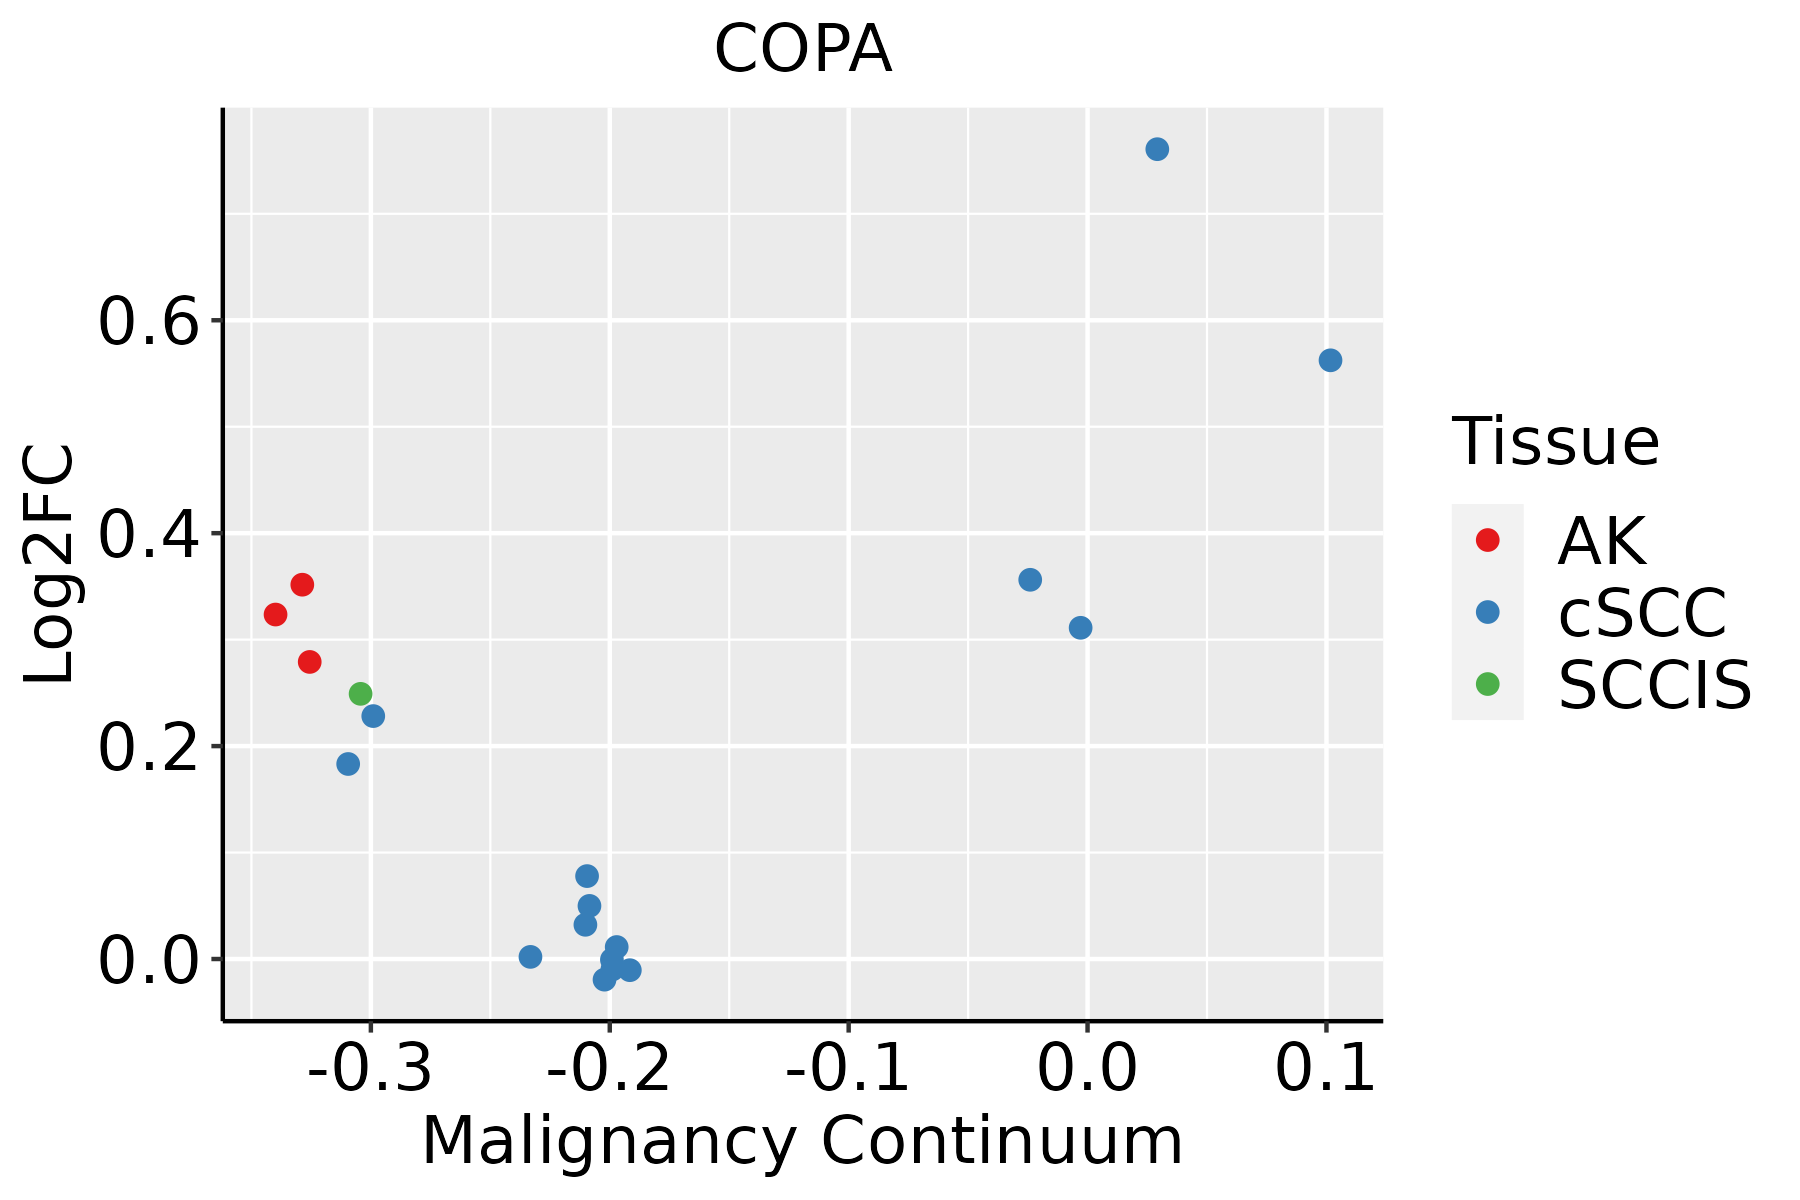
AK: Actinic keratosis
cSCC: Cutaneous squamous cell carcinoma
SCCIS:squamous cell carcinoma in situ
ThyroidThe image shows the transcriptomic changes along malignancy continuum.log2FC in expression of this searched gene in stem-like cells from each diseased tissue sample relative to stem-like cells in normal samples in each tissue plotted against the malignancy continuum. Samples are colored based on if they are from different disease stage.ATC: Anaplastic thyroid cancer
HT: Hashimoto's thyroiditis
PTC: Papillary thyroid cancer
∗log2FC in expression of this searched gene in stem-like cells from each diseased tissue sample relative to stem-like cells in normal samples in each tissue plotted against the malignancy continuum. Samples are colored based on if they are from different disease stage.

Top

Malignant transformation related pathway analysis

check buttonFind out the enriched GO biological processes and KEGG pathways involved in transition from healthy to precancer to cancer
check button Figure of enriched GO biological processes.
TissueDisease StageEnriched GO biological Processes
ColorectumADGO analysis - Figure of enriched GO biological processes: Top 15 enriched GO BP terms are showed in the bar plot of each disease state in each tissue. Each row represents a significant GO biological process which is colored according to the -log10(p.adjust).
ColorectumSERGO analysis - Figure of enriched GO biological processes: Top 15 enriched GO BP terms are showed in the bar plot of each disease state in each tissue. Each row represents a significant GO biological process which is colored according to the -log10(p.adjust).
ColorectumMSSGO analysis - Figure of enriched GO biological processes: Top 15 enriched GO BP terms are showed in the bar plot of each disease state in each tissue. Each row represents a significant GO biological process which is colored according to the -log10(p.adjust).
ColorectumMSI-HGO analysis - Figure of enriched GO biological processes: Top 15 enriched GO BP terms are showed in the bar plot of each disease state in each tissue. Each row represents a significant GO biological process which is colored according to the -log10(p.adjust).
ColorectumFAPGO analysis - Figure of enriched GO biological processes: Top 15 enriched GO BP terms are showed in the bar plot of each disease state in each tissue. Each row represents a significant GO biological process which is colored according to the -log10(p.adjust).
∗Top 15 enriched GO BP terms are showed in the bar plot of each disease state in each tissue. Each row represents a significant GO biological process which is colored according to the -log10(p.adjust).
Page: 1 2 3 4 5 6 7 8 9 

check button Enriched GO biological processes.
GO IDTissueDisease StageDescriptionGene RatioBg Ratiopvaluep.adjustCount
GO:0048193ColorectumADGolgi vesicle transport109/3918296/187231.80e-101.68e-08109
GO:0006890ColorectumADretrograde vesicle-mediated transport, Golgi to endoplasmic reticulum27/391852/187237.67e-072.70e-0527
GO:0050878ColorectumADregulation of body fluid levels108/3918379/187232.54e-043.20e-03108
GO:0006888ColorectumADendoplasmic reticulum to Golgi vesicle-mediated transport44/3918130/187234.13e-044.68e-0344
GO:0007589ColorectumADbody fluid secretion33/391893/187238.26e-048.13e-0333
GO:00481931ColorectumSERGolgi vesicle transport79/2897296/187234.20e-072.15e-0579
GO:00068901ColorectumSERretrograde vesicle-mediated transport, Golgi to endoplasmic reticulum20/289752/187234.80e-051.18e-0320
GO:0022600ColorectumSERdigestive system process29/2897104/187238.57e-041.05e-0229
GO:00068881ColorectumSERendoplasmic reticulum to Golgi vesicle-mediated transport34/2897130/187231.13e-031.29e-0234
GO:00508781ColorectumSERregulation of body fluid levels81/2897379/187231.28e-031.43e-0281
GO:00075891ColorectumSERbody fluid secretion26/289793/187231.49e-031.60e-0226
GO:0032941ColorectumSERsecretion by tissue13/289738/187233.40e-032.90e-0213
GO:00481932ColorectumMSSGolgi vesicle transport101/3467296/187239.09e-119.77e-09101
GO:00068902ColorectumMSSretrograde vesicle-mediated transport, Golgi to endoplasmic reticulum26/346752/187232.66e-071.10e-0526
GO:00068882ColorectumMSSendoplasmic reticulum to Golgi vesicle-mediated transport44/3467130/187232.17e-054.60e-0444
GO:00508782ColorectumMSSregulation of body fluid levels99/3467379/187231.40e-042.07e-0399
GO:00075892ColorectumMSSbody fluid secretion29/346793/187232.21e-031.84e-0229
GO:00226001ColorectumMSSdigestive system process31/3467104/187233.46e-032.59e-0231
GO:00481934ColorectumFAPGolgi vesicle transport77/2622296/187232.86e-082.62e-0677
GO:00068904ColorectumFAPretrograde vesicle-mediated transport, Golgi to endoplasmic reticulum18/262252/187231.48e-042.29e-0318
Page: 1 2 3 4 5 

check button Enriched KEGG pathways.
Pathway IDTissueDisease StageDescriptionGene RatioBg Ratiopvaluep.adjustqvalueCount
Page: 1 

Top

Cell-cell communication analysis

check buttonIdentification of potential cell-cell interactions between two cell types and their ligand-receptor pairs for different disease states
LigandReceptorLRpairPathwayTissueDisease Stage
Page: 1 

Top

Single-cell gene regulatory network inference analysis

check buttonFind out the significant the regulons (TFs) and the target genes of each regulon across cell types for different disease states
TFCell TypeTissueDisease StageTarget GeneRSSRegulon Activity
∗The dot plots of a searched regulon are shown for all cell subpopulations in each disease state of each tissue based on the regulon specific score inferred using pySCENIC and by calculating the average expression.
Page: 1 

Top

Somatic mutation of malignant transformation related genes

check buttonAnnotation of somatic variants for genes involved in malignant transformation
Hugo SymbolVariant ClassVariant ClassificationdbSNP RSHGVScHGVSpHGVSp ShortSWISSPROTBIOTYPESIFTPolyPhenTumor Sample BarcodeTissueHistologySexAgeStageTherapy TypesDrugsOutcome
COPASNVMissense_Mutationnovelc.2605N>Ap.Glu869Lysp.E869KP53621protein_codingtolerated(0.41)benign(0.001)TCGA-5L-AAT1-01Breastbreast invasive carcinomaFemale<65III/IVHormone TherapyletrozolSD
COPASNVMissense_Mutationc.2635N>Tp.Leu879Phep.L879FP53621protein_codingtolerated(0.06)benign(0.055)TCGA-A7-A26I-01Breastbreast invasive carcinomaFemale>=65I/IIChemotherapycytoxanSD
COPASNVMissense_Mutationnovelc.1597A>Gp.Ile533Valp.I533VP53621protein_codingtolerated(0.44)benign(0.003)TCGA-AC-A3W5-01Breastbreast invasive carcinomaFemale>=65I/IIChemotherapydocetaxelCR
COPASNVMissense_Mutationnovelc.2098N>Ap.Glu700Lysp.E700KP53621protein_codingdeleterious(0)probably_damaging(0.958)TCGA-AC-A5XS-01Breastbreast invasive carcinomaFemale>=65I/IIHormone TherapyfemaraSD
COPASNVMissense_Mutationrs774710055c.3697C>Tp.Arg1233Cysp.R1233CP53621protein_codingdeleterious_low_confidence(0)probably_damaging(0.986)TCGA-AN-A046-01Breastbreast invasive carcinomaFemale>=65I/IIUnknownUnknownSD
COPASNVMissense_Mutationnovelc.3115C>Tp.Arg1039Cysp.R1039CP53621protein_codingdeleterious(0)probably_damaging(0.946)TCGA-AN-A046-01Breastbreast invasive carcinomaFemale>=65I/IIUnknownUnknownSD
COPASNVMissense_Mutationc.198C>Gp.Phe66Leup.F66LP53621protein_codingtolerated(0.18)probably_damaging(0.999)TCGA-C8-A12K-01Breastbreast invasive carcinomaFemale>=65I/IIUnknownUnknownSD
COPASNVMissense_Mutationc.1109N>Tp.Tyr370Phep.Y370FP53621protein_codingtolerated(0.19)benign(0.034)TCGA-C8-A12L-01Breastbreast invasive carcinomaFemale>=65I/IIUnknownUnknownSD
COPASNVMissense_Mutationc.3244N>Gp.Leu1082Valp.L1082VP53621protein_codingtolerated(0.22)benign(0.094)TCGA-E2-A15O-01Breastbreast invasive carcinomaFemale>=65I/IIHormone TherapyarimidexPD
COPASNVMissense_Mutationc.214N>Cp.Asp72Hisp.D72HP53621protein_codingdeleterious(0)probably_damaging(1)TCGA-EW-A1J5-01Breastbreast invasive carcinomaFemale<65I/IIChemotherapyadriamycinSD
Page: 1 2 3 4 5 6 7 8 9 10 11 12 13 14 15 

Top

Related drugs of malignant transformation related genes

check buttonIdentification of chemicals and drugs interact with genes involved in malignant transfromation
(DGIdb 4.0)
Entrez IDSymbolCategoryInteraction TypesDrug Claim NameDrug NamePMIDs
Page: 1