
|
|||||
|
 | |
| |
| |
| |
| |
| |
|
Gene: COMTD1 |
Gene summary for COMTD1 |
| Gene information | Species | Human | Gene symbol | COMTD1 | Gene ID | 118881 |
| Gene name | catechol-O-methyltransferase domain containing 1 | |
| Gene Alias | COMTD1 | |
| Cytomap | 10q22.2 | |
| Gene Type | protein-coding | GO ID | GO:0008150 | UniProtAcc | Q86VU5 |
Top |
Malignant transformation analysis |
| Identification of the aberrant gene expression in precancerous and cancerous lesions by comparing the gene expression of stem-like cells in diseased tissues with normal stem cells |
| Entrez ID | Symbol | Replicates | Species | Organ | Tissue | Adj P-value | Log2FC | Malignancy |
| 118881 | COMTD1 | LZE4T | Human | Esophagus | ESCC | 2.73e-09 | 4.30e-01 | 0.0811 |
| 118881 | COMTD1 | LZE5T | Human | Esophagus | ESCC | 4.49e-04 | 4.66e-01 | 0.0514 |
| 118881 | COMTD1 | LZE7T | Human | Esophagus | ESCC | 4.76e-08 | 1.76e-01 | 0.0667 |
| 118881 | COMTD1 | LZE20T | Human | Esophagus | ESCC | 5.15e-09 | 4.74e-01 | 0.0662 |
| 118881 | COMTD1 | LZE22T | Human | Esophagus | ESCC | 6.22e-05 | 6.29e-01 | 0.068 |
| 118881 | COMTD1 | LZE24T | Human | Esophagus | ESCC | 9.78e-20 | 6.86e-01 | 0.0596 |
| 118881 | COMTD1 | P1T-E | Human | Esophagus | ESCC | 9.10e-16 | 1.05e+00 | 0.0875 |
| 118881 | COMTD1 | P2T-E | Human | Esophagus | ESCC | 2.20e-09 | 2.63e-01 | 0.1177 |
| 118881 | COMTD1 | P4T-E | Human | Esophagus | ESCC | 8.48e-34 | 1.07e+00 | 0.1323 |
| 118881 | COMTD1 | P5T-E | Human | Esophagus | ESCC | 2.04e-55 | 1.33e+00 | 0.1327 |
| 118881 | COMTD1 | P8T-E | Human | Esophagus | ESCC | 1.18e-15 | 4.90e-01 | 0.0889 |
| 118881 | COMTD1 | P9T-E | Human | Esophagus | ESCC | 4.60e-24 | 6.96e-01 | 0.1131 |
| 118881 | COMTD1 | P10T-E | Human | Esophagus | ESCC | 4.51e-12 | -6.10e-02 | 0.116 |
| 118881 | COMTD1 | P11T-E | Human | Esophagus | ESCC | 1.45e-15 | 1.04e+00 | 0.1426 |
| 118881 | COMTD1 | P12T-E | Human | Esophagus | ESCC | 6.59e-29 | 7.50e-01 | 0.1122 |
| 118881 | COMTD1 | P15T-E | Human | Esophagus | ESCC | 2.04e-33 | 8.52e-01 | 0.1149 |
| 118881 | COMTD1 | P16T-E | Human | Esophagus | ESCC | 2.85e-17 | 1.58e-01 | 0.1153 |
| 118881 | COMTD1 | P17T-E | Human | Esophagus | ESCC | 1.70e-12 | 8.38e-01 | 0.1278 |
| 118881 | COMTD1 | P19T-E | Human | Esophagus | ESCC | 5.86e-12 | 9.58e-01 | 0.1662 |
| 118881 | COMTD1 | P20T-E | Human | Esophagus | ESCC | 2.67e-48 | 1.32e+00 | 0.1124 |
| Page: 1 2 3 4 5 6 7 8 |
| Tissue | Expression Dynamics | Abbreviation |
| Esophagus | 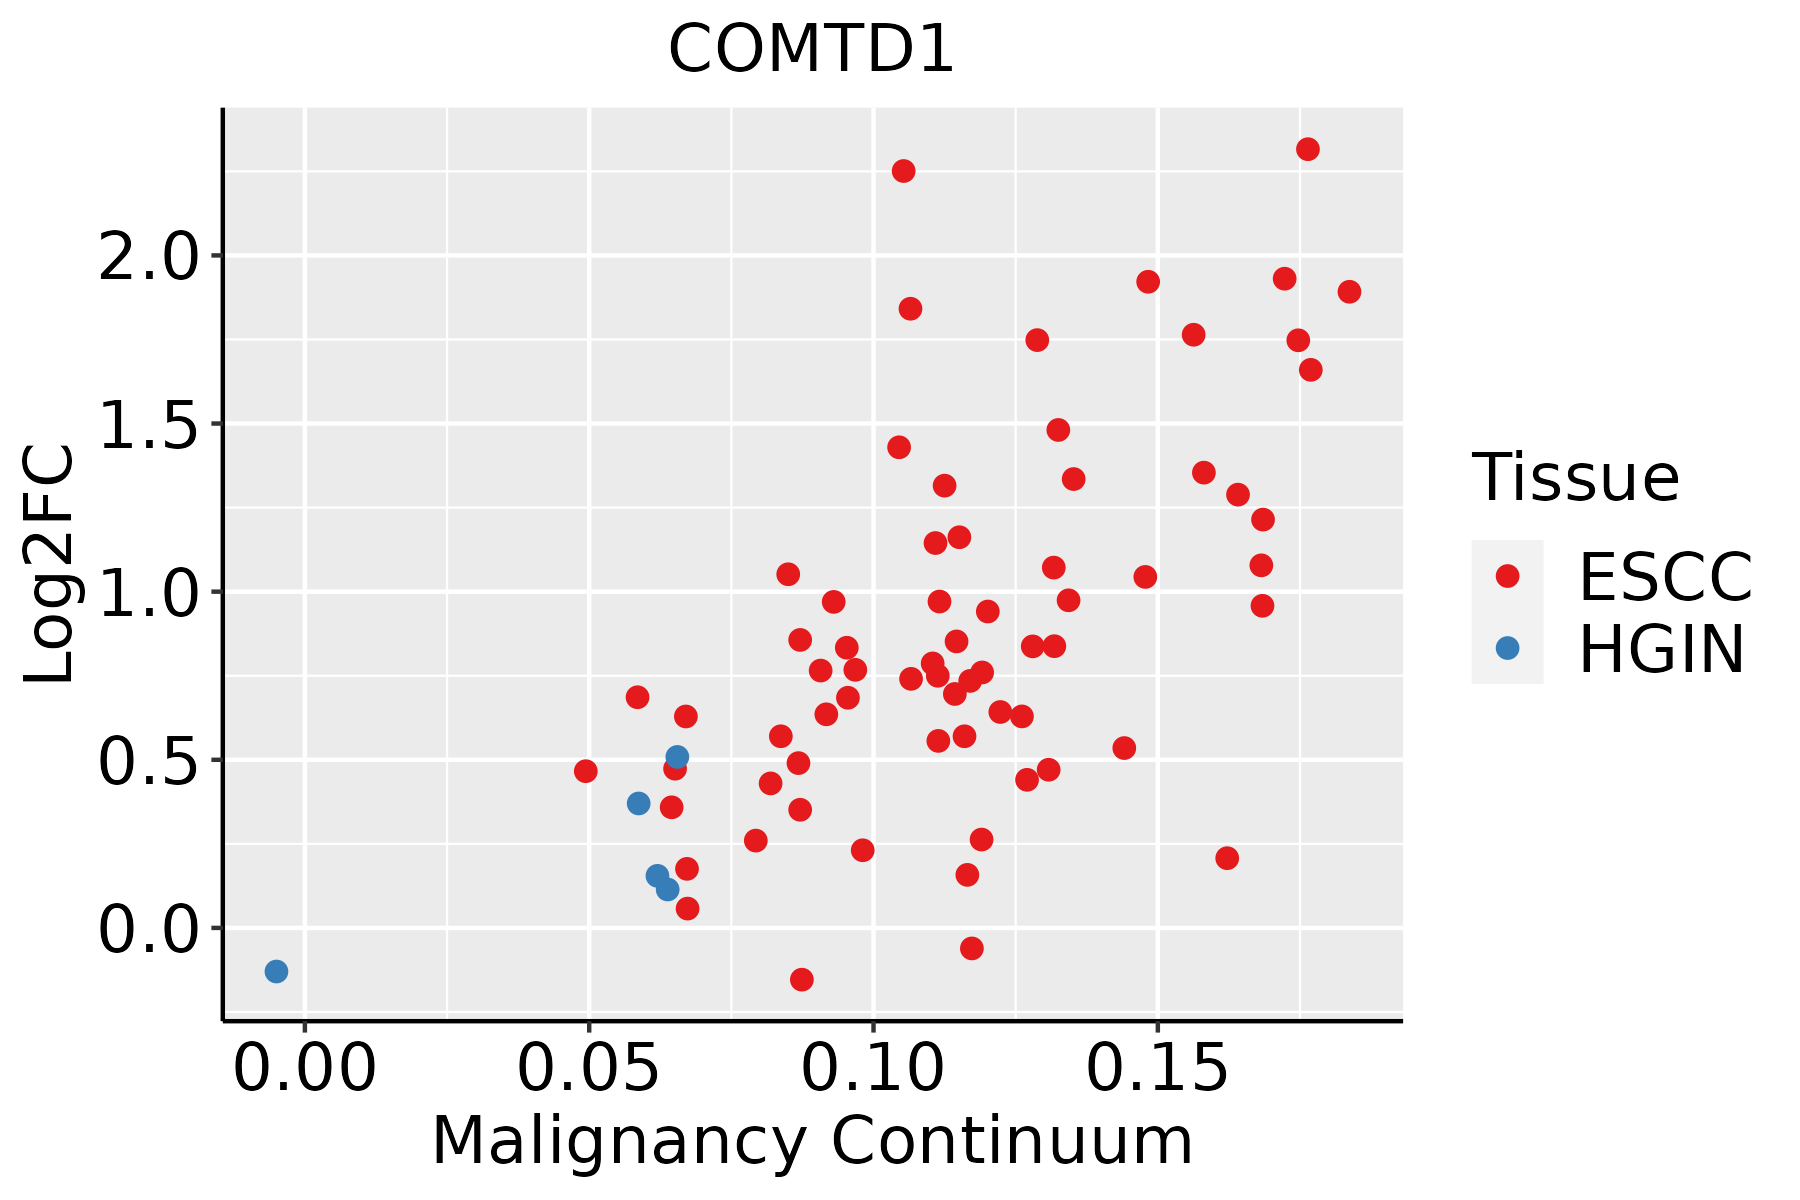 | ESCC: Esophageal squamous cell carcinoma |
| HGIN: High-grade intraepithelial neoplasias | ||
| LGIN: Low-grade intraepithelial neoplasias | ||
| GC | 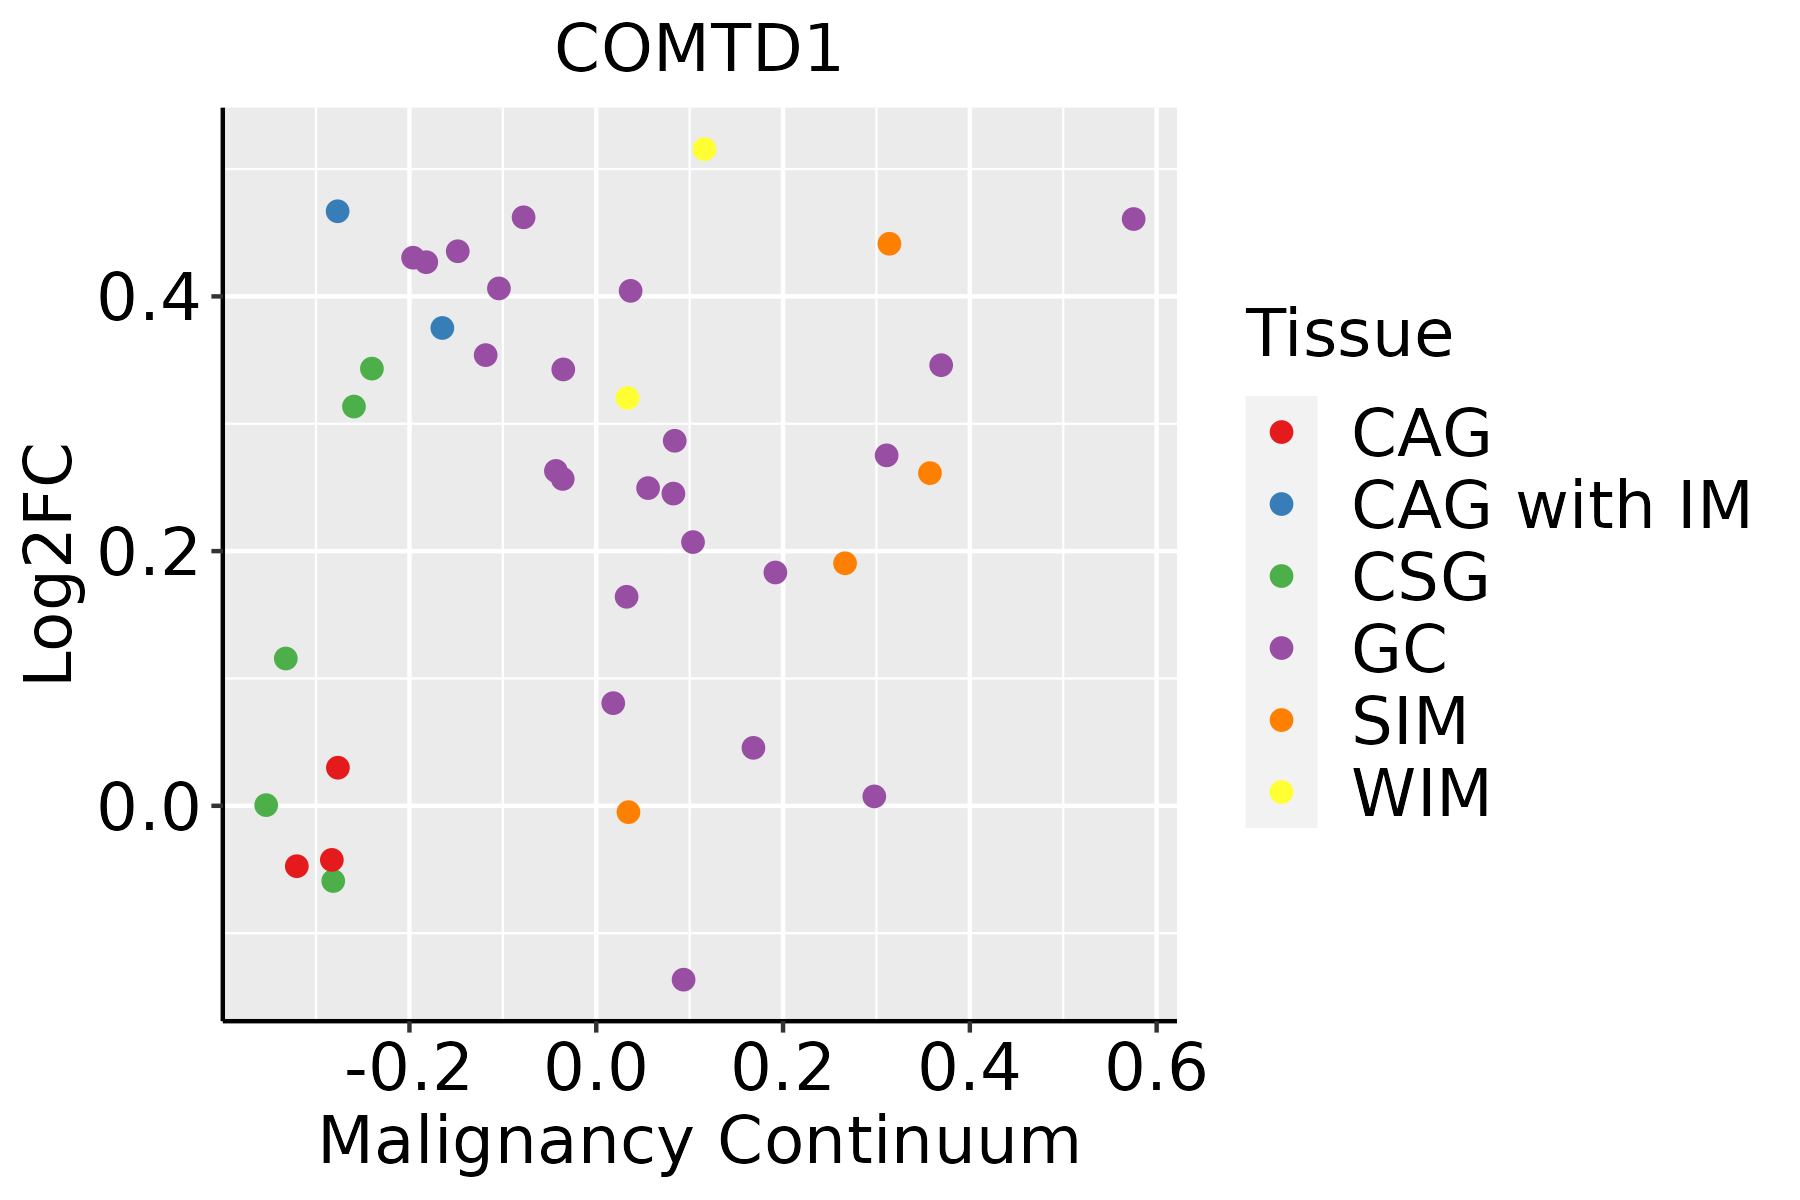 | CAG: Chronic atrophic gastritis |
| CAG with IM: Chronic atrophic gastritis with intestinal metaplasia | ||
| CSG: Chronic superficial gastritis | ||
| GC: Gastric cancer | ||
| SIM: Severe intestinal metaplasia | ||
| WIM: Wild intestinal metaplasia | ||
| Liver | 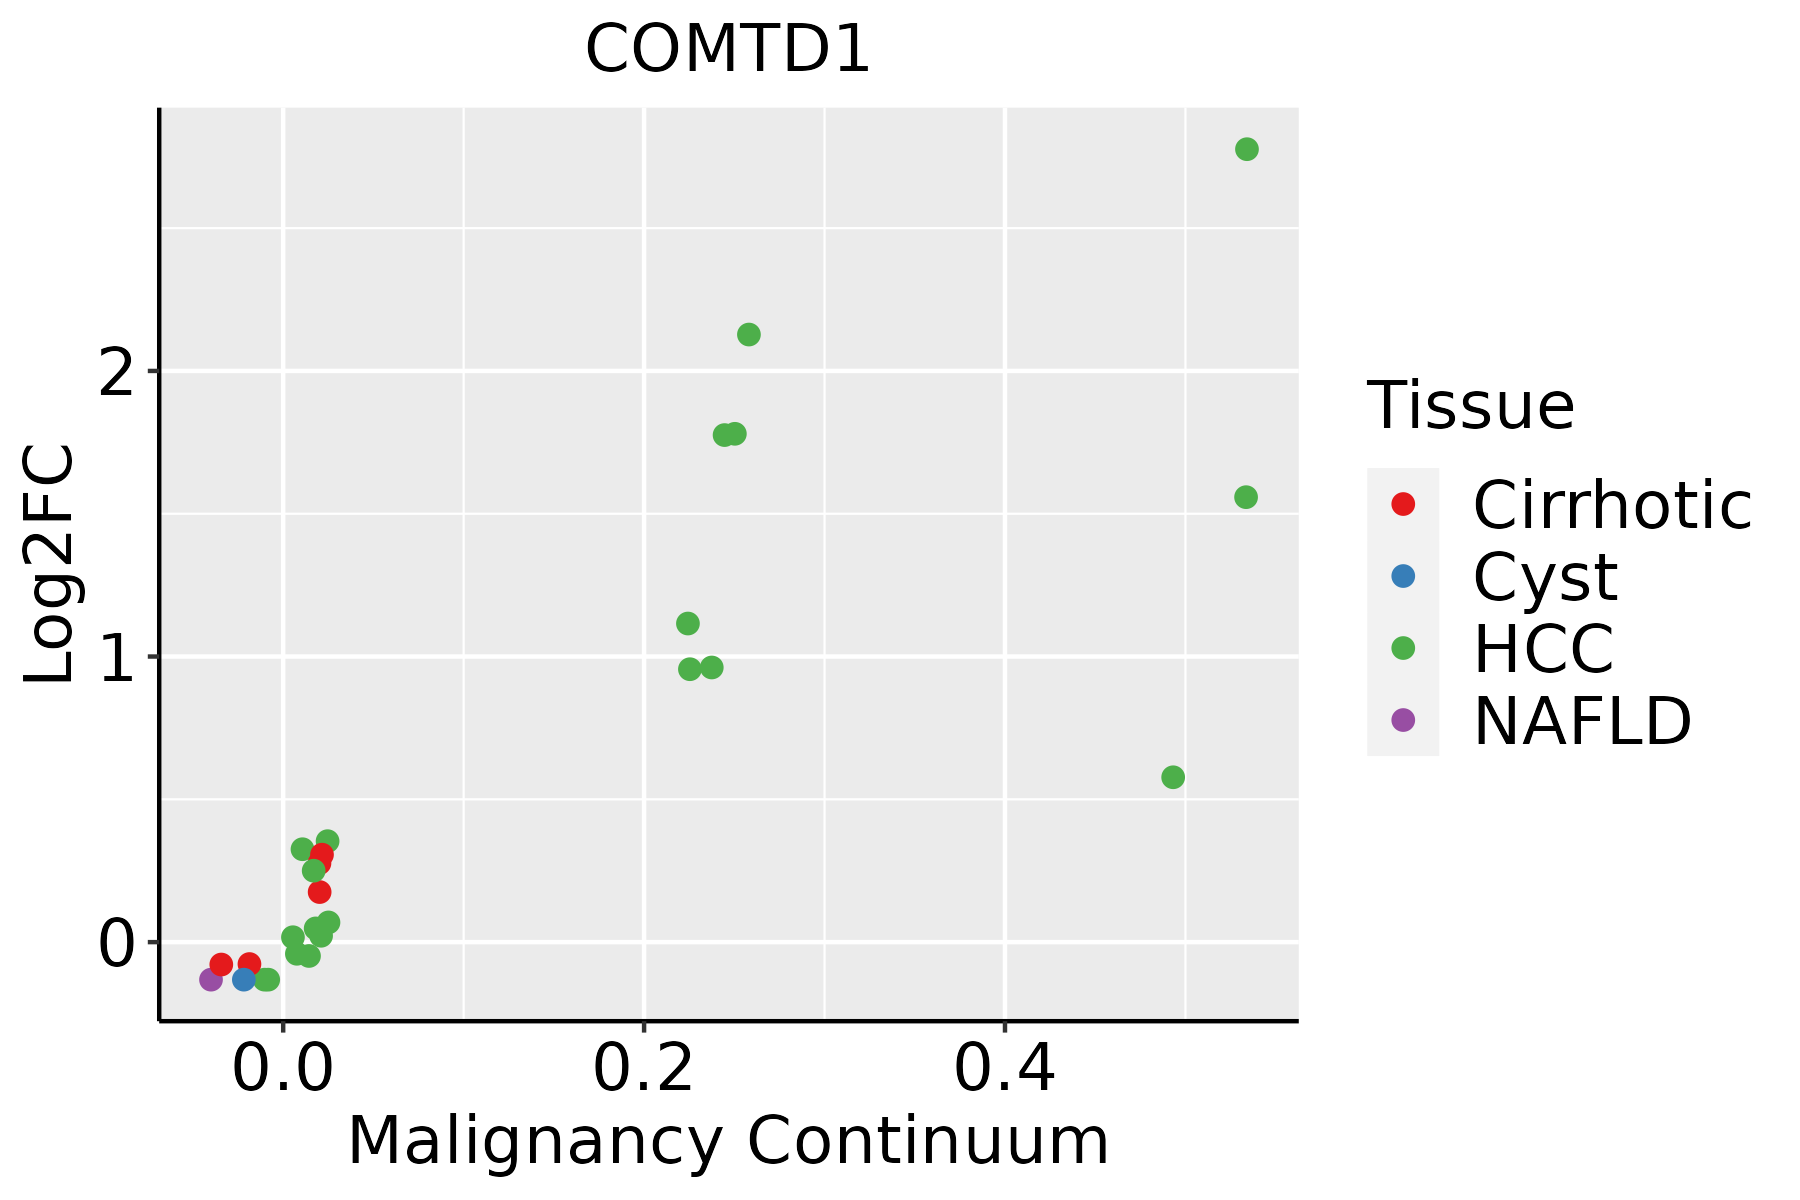 | HCC: Hepatocellular carcinoma |
| NAFLD: Non-alcoholic fatty liver disease | ||
| Oral Cavity |  | EOLP: Erosive Oral lichen planus |
| LP: leukoplakia | ||
| NEOLP: Non-erosive oral lichen planus | ||
| OSCC: Oral squamous cell carcinoma | ||
| Skin | 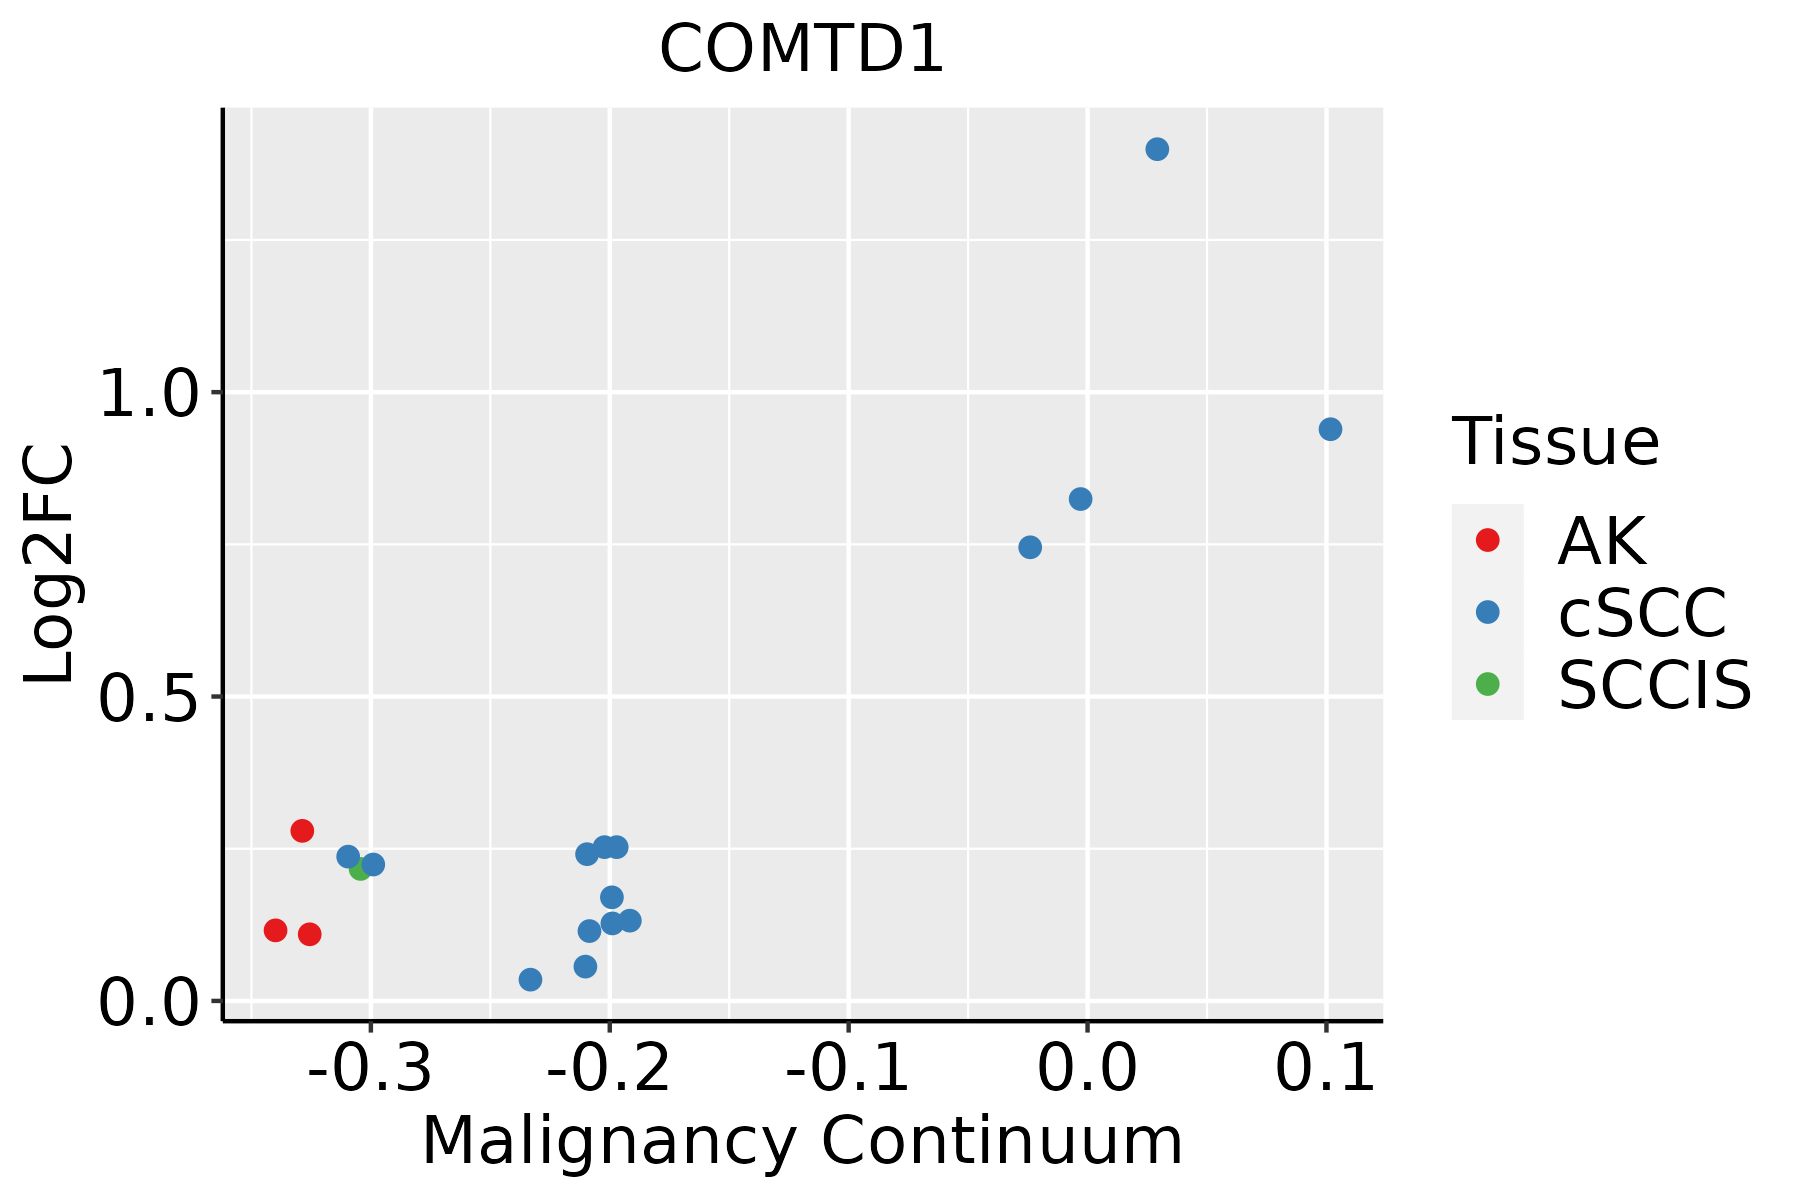 | AK: Actinic keratosis |
| cSCC: Cutaneous squamous cell carcinoma | ||
| SCCIS:squamous cell carcinoma in situ | ||
| Thyroid |  | ATC: Anaplastic thyroid cancer |
| HT: Hashimoto's thyroiditis | ||
| PTC: Papillary thyroid cancer |
| ∗log2FC in expression of this searched gene in stem-like cells from each diseased tissue sample relative to stem-like cells in normal samples in each tissue plotted against the malignancy continuum. Samples are colored based on if they are from different disease stage. |
Top |
Malignant transformation related pathway analysis |
| Find out the enriched GO biological processes and KEGG pathways involved in transition from healthy to precancer to cancer |
| Tissue | Disease Stage | Enriched GO biological Processes |
| Colorectum | AD |  |
| Colorectum | SER |  |
| Colorectum | MSS |  |
| Colorectum | MSI-H |  |
| Colorectum | FAP |  |
| ∗Top 15 enriched GO BP terms are showed in the bar plot of each disease state in each tissue. Each row represents a significant GO biological process which is colored according to the -log10(p.adjust). |
| Page: 1 2 3 4 5 6 7 8 9 |
| GO ID | Tissue | Disease Stage | Description | Gene Ratio | Bg Ratio | pvalue | p.adjust | Count |
| GO:00322592 | Esophagus | ESCC | methylation | 222/8552 | 364/18723 | 2.26e-09 | 5.09e-08 | 222 |
| GO:0032259 | Liver | HCC | methylation | 206/7958 | 364/18723 | 3.35e-08 | 7.53e-07 | 206 |
| GO:00322591 | Oral cavity | OSCC | methylation | 168/7305 | 364/18723 | 3.03e-03 | 1.31e-02 | 168 |
| GO:00322593 | Skin | cSCC | methylation | 120/4864 | 364/18723 | 1.61e-03 | 9.93e-03 | 120 |
| GO:00322594 | Thyroid | PTC | methylation | 146/5968 | 364/18723 | 4.99e-04 | 3.26e-03 | 146 |
| GO:003225911 | Thyroid | ATC | methylation | 148/6293 | 364/18723 | 2.69e-03 | 1.23e-02 | 148 |
| Page: 1 |
| Pathway ID | Tissue | Disease Stage | Description | Gene Ratio | Bg Ratio | pvalue | p.adjust | qvalue | Count |
| Page: 1 |
Top |
Cell-cell communication analysis |
| Identification of potential cell-cell interactions between two cell types and their ligand-receptor pairs for different disease states |
| Ligand | Receptor | LRpair | Pathway | Tissue | Disease Stage |
| Page: 1 |
Top |
Single-cell gene regulatory network inference analysis |
| Find out the significant the regulons (TFs) and the target genes of each regulon across cell types for different disease states |
| TF | Cell Type | Tissue | Disease Stage | Target Gene | RSS | Regulon Activity |
| ∗The dot plots of a searched regulon are shown for all cell subpopulations in each disease state of each tissue based on the regulon specific score inferred using pySCENIC and by calculating the average expression. |
| Page: 1 |
Top |
Somatic mutation of malignant transformation related genes |
| Annotation of somatic variants for genes involved in malignant transformation |
| Hugo Symbol | Variant Class | Variant Classification | dbSNP RS | HGVSc | HGVSp | HGVSp Short | SWISSPROT | BIOTYPE | SIFT | PolyPhen | Tumor Sample Barcode | Tissue | Histology | Sex | Age | Stage | Therapy Types | Drugs | Outcome |
| COMTD1 | SNV | Missense_Mutation | novel | c.713G>A | p.Arg238His | p.R238H | Q86VU5 | protein_coding | deleterious(0.02) | benign(0.236) | TCGA-2W-A8YY-01 | Cervix | cervical & endocervical cancer | Female | <65 | I/II | Chemotherapy | cisplatin | CR |
| COMTD1 | SNV | Missense_Mutation | rs748345837 | c.614G>A | p.Gly205Glu | p.G205E | Q86VU5 | protein_coding | deleterious(0) | probably_damaging(0.999) | TCGA-AJ-A3BD-01 | Endometrium | uterine corpus endometrioid carcinoma | Female | <65 | III/IV | Chemotherapy | carboplatin | CR |
| COMTD1 | SNV | Missense_Mutation | novel | c.658N>A | p.Leu220Met | p.L220M | Q86VU5 | protein_coding | tolerated(0.06) | probably_damaging(0.949) | TCGA-AP-A059-01 | Endometrium | uterine corpus endometrioid carcinoma | Female | >=65 | I/II | Unknown | Unknown | SD |
| COMTD1 | SNV | Missense_Mutation | novel | c.567G>T | p.Glu189Asp | p.E189D | Q86VU5 | protein_coding | tolerated(0.27) | benign(0.003) | TCGA-AX-A2HC-01 | Endometrium | uterine corpus endometrioid carcinoma | Female | <65 | III/IV | Chemotherapy | paclitaxel | PD |
| COMTD1 | SNV | Missense_Mutation | novel | c.724N>A | p.Asp242Asn | p.D242N | Q86VU5 | protein_coding | deleterious(0) | probably_damaging(1) | TCGA-B5-A11E-01 | Endometrium | uterine corpus endometrioid carcinoma | Female | <65 | I/II | Unknown | Unknown | SD |
| COMTD1 | SNV | Missense_Mutation | novel | c.769A>C | p.Thr257Pro | p.T257P | Q86VU5 | protein_coding | deleterious(0) | possibly_damaging(0.904) | TCGA-FI-A2D5-01 | Endometrium | uterine corpus endometrioid carcinoma | Female | <65 | III/IV | Chemotherapy | carboplatinum | PD |
| COMTD1 | SNV | Missense_Mutation | c.523N>A | p.Glu175Lys | p.E175K | Q86VU5 | protein_coding | deleterious(0.04) | benign(0.157) | TCGA-CN-A6V1-01 | Oral cavity | head & neck squamous cell carcinoma | Male | <65 | I/II | Immunotherapy | erbitux | CR | |
| COMTD1 | SNV | Missense_Mutation | novel | c.698N>A | p.Arg233Gln | p.R233Q | Q86VU5 | protein_coding | tolerated(0.06) | benign(0.039) | TCGA-CV-7177-01 | Oral cavity | head & neck squamous cell carcinoma | Female | >=65 | I/II | Unknown | Unknown | PD |
| COMTD1 | SNV | Missense_Mutation | novel | c.116N>A | p.Arg39Gln | p.R39Q | Q86VU5 | protein_coding | tolerated(0.64) | benign(0.143) | TCGA-QK-A6II-01 | Oral cavity | head & neck squamous cell carcinoma | Male | <65 | I/II | Chemotherapy | cisplatin | PD |
| COMTD1 | deletion | Frame_Shift_Del | novel | c.713delN | p.Arg238ProfsTer30 | p.R238Pfs*30 | Q86VU5 | protein_coding | TCGA-VQ-A8PB-01 | Stomach | stomach adenocarcinoma | Female | >=65 | I/II | Chemotherapy | fluorouracil | CR |
| Page: 1 2 |
Top |
Related drugs of malignant transformation related genes |
| Identification of chemicals and drugs interact with genes involved in malignant transfromation |
| (DGIdb 4.0) |
| Entrez ID | Symbol | Category | Interaction Types | Drug Claim Name | Drug Name | PMIDs |
| Page: 1 |

Copyright 2023-Present -The University of Texas Health Science Center at Houston |