
|
|||||
|
 | |
| |
| |
| |
| |
| |
|
Gene: COMMD9 |
Gene summary for COMMD9 |
| Gene information | Species | Human | Gene symbol | COMMD9 | Gene ID | 29099 |
| Gene name | COMM domain containing 9 | |
| Gene Alias | C11orf55 | |
| Cytomap | 11p13 | |
| Gene Type | protein-coding | GO ID | GO:0006810 | UniProtAcc | Q53FR9 |
Top |
Malignant transformation analysis |
| Identification of the aberrant gene expression in precancerous and cancerous lesions by comparing the gene expression of stem-like cells in diseased tissues with normal stem cells |
| Entrez ID | Symbol | Replicates | Species | Organ | Tissue | Adj P-value | Log2FC | Malignancy |
| 29099 | COMMD9 | LZE4T | Human | Esophagus | ESCC | 2.18e-10 | 3.15e-01 | 0.0811 |
| 29099 | COMMD9 | LZE5T | Human | Esophagus | ESCC | 1.39e-02 | 3.74e-01 | 0.0514 |
| 29099 | COMMD9 | LZE7T | Human | Esophagus | ESCC | 3.17e-04 | 2.92e-01 | 0.0667 |
| 29099 | COMMD9 | LZE8T | Human | Esophagus | ESCC | 1.19e-05 | 1.95e-01 | 0.067 |
| 29099 | COMMD9 | LZE20T | Human | Esophagus | ESCC | 3.29e-11 | 1.90e-01 | 0.0662 |
| 29099 | COMMD9 | LZE24T | Human | Esophagus | ESCC | 1.89e-15 | 4.91e-01 | 0.0596 |
| 29099 | COMMD9 | LZE6T | Human | Esophagus | ESCC | 1.09e-05 | 1.44e-01 | 0.0845 |
| 29099 | COMMD9 | P1T-E | Human | Esophagus | ESCC | 3.89e-07 | 2.91e-01 | 0.0875 |
| 29099 | COMMD9 | P2T-E | Human | Esophagus | ESCC | 2.95e-41 | 6.07e-01 | 0.1177 |
| 29099 | COMMD9 | P4T-E | Human | Esophagus | ESCC | 1.64e-16 | 3.57e-01 | 0.1323 |
| 29099 | COMMD9 | P5T-E | Human | Esophagus | ESCC | 6.33e-13 | 1.64e-01 | 0.1327 |
| 29099 | COMMD9 | P8T-E | Human | Esophagus | ESCC | 8.54e-29 | 5.03e-01 | 0.0889 |
| 29099 | COMMD9 | P9T-E | Human | Esophagus | ESCC | 3.70e-28 | 3.77e-01 | 0.1131 |
| 29099 | COMMD9 | P10T-E | Human | Esophagus | ESCC | 1.47e-30 | 4.30e-01 | 0.116 |
| 29099 | COMMD9 | P11T-E | Human | Esophagus | ESCC | 5.93e-20 | 8.11e-01 | 0.1426 |
| 29099 | COMMD9 | P12T-E | Human | Esophagus | ESCC | 3.23e-33 | 4.92e-01 | 0.1122 |
| 29099 | COMMD9 | P15T-E | Human | Esophagus | ESCC | 8.92e-21 | 3.99e-01 | 0.1149 |
| 29099 | COMMD9 | P16T-E | Human | Esophagus | ESCC | 2.35e-22 | 3.34e-01 | 0.1153 |
| 29099 | COMMD9 | P17T-E | Human | Esophagus | ESCC | 4.41e-10 | 5.54e-01 | 0.1278 |
| 29099 | COMMD9 | P19T-E | Human | Esophagus | ESCC | 2.40e-05 | 5.57e-01 | 0.1662 |
| Page: 1 2 3 4 5 6 |
| Tissue | Expression Dynamics | Abbreviation |
| Esophagus | 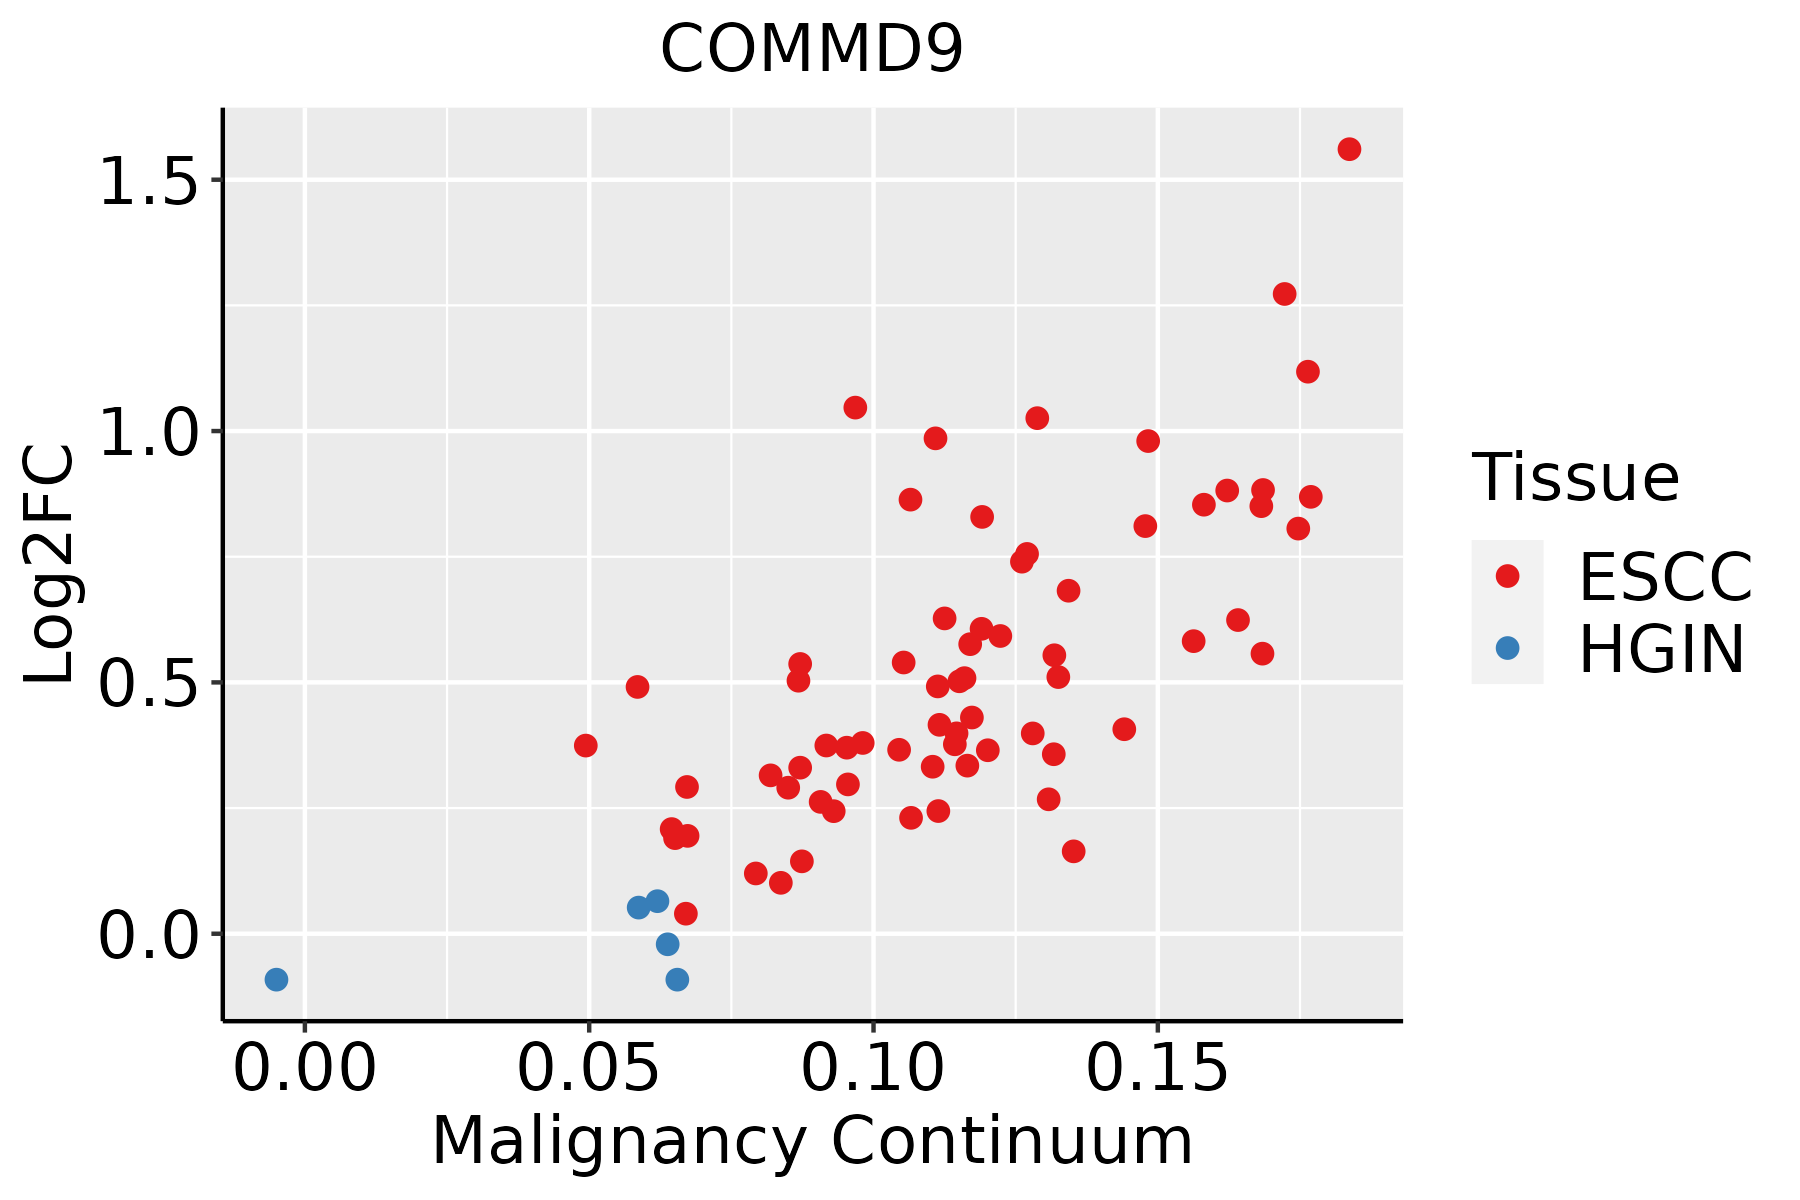 | ESCC: Esophageal squamous cell carcinoma |
| HGIN: High-grade intraepithelial neoplasias | ||
| LGIN: Low-grade intraepithelial neoplasias | ||
| Liver | 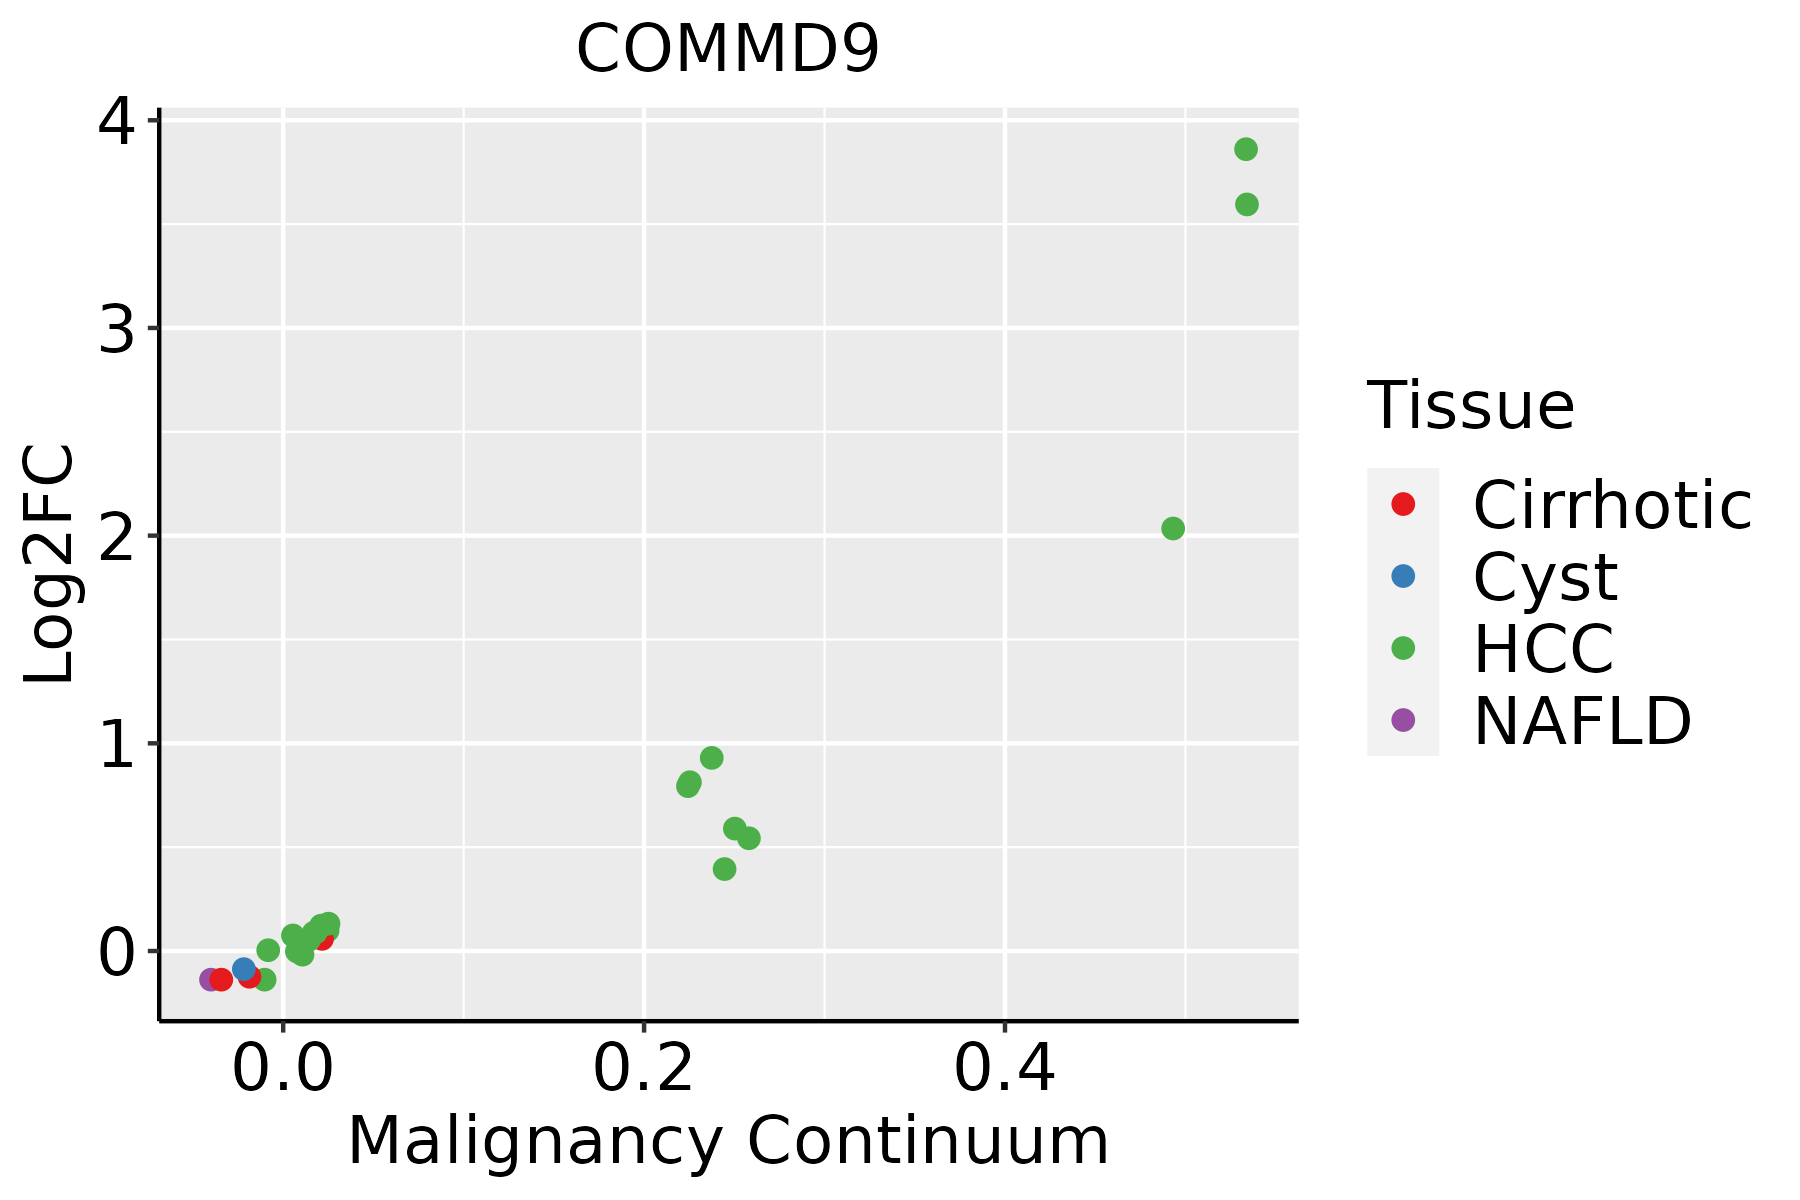 | HCC: Hepatocellular carcinoma |
| NAFLD: Non-alcoholic fatty liver disease | ||
| Oral Cavity | 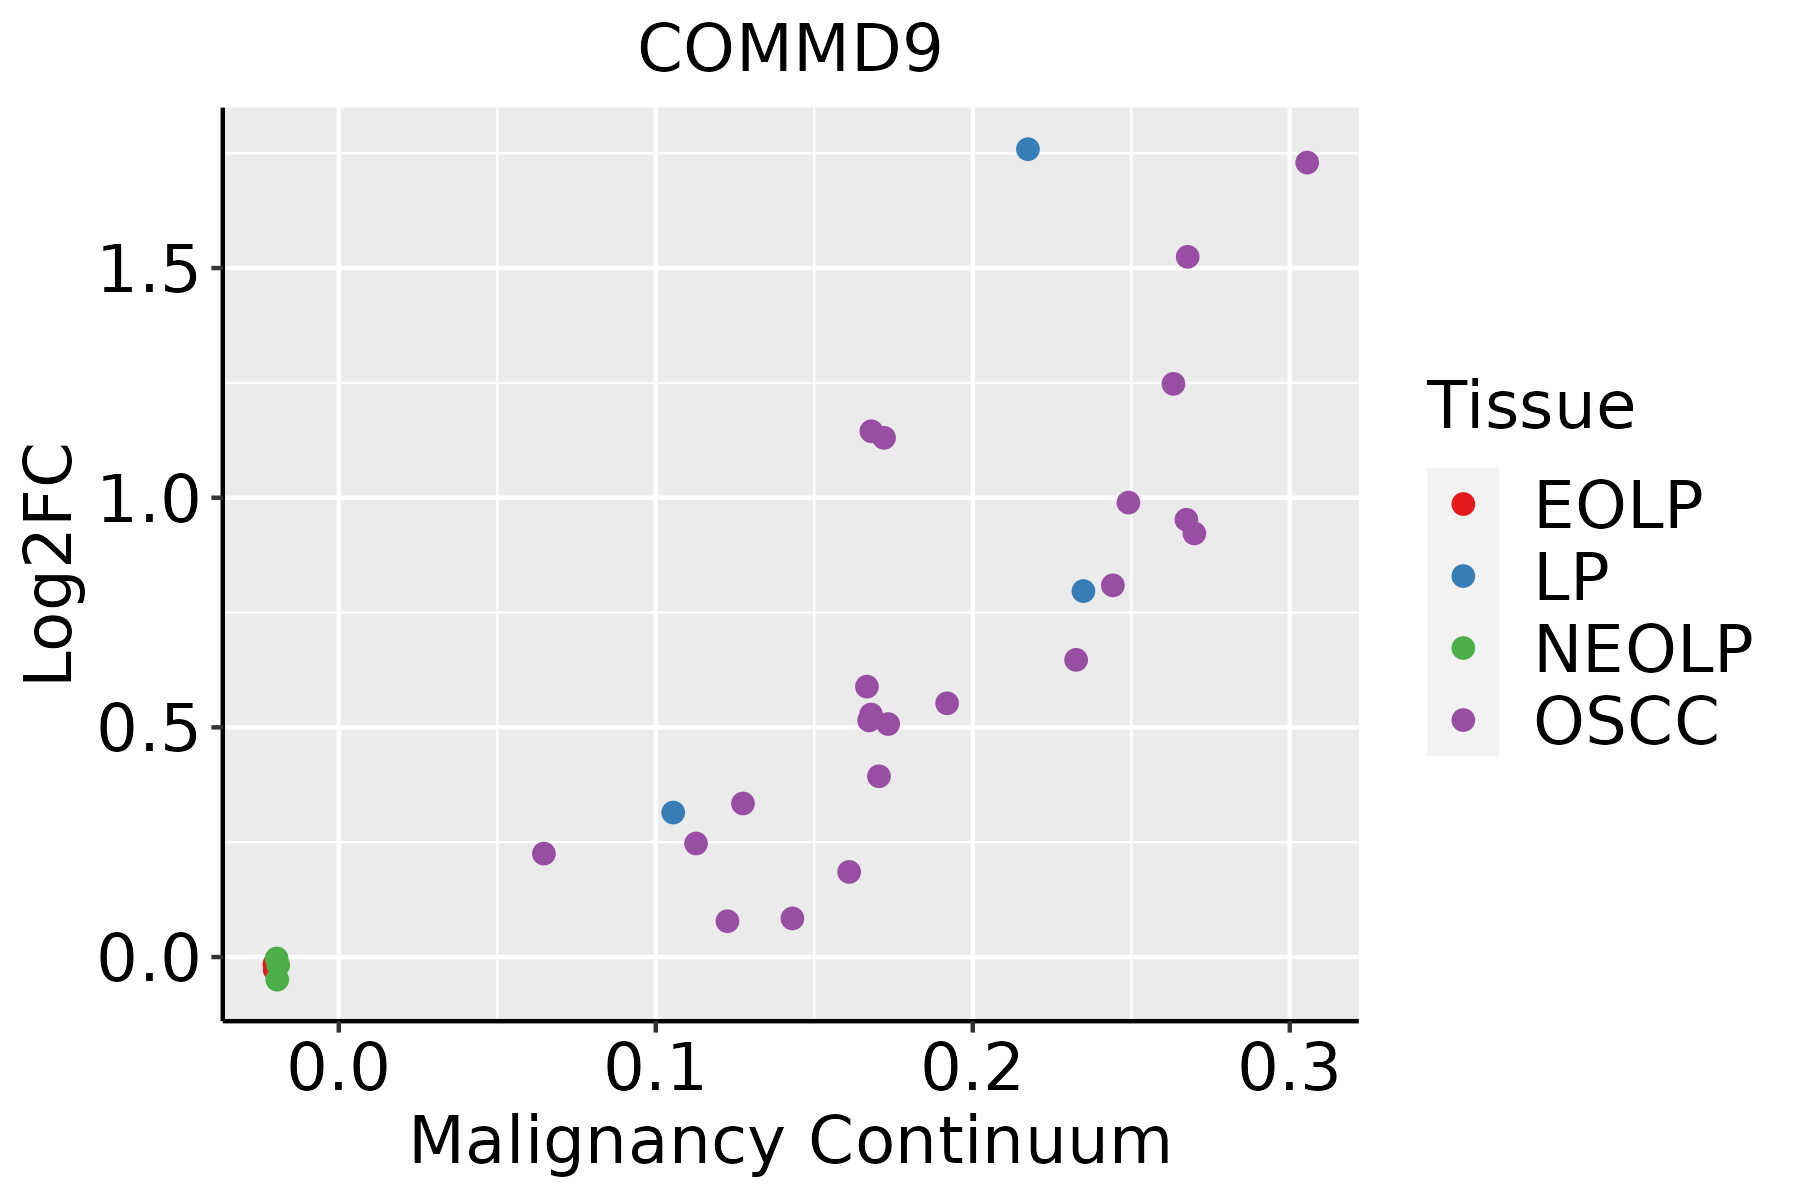 | EOLP: Erosive Oral lichen planus |
| LP: leukoplakia | ||
| NEOLP: Non-erosive oral lichen planus | ||
| OSCC: Oral squamous cell carcinoma | ||
| Skin | 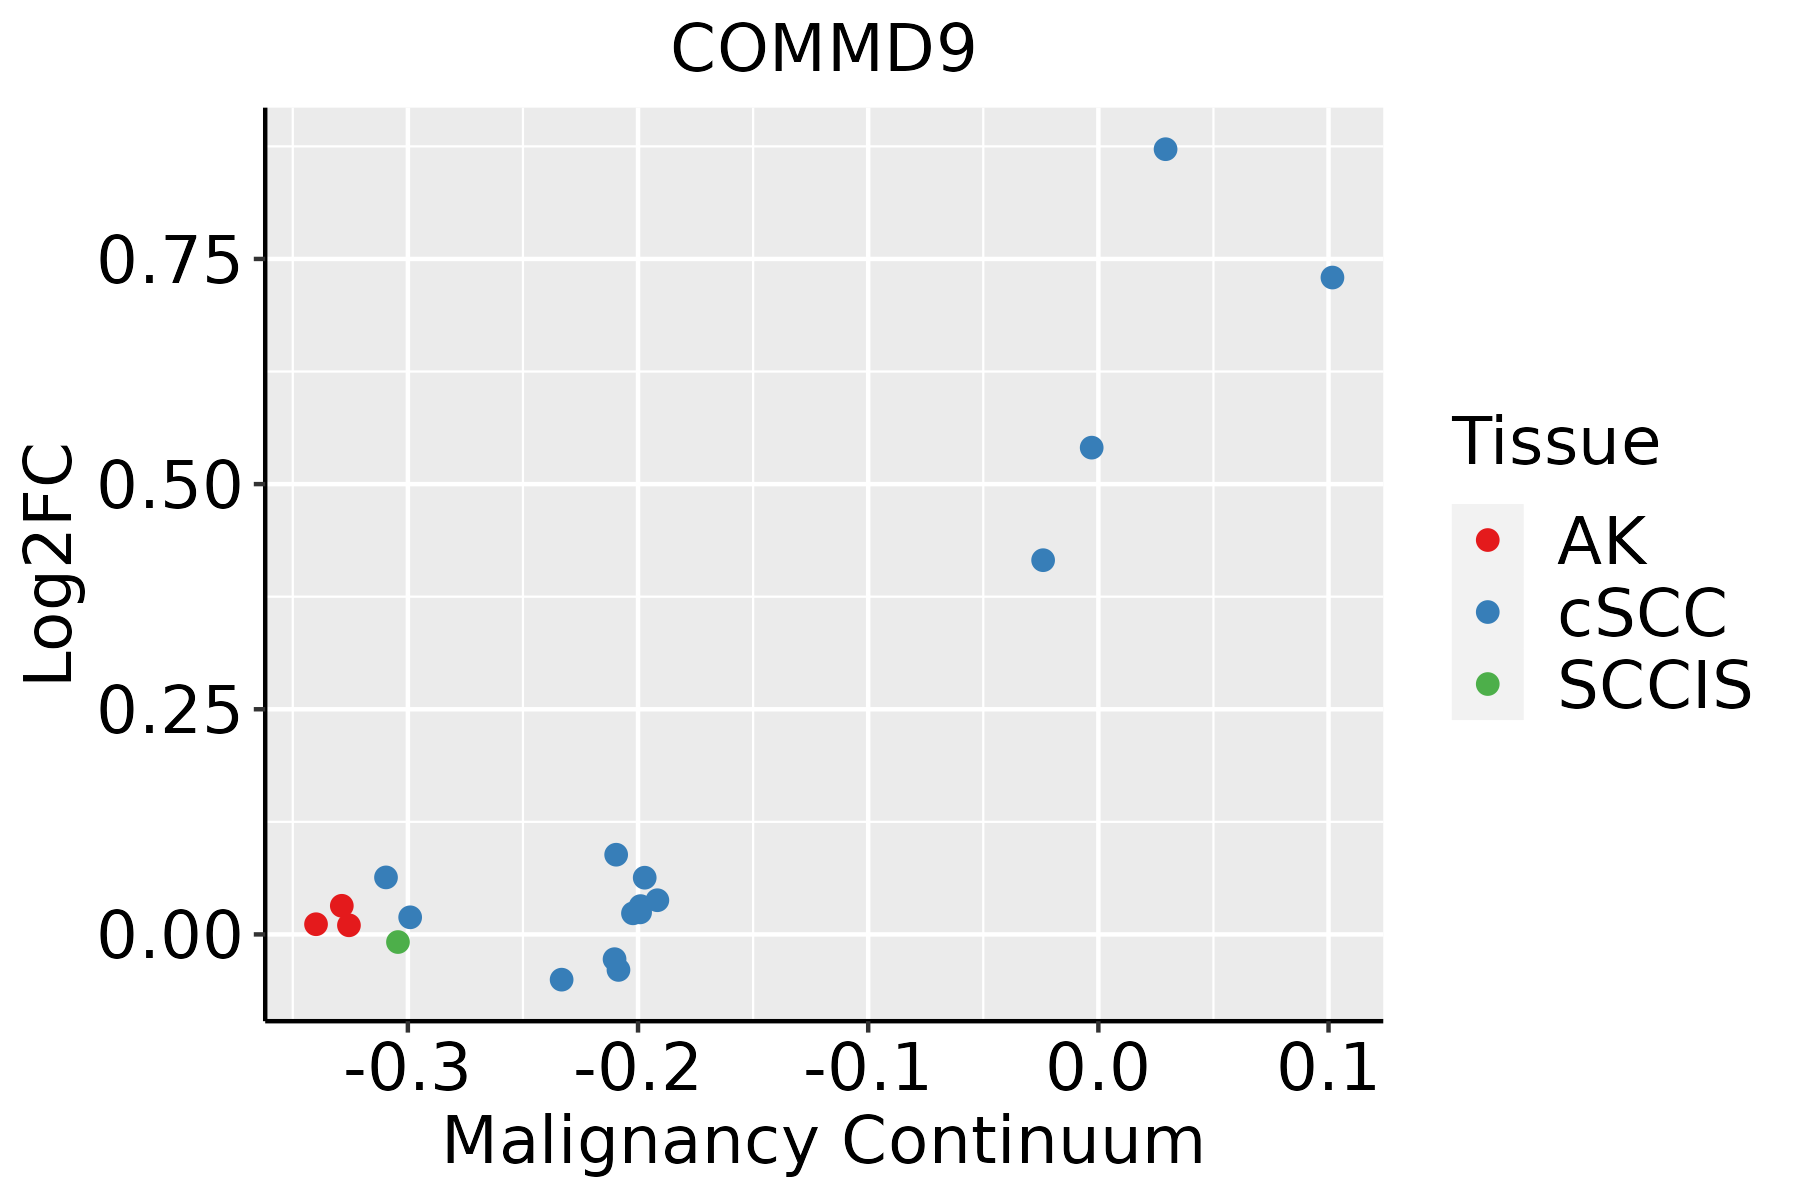 | AK: Actinic keratosis |
| cSCC: Cutaneous squamous cell carcinoma | ||
| SCCIS:squamous cell carcinoma in situ |
| ∗log2FC in expression of this searched gene in stem-like cells from each diseased tissue sample relative to stem-like cells in normal samples in each tissue plotted against the malignancy continuum. Samples are colored based on if they are from different disease stage. |
Top |
Malignant transformation related pathway analysis |
| Find out the enriched GO biological processes and KEGG pathways involved in transition from healthy to precancer to cancer |
| Tissue | Disease Stage | Enriched GO biological Processes |
| Colorectum | AD |  |
| Colorectum | SER |  |
| Colorectum | MSS |  |
| Colorectum | MSI-H |  |
| Colorectum | FAP |  |
| ∗Top 15 enriched GO BP terms are showed in the bar plot of each disease state in each tissue. Each row represents a significant GO biological process which is colored according to the -log10(p.adjust). |
| Page: 1 2 3 4 5 6 7 8 9 |
| GO ID | Tissue | Disease Stage | Description | Gene Ratio | Bg Ratio | pvalue | p.adjust | Count |
| GO:005508811 | Liver | Cirrhotic | lipid homeostasis | 74/4634 | 167/18723 | 2.46e-08 | 8.51e-07 | 74 |
| GO:004263211 | Liver | Cirrhotic | cholesterol homeostasis | 46/4634 | 96/18723 | 7.15e-07 | 1.52e-05 | 46 |
| GO:005509211 | Liver | Cirrhotic | sterol homeostasis | 46/4634 | 97/18723 | 1.04e-06 | 2.13e-05 | 46 |
| GO:00550882 | Liver | HCC | lipid homeostasis | 103/7958 | 167/18723 | 4.27e-07 | 7.18e-06 | 103 |
| GO:005509221 | Liver | HCC | sterol homeostasis | 59/7958 | 97/18723 | 2.06e-04 | 1.58e-03 | 59 |
| GO:004263221 | Liver | HCC | cholesterol homeostasis | 58/7958 | 96/18723 | 2.99e-04 | 2.13e-03 | 58 |
| Page: 1 |
| Pathway ID | Tissue | Disease Stage | Description | Gene Ratio | Bg Ratio | pvalue | p.adjust | qvalue | Count |
| Page: 1 |
Top |
Cell-cell communication analysis |
| Identification of potential cell-cell interactions between two cell types and their ligand-receptor pairs for different disease states |
| Ligand | Receptor | LRpair | Pathway | Tissue | Disease Stage |
| Page: 1 |
Top |
Single-cell gene regulatory network inference analysis |
| Find out the significant the regulons (TFs) and the target genes of each regulon across cell types for different disease states |
| TF | Cell Type | Tissue | Disease Stage | Target Gene | RSS | Regulon Activity |
| ∗The dot plots of a searched regulon are shown for all cell subpopulations in each disease state of each tissue based on the regulon specific score inferred using pySCENIC and by calculating the average expression. |
| Page: 1 |
Top |
Somatic mutation of malignant transformation related genes |
| Annotation of somatic variants for genes involved in malignant transformation |
| Hugo Symbol | Variant Class | Variant Classification | dbSNP RS | HGVSc | HGVSp | HGVSp Short | SWISSPROT | BIOTYPE | SIFT | PolyPhen | Tumor Sample Barcode | Tissue | Histology | Sex | Age | Stage | Therapy Types | Drugs | Outcome |
| COMMD9 | SNV | Missense_Mutation | c.409G>A | p.Asp137Asn | p.D137N | Q9P000 | protein_coding | deleterious(0.01) | probably_damaging(0.999) | TCGA-AC-A23H-01 | Breast | breast invasive carcinoma | Female | >=65 | I/II | Unknown | Unknown | PD | |
| COMMD9 | SNV | Missense_Mutation | rs750912709 | c.482N>C | p.Gly161Ala | p.G161A | Q9P000 | protein_coding | tolerated(0.19) | benign(0.279) | TCGA-AC-A8OS-01 | Breast | breast invasive carcinoma | Female | >=65 | I/II | Unknown | Unknown | SD |
| COMMD9 | SNV | Missense_Mutation | novel | c.39N>C | p.Gln13His | p.Q13H | Q9P000 | protein_coding | tolerated(0.05) | possibly_damaging(0.864) | TCGA-GH-A9DA-01 | Cervix | cervical & endocervical cancer | Female | <65 | I/II | Unknown | Unknown | SD |
| COMMD9 | SNV | Missense_Mutation | c.490N>T | p.Pro164Ser | p.P164S | Q9P000 | protein_coding | tolerated(0.09) | benign(0.355) | TCGA-AF-2693-01 | Colorectum | rectum adenocarcinoma | Male | >=65 | I/II | Unknown | Unknown | SD | |
| COMMD9 | insertion | In_Frame_Ins | novel | c.321_322insCTGATC | p.Ser107_Thr108insLeuIle | p.S107_T108insLI | Q9P000 | protein_coding | TCGA-AM-5820-01 | Colorectum | colon adenocarcinoma | Female | <65 | I/II | Unknown | Unknown | SD | ||
| COMMD9 | SNV | Missense_Mutation | rs759005618 | c.481G>A | p.Gly161Arg | p.G161R | Q9P000 | protein_coding | tolerated(0.14) | benign(0.018) | TCGA-AJ-A3EL-01 | Endometrium | uterine corpus endometrioid carcinoma | Female | <65 | I/II | Unknown | Unknown | SD |
| COMMD9 | SNV | Missense_Mutation | novel | c.175G>A | p.Glu59Lys | p.E59K | Q9P000 | protein_coding | tolerated(0.33) | benign(0) | TCGA-AJ-A5DW-01 | Endometrium | uterine corpus endometrioid carcinoma | Female | <65 | I/II | Unknown | Unknown | SD |
| COMMD9 | SNV | Missense_Mutation | c.64N>T | p.Asp22Tyr | p.D22Y | Q9P000 | protein_coding | deleterious(0) | probably_damaging(0.999) | TCGA-AP-A056-01 | Endometrium | uterine corpus endometrioid carcinoma | Female | <65 | I/II | Unknown | Unknown | SD | |
| COMMD9 | SNV | Missense_Mutation | novel | c.40N>C | p.Ser14Arg | p.S14R | Q9P000 | protein_coding | tolerated(0.35) | benign(0.084) | TCGA-AP-A059-01 | Endometrium | uterine corpus endometrioid carcinoma | Female | >=65 | I/II | Unknown | Unknown | SD |
| COMMD9 | SNV | Missense_Mutation | novel | c.121N>C | p.Lys41Gln | p.K41Q | Q9P000 | protein_coding | tolerated(0.67) | benign(0.02) | TCGA-AP-A1E0-01 | Endometrium | uterine corpus endometrioid carcinoma | Female | <65 | III/IV | Chemotherapy | paclitaxel | SD |
| Page: 1 2 |
Top |
Related drugs of malignant transformation related genes |
| Identification of chemicals and drugs interact with genes involved in malignant transfromation |
| (DGIdb 4.0) |
| Entrez ID | Symbol | Category | Interaction Types | Drug Claim Name | Drug Name | PMIDs |
| Page: 1 |

Copyright 2023-Present -The University of Texas Health Science Center at Houston |