
|
|||||
|
 | |
| |
| |
| |
| |
| |
|
Gene: COMMD7 |
Gene summary for COMMD7 |
| Gene information | Species | Human | Gene symbol | COMMD7 | Gene ID | 149951 |
| Gene name | COMM domain containing 7 | |
| Gene Alias | C20orf92 | |
| Cytomap | 20q11.21 | |
| Gene Type | protein-coding | GO ID | GO:0006139 | UniProtAcc | Q86VX2 |
Top |
Malignant transformation analysis |
| Identification of the aberrant gene expression in precancerous and cancerous lesions by comparing the gene expression of stem-like cells in diseased tissues with normal stem cells |
| Entrez ID | Symbol | Replicates | Species | Organ | Tissue | Adj P-value | Log2FC | Malignancy |
| 149951 | COMMD7 | HTA11_2487_2000001011 | Human | Colorectum | SER | 1.32e-08 | 2.15e-01 | -0.1808 |
| 149951 | COMMD7 | HTA11_2951_2000001011 | Human | Colorectum | AD | 3.40e-03 | 2.80e-01 | 0.0216 |
| 149951 | COMMD7 | HTA11_1938_2000001011 | Human | Colorectum | AD | 1.67e-02 | 1.39e-01 | -0.0811 |
| 149951 | COMMD7 | HTA11_78_2000001011 | Human | Colorectum | AD | 6.68e-05 | 1.98e-01 | -0.1088 |
| 149951 | COMMD7 | HTA11_347_2000001011 | Human | Colorectum | AD | 2.93e-13 | 2.57e-01 | -0.1954 |
| 149951 | COMMD7 | HTA11_411_2000001011 | Human | Colorectum | SER | 2.78e-05 | 3.68e-01 | -0.2602 |
| 149951 | COMMD7 | HTA11_3361_2000001011 | Human | Colorectum | AD | 7.91e-05 | 2.02e-01 | -0.1207 |
| 149951 | COMMD7 | HTA11_83_2000001011 | Human | Colorectum | SER | 1.79e-04 | 2.04e-01 | -0.1526 |
| 149951 | COMMD7 | HTA11_696_2000001011 | Human | Colorectum | AD | 4.28e-10 | 2.09e-01 | -0.1464 |
| 149951 | COMMD7 | HTA11_866_2000001011 | Human | Colorectum | AD | 9.55e-09 | 1.85e-01 | -0.1001 |
| 149951 | COMMD7 | HTA11_1391_2000001011 | Human | Colorectum | AD | 7.00e-13 | 2.74e-01 | -0.059 |
| 149951 | COMMD7 | HTA11_2992_2000001011 | Human | Colorectum | SER | 1.72e-05 | 3.10e-01 | -0.1706 |
| 149951 | COMMD7 | HTA11_5212_2000001011 | Human | Colorectum | AD | 5.12e-05 | 2.37e-01 | -0.2061 |
| 149951 | COMMD7 | HTA11_5216_2000001011 | Human | Colorectum | SER | 2.79e-07 | 4.15e-01 | -0.1462 |
| 149951 | COMMD7 | HTA11_546_2000001011 | Human | Colorectum | AD | 2.65e-04 | 2.15e-01 | -0.0842 |
| 149951 | COMMD7 | HTA11_866_3004761011 | Human | Colorectum | AD | 3.29e-15 | 3.14e-01 | 0.096 |
| 149951 | COMMD7 | HTA11_4255_2000001011 | Human | Colorectum | SER | 3.40e-03 | 2.22e-01 | 0.0446 |
| 149951 | COMMD7 | HTA11_10623_2000001011 | Human | Colorectum | AD | 8.98e-03 | 1.87e-01 | -0.0177 |
| 149951 | COMMD7 | HTA11_6801_2000001011 | Human | Colorectum | SER | 9.67e-09 | 3.87e-01 | 0.0171 |
| 149951 | COMMD7 | HTA11_10711_2000001011 | Human | Colorectum | AD | 1.67e-03 | 1.54e-01 | 0.0338 |
| Page: 1 2 3 4 5 6 7 |
| Tissue | Expression Dynamics | Abbreviation |
| Colorectum (GSE201348) |  | FAP: Familial adenomatous polyposis |
| CRC: Colorectal cancer | ||
| Colorectum (HTA11) |  | AD: Adenomas |
| SER: Sessile serrated lesions | ||
| MSI-H: Microsatellite-high colorectal cancer | ||
| MSS: Microsatellite stable colorectal cancer | ||
| Esophagus |  | ESCC: Esophageal squamous cell carcinoma |
| HGIN: High-grade intraepithelial neoplasias | ||
| LGIN: Low-grade intraepithelial neoplasias | ||
| Oral Cavity |  | EOLP: Erosive Oral lichen planus |
| LP: leukoplakia | ||
| NEOLP: Non-erosive oral lichen planus | ||
| OSCC: Oral squamous cell carcinoma | ||
| Prostate | 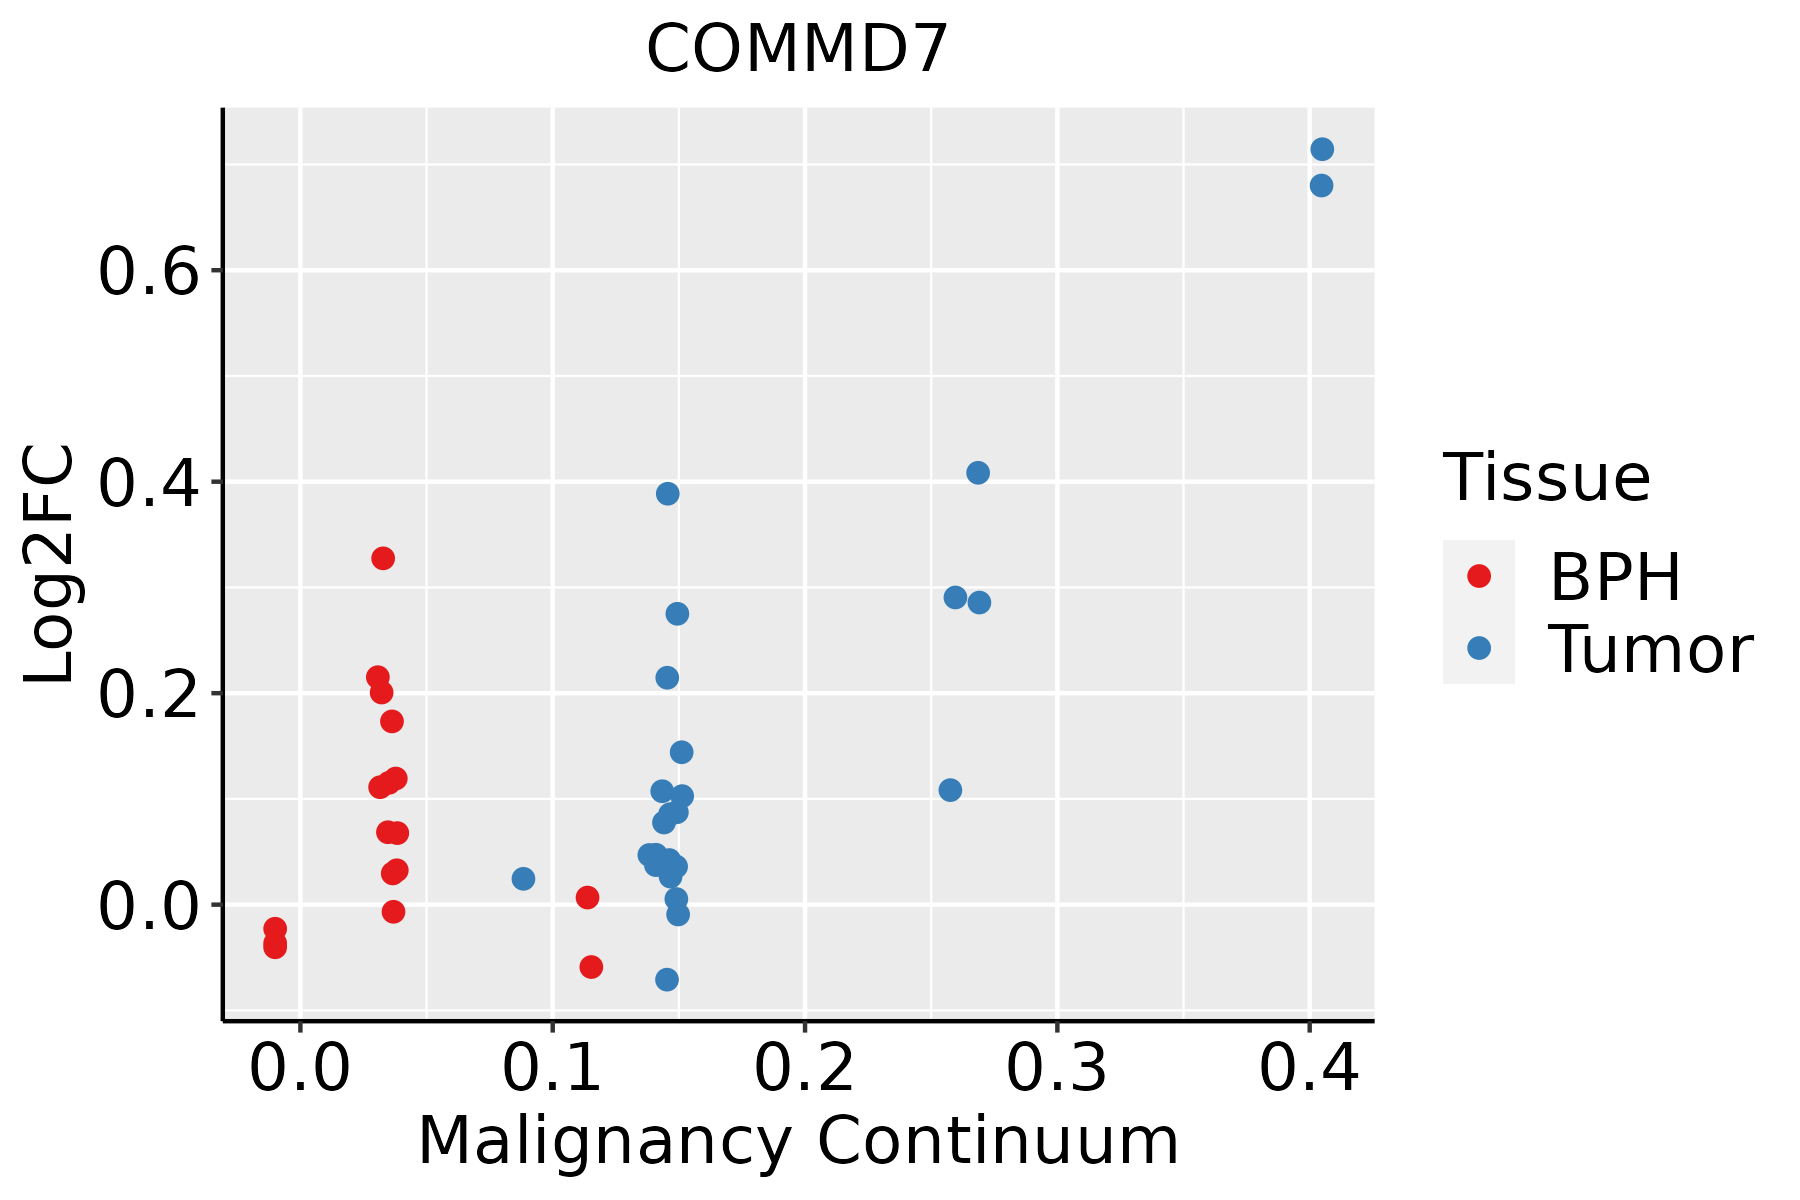 | BPH: Benign Prostatic Hyperplasia |
| Skin | 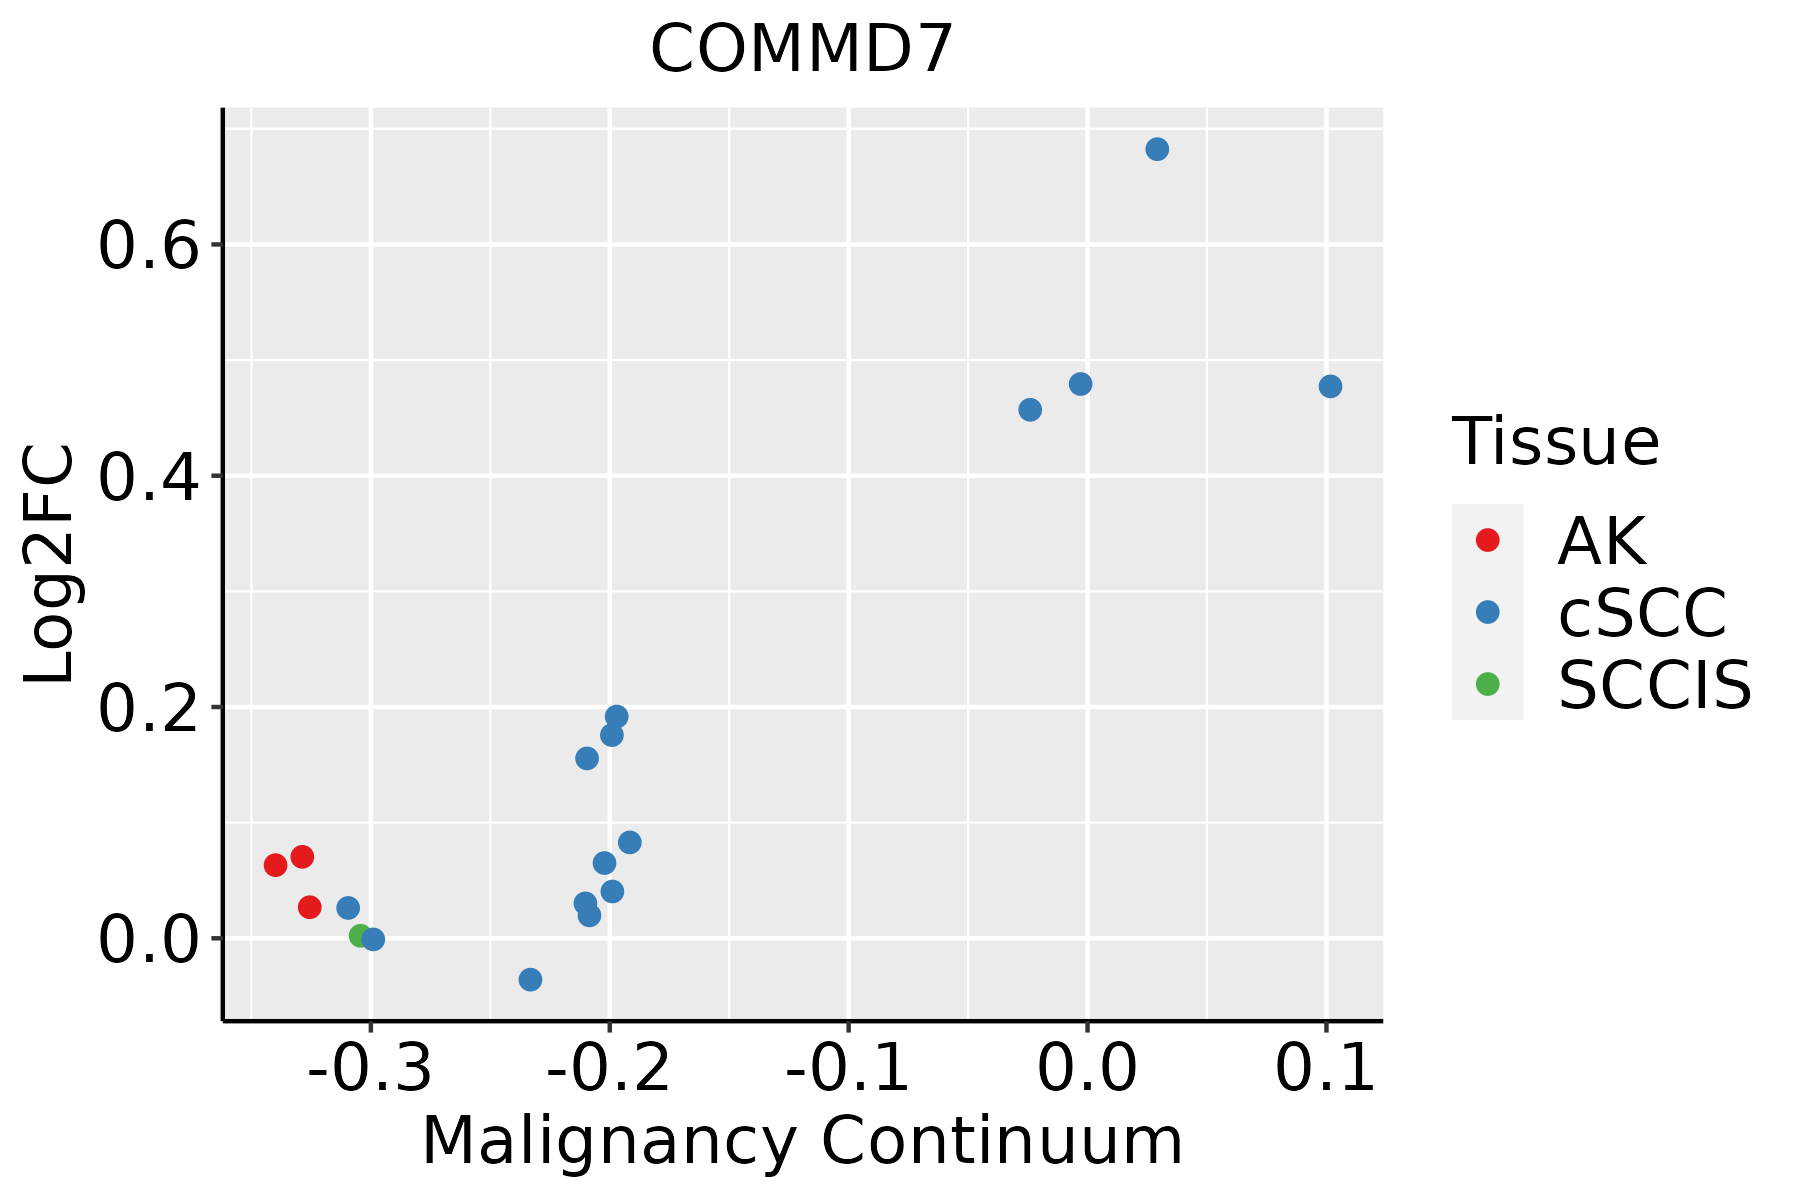 | AK: Actinic keratosis |
| cSCC: Cutaneous squamous cell carcinoma | ||
| SCCIS:squamous cell carcinoma in situ | ||
| Thyroid |  | ATC: Anaplastic thyroid cancer |
| HT: Hashimoto's thyroiditis | ||
| PTC: Papillary thyroid cancer |
| ∗log2FC in expression of this searched gene in stem-like cells from each diseased tissue sample relative to stem-like cells in normal samples in each tissue plotted against the malignancy continuum. Samples are colored based on if they are from different disease stage. |
Top |
Malignant transformation related pathway analysis |
| Find out the enriched GO biological processes and KEGG pathways involved in transition from healthy to precancer to cancer |
| Tissue | Disease Stage | Enriched GO biological Processes |
| Colorectum | AD |  |
| Colorectum | SER |  |
| Colorectum | MSS |  |
| Colorectum | MSI-H |  |
| Colorectum | FAP |  |
| ∗Top 15 enriched GO BP terms are showed in the bar plot of each disease state in each tissue. Each row represents a significant GO biological process which is colored according to the -log10(p.adjust). |
| Page: 1 2 3 4 5 6 7 8 9 |
| GO ID | Tissue | Disease Stage | Description | Gene Ratio | Bg Ratio | pvalue | p.adjust | Count |
| GO:0051090 | Colorectum | MSS | regulation of DNA-binding transcription factor activity | 106/3467 | 440/18723 | 1.88e-03 | 1.65e-02 | 106 |
| GO:00510908 | Esophagus | ESCC | regulation of DNA-binding transcription factor activity | 252/8552 | 440/18723 | 5.22e-07 | 6.97e-06 | 252 |
| GO:003320914 | Esophagus | ESCC | tumor necrosis factor-mediated signaling pathway | 67/8552 | 99/18723 | 7.87e-06 | 7.72e-05 | 67 |
| GO:003461220 | Esophagus | ESCC | response to tumor necrosis factor | 149/8552 | 253/18723 | 1.47e-05 | 1.33e-04 | 149 |
| GO:007135620 | Esophagus | ESCC | cellular response to tumor necrosis factor | 132/8552 | 229/18723 | 1.69e-04 | 1.11e-03 | 132 |
| GO:00434332 | Esophagus | ESCC | negative regulation of DNA-binding transcription factor activity | 103/8552 | 185/18723 | 3.86e-03 | 1.57e-02 | 103 |
| GO:00320882 | Esophagus | ESCC | negative regulation of NF-kappaB transcription factor activity | 54/8552 | 93/18723 | 1.08e-02 | 3.67e-02 | 54 |
| GO:003461218 | Oral cavity | OSCC | response to tumor necrosis factor | 143/7305 | 253/18723 | 1.09e-08 | 2.23e-07 | 143 |
| GO:007135618 | Oral cavity | OSCC | cellular response to tumor necrosis factor | 128/7305 | 229/18723 | 1.49e-07 | 2.49e-06 | 128 |
| GO:00510907 | Oral cavity | OSCC | regulation of DNA-binding transcription factor activity | 221/7305 | 440/18723 | 9.06e-07 | 1.23e-05 | 221 |
| GO:00332099 | Oral cavity | OSCC | tumor necrosis factor-mediated signaling pathway | 61/7305 | 99/18723 | 4.31e-06 | 4.98e-05 | 61 |
| GO:00192214 | Oral cavity | OSCC | cytokine-mediated signaling pathway | 222/7305 | 472/18723 | 2.02e-04 | 1.35e-03 | 222 |
| GO:0032088 | Oral cavity | OSCC | negative regulation of NF-kappaB transcription factor activity | 47/7305 | 93/18723 | 1.55e-02 | 4.99e-02 | 47 |
| GO:005109015 | Oral cavity | LP | regulation of DNA-binding transcription factor activity | 147/4623 | 440/18723 | 2.00e-05 | 3.35e-04 | 147 |
| GO:003320913 | Oral cavity | LP | tumor necrosis factor-mediated signaling pathway | 38/4623 | 99/18723 | 1.72e-03 | 1.31e-02 | 38 |
| GO:003461219 | Oral cavity | LP | response to tumor necrosis factor | 83/4623 | 253/18723 | 2.10e-03 | 1.54e-02 | 83 |
| GO:007135619 | Oral cavity | LP | cellular response to tumor necrosis factor | 76/4623 | 229/18723 | 2.24e-03 | 1.62e-02 | 76 |
| GO:0043433 | Oral cavity | LP | negative regulation of DNA-binding transcription factor activity | 61/4623 | 185/18723 | 6.68e-03 | 3.89e-02 | 61 |
| GO:003461216 | Prostate | BPH | response to tumor necrosis factor | 68/3107 | 253/18723 | 2.22e-05 | 2.67e-04 | 68 |
| GO:007135616 | Prostate | BPH | cellular response to tumor necrosis factor | 60/3107 | 229/18723 | 1.42e-04 | 1.26e-03 | 60 |
| Page: 1 2 |
| Pathway ID | Tissue | Disease Stage | Description | Gene Ratio | Bg Ratio | pvalue | p.adjust | qvalue | Count |
| Page: 1 |
Top |
Cell-cell communication analysis |
| Identification of potential cell-cell interactions between two cell types and their ligand-receptor pairs for different disease states |
| Ligand | Receptor | LRpair | Pathway | Tissue | Disease Stage |
| Page: 1 |
Top |
Single-cell gene regulatory network inference analysis |
| Find out the significant the regulons (TFs) and the target genes of each regulon across cell types for different disease states |
| TF | Cell Type | Tissue | Disease Stage | Target Gene | RSS | Regulon Activity |
| ∗The dot plots of a searched regulon are shown for all cell subpopulations in each disease state of each tissue based on the regulon specific score inferred using pySCENIC and by calculating the average expression. |
| Page: 1 |
Top |
Somatic mutation of malignant transformation related genes |
| Annotation of somatic variants for genes involved in malignant transformation |
| Hugo Symbol | Variant Class | Variant Classification | dbSNP RS | HGVSc | HGVSp | HGVSp Short | SWISSPROT | BIOTYPE | SIFT | PolyPhen | Tumor Sample Barcode | Tissue | Histology | Sex | Age | Stage | Therapy Types | Drugs | Outcome |
| COMMD7 | SNV | Missense_Mutation | c.317N>T | p.Ala106Val | p.A106V | Q86VX2 | protein_coding | tolerated(0.06) | probably_damaging(0.989) | TCGA-D8-A1JF-01 | Breast | breast invasive carcinoma | Female | >=65 | III/IV | Unknown | Unknown | SD | |
| COMMD7 | SNV | Missense_Mutation | rs755648030 | c.209G>A | p.Ser70Asn | p.S70N | Q86VX2 | protein_coding | tolerated(1) | benign(0.003) | TCGA-E9-A1RC-01 | Breast | breast invasive carcinoma | Female | <65 | III/IV | Hormone Therapy | tamoxiphen | SD |
| COMMD7 | SNV | Missense_Mutation | c.295N>G | p.Leu99Val | p.L99V | Q86VX2 | protein_coding | deleterious(0) | probably_damaging(0.961) | TCGA-EK-A2R8-01 | Cervix | cervical & endocervical cancer | Female | <65 | I/II | Unknown | Unknown | SD | |
| COMMD7 | SNV | Missense_Mutation | rs781670155 | c.511N>A | p.Glu171Lys | p.E171K | Q86VX2 | protein_coding | deleterious(0.04) | possibly_damaging(0.81) | TCGA-CA-6717-01 | Colorectum | colon adenocarcinoma | Male | <65 | I/II | Chemotherapy | oxaliplatin | CR |
| COMMD7 | SNV | Missense_Mutation | c.523A>G | p.Ile175Val | p.I175V | Q86VX2 | protein_coding | tolerated(0.23) | benign(0) | TCGA-CM-5861-01 | Colorectum | colon adenocarcinoma | Female | <65 | I/II | Unknown | Unknown | PD | |
| COMMD7 | SNV | Missense_Mutation | c.312N>T | p.Glu104Asp | p.E104D | Q86VX2 | protein_coding | tolerated(0.18) | benign(0.017) | TCGA-AP-A056-01 | Endometrium | uterine corpus endometrioid carcinoma | Female | <65 | I/II | Unknown | Unknown | SD | |
| COMMD7 | SNV | Missense_Mutation | novel | c.279N>T | p.Gln93His | p.Q93H | Q86VX2 | protein_coding | tolerated(0.1) | benign(0.183) | TCGA-AX-A06F-01 | Endometrium | uterine corpus endometrioid carcinoma | Female | <65 | III/IV | Chemotherapy | carboplatin | SD |
| COMMD7 | SNV | Missense_Mutation | c.149N>G | p.Phe50Cys | p.F50C | Q86VX2 | protein_coding | deleterious(0) | probably_damaging(0.971) | TCGA-AX-A0J0-01 | Endometrium | uterine corpus endometrioid carcinoma | Female | <65 | I/II | Unknown | Unknown | SD | |
| COMMD7 | SNV | Missense_Mutation | c.213N>G | p.Ile71Met | p.I71M | Q86VX2 | protein_coding | tolerated(0.09) | benign(0.142) | TCGA-B5-A0JN-01 | Endometrium | uterine corpus endometrioid carcinoma | Female | >=65 | III/IV | Chemotherapy | paclitaxel | SD | |
| COMMD7 | SNV | Missense_Mutation | novel | c.572N>A | p.Arg191Gln | p.R191Q | Q86VX2 | protein_coding | deleterious(0.02) | benign(0.137) | TCGA-BK-A56F-01 | Endometrium | uterine corpus endometrioid carcinoma | Female | >=65 | I/II | Unknown | Unknown | SD |
| Page: 1 2 |
Top |
Related drugs of malignant transformation related genes |
| Identification of chemicals and drugs interact with genes involved in malignant transfromation |
| (DGIdb 4.0) |
| Entrez ID | Symbol | Category | Interaction Types | Drug Claim Name | Drug Name | PMIDs |
| Page: 1 |

Copyright 2023-Present -The University of Texas Health Science Center at Houston |