| Tissue | Expression Dynamics | Abbreviation |
| Breast | 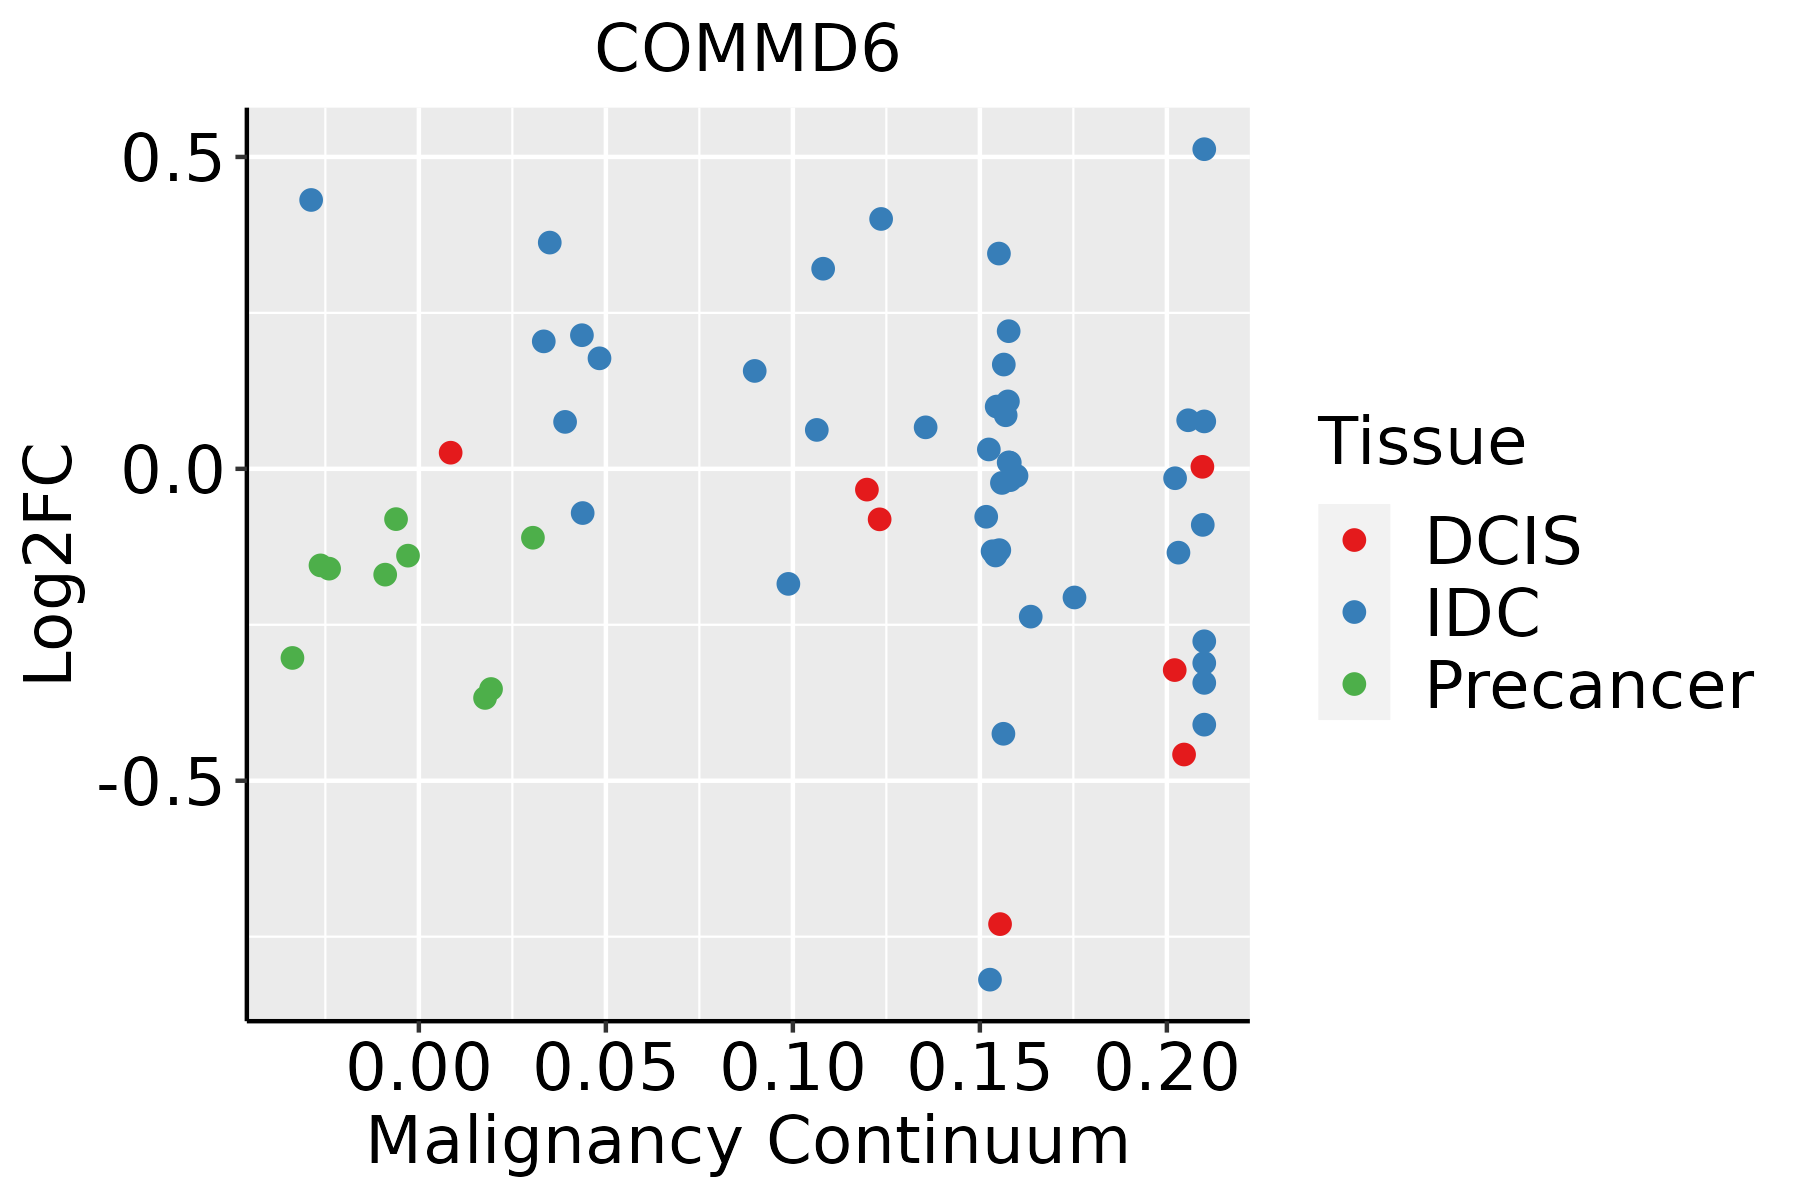 | IDC: Invasive ductal carcinoma |
| DCIS: Ductal carcinoma in situ |
| Precancer(BRCA1-mut): Precancerous lesion from BRCA1 mutation carriers |
| Cervix | 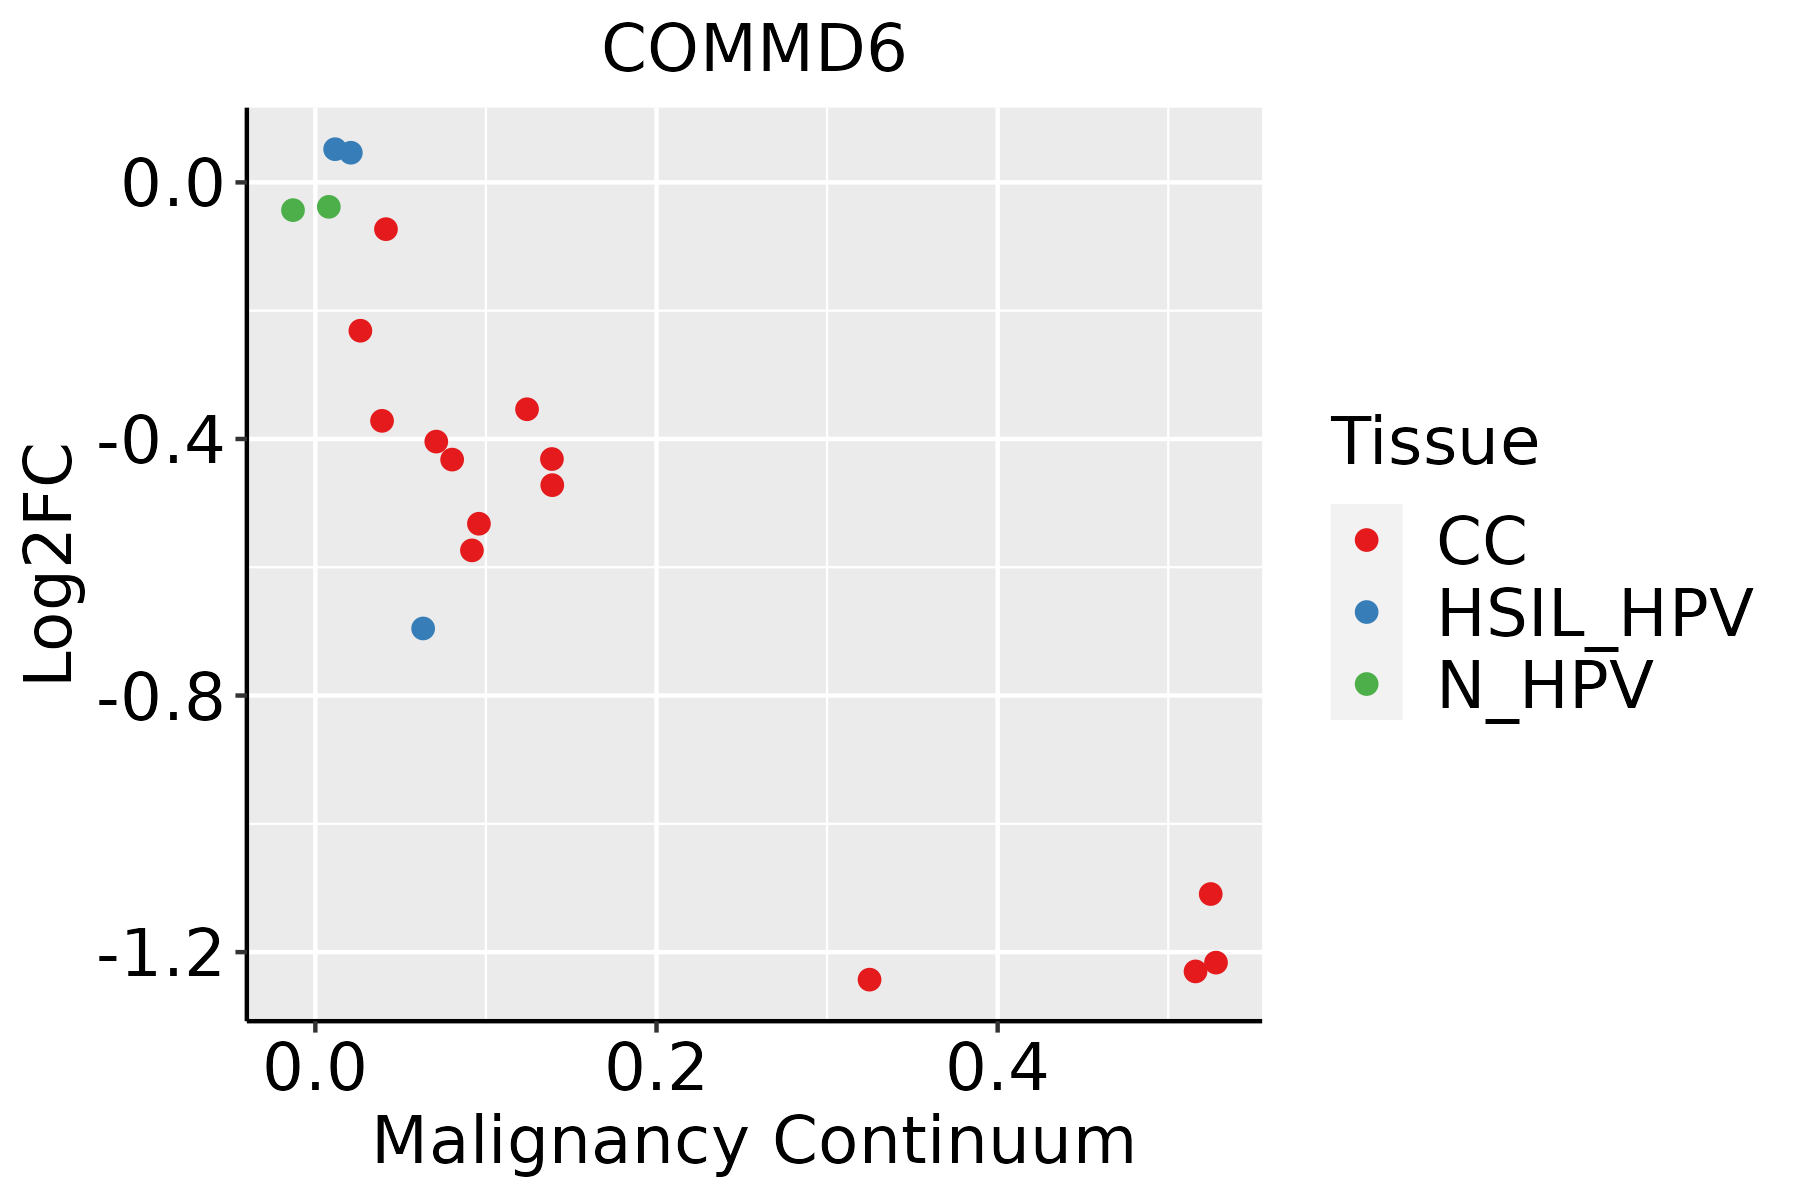 | CC: Cervix cancer |
| HSIL_HPV: HPV-infected high-grade squamous intraepithelial lesions |
| N_HPV: HPV-infected normal cervix |
| Colorectum (GSE201348) |  | FAP: Familial adenomatous polyposis |
| CRC: Colorectal cancer |
| Colorectum (HTA11) |  | AD: Adenomas |
| SER: Sessile serrated lesions |
| MSI-H: Microsatellite-high colorectal cancer |
| MSS: Microsatellite stable colorectal cancer |
| Endometrium |  | AEH: Atypical endometrial hyperplasia |
| EEC: Endometrioid Cancer |
| Esophagus | 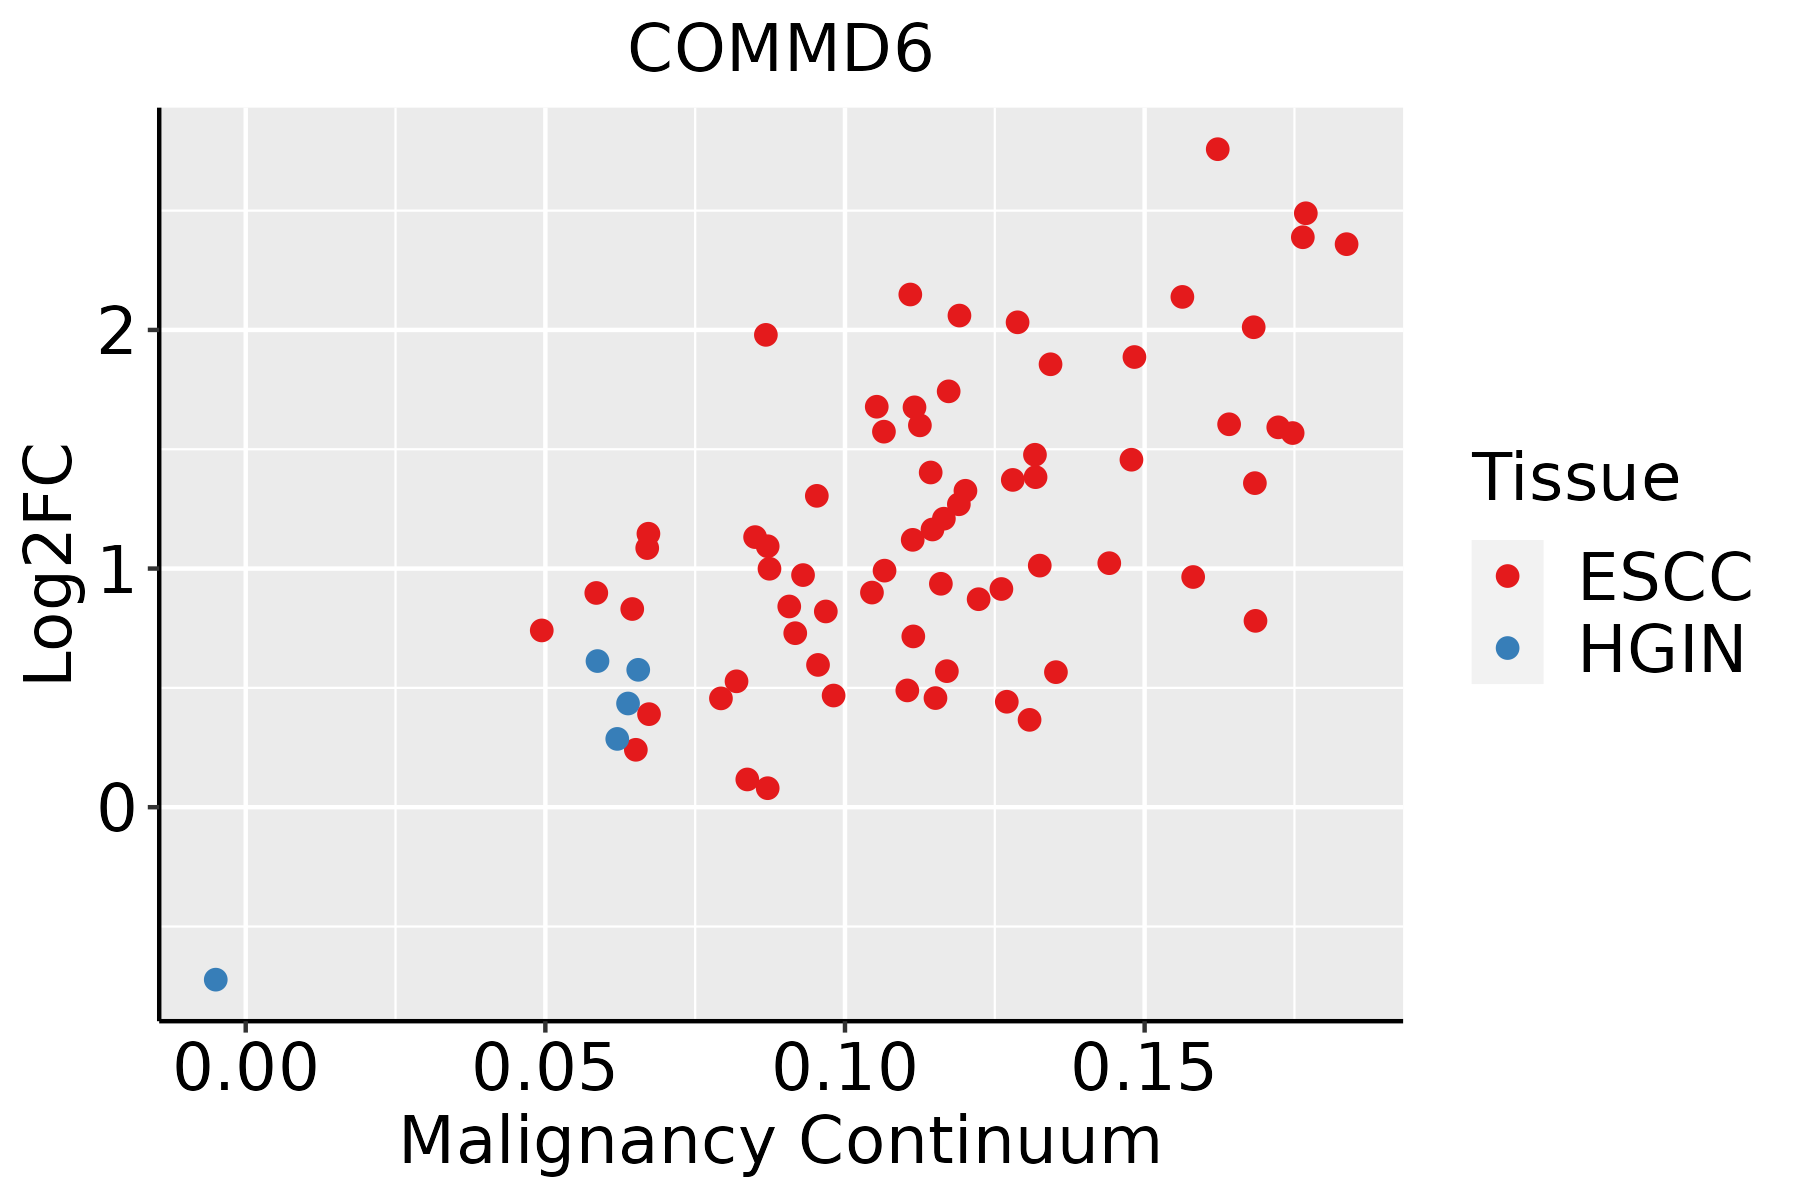 | ESCC: Esophageal squamous cell carcinoma |
| HGIN: High-grade intraepithelial neoplasias |
| LGIN: Low-grade intraepithelial neoplasias |
| Liver | 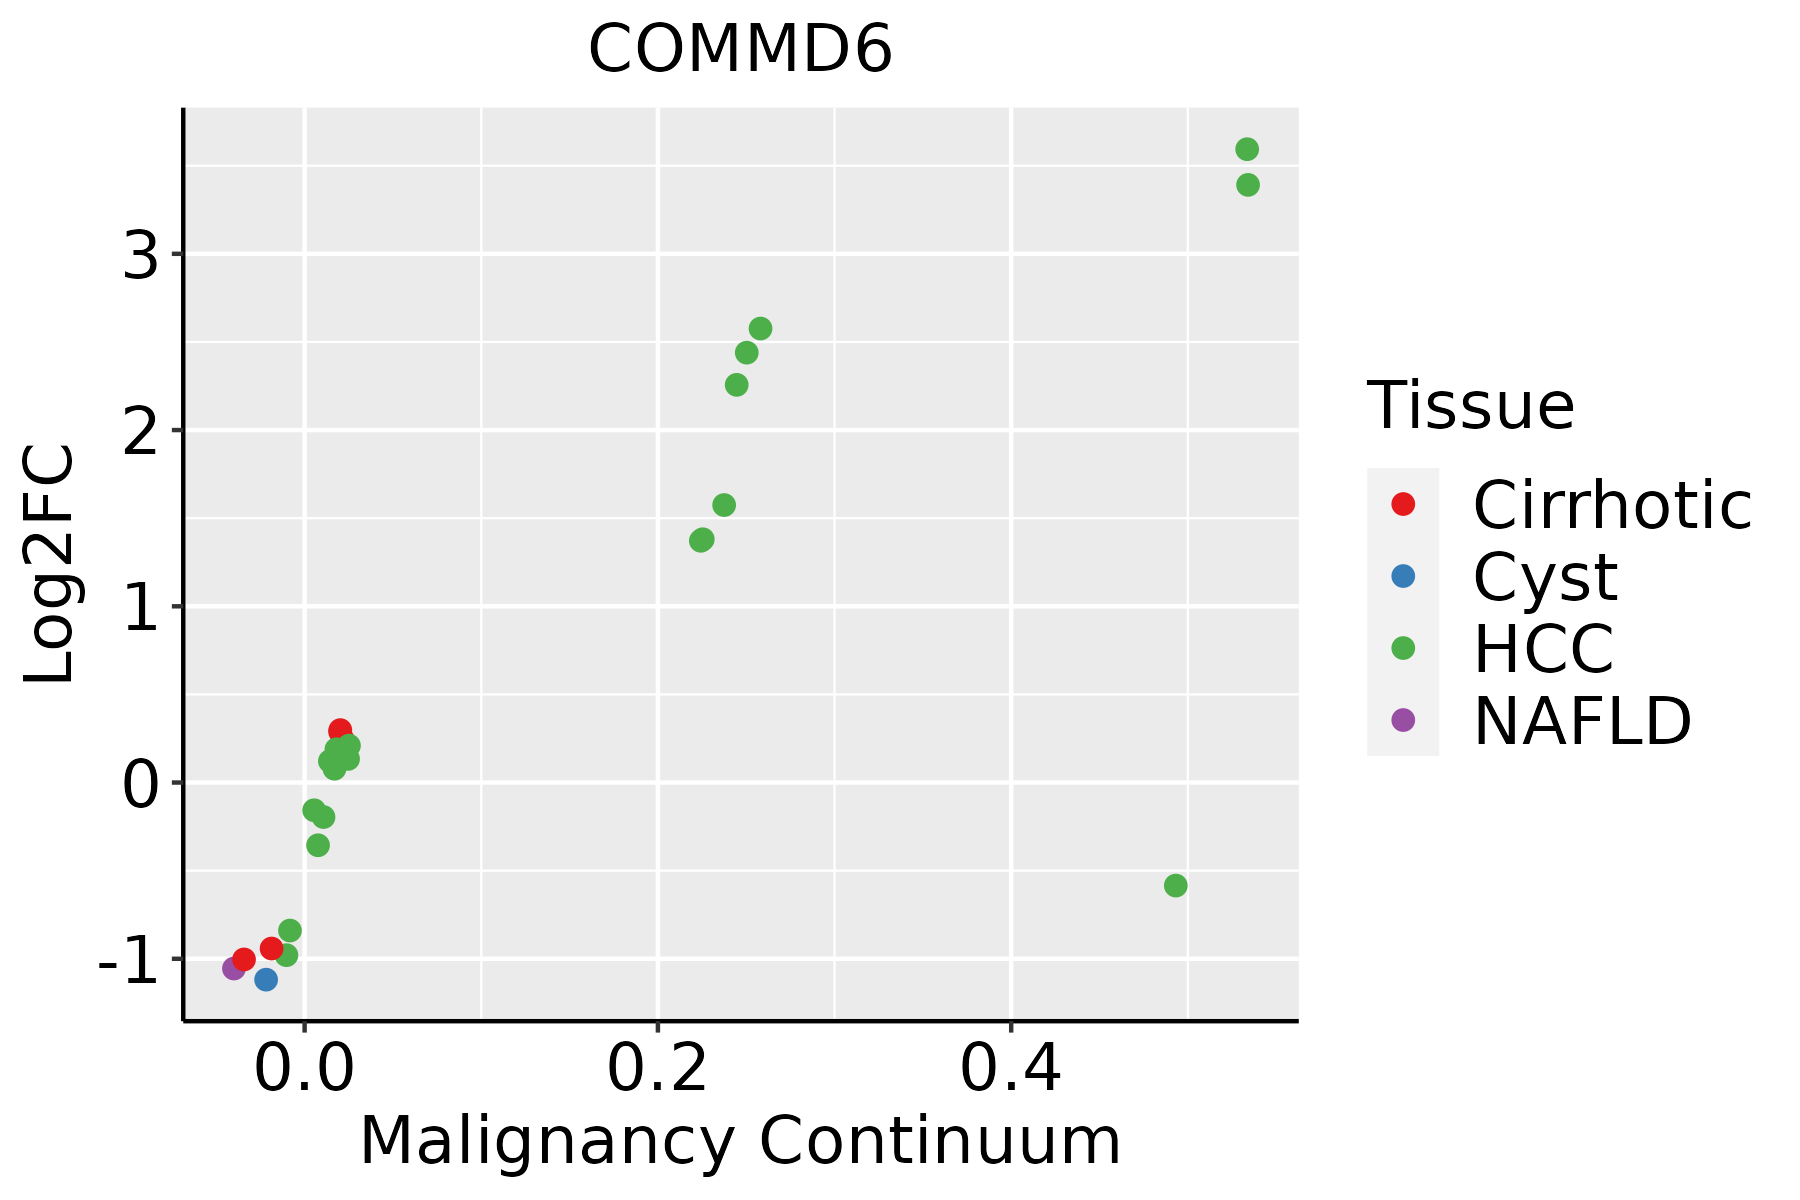 | HCC: Hepatocellular carcinoma |
| NAFLD: Non-alcoholic fatty liver disease |
| Lung | 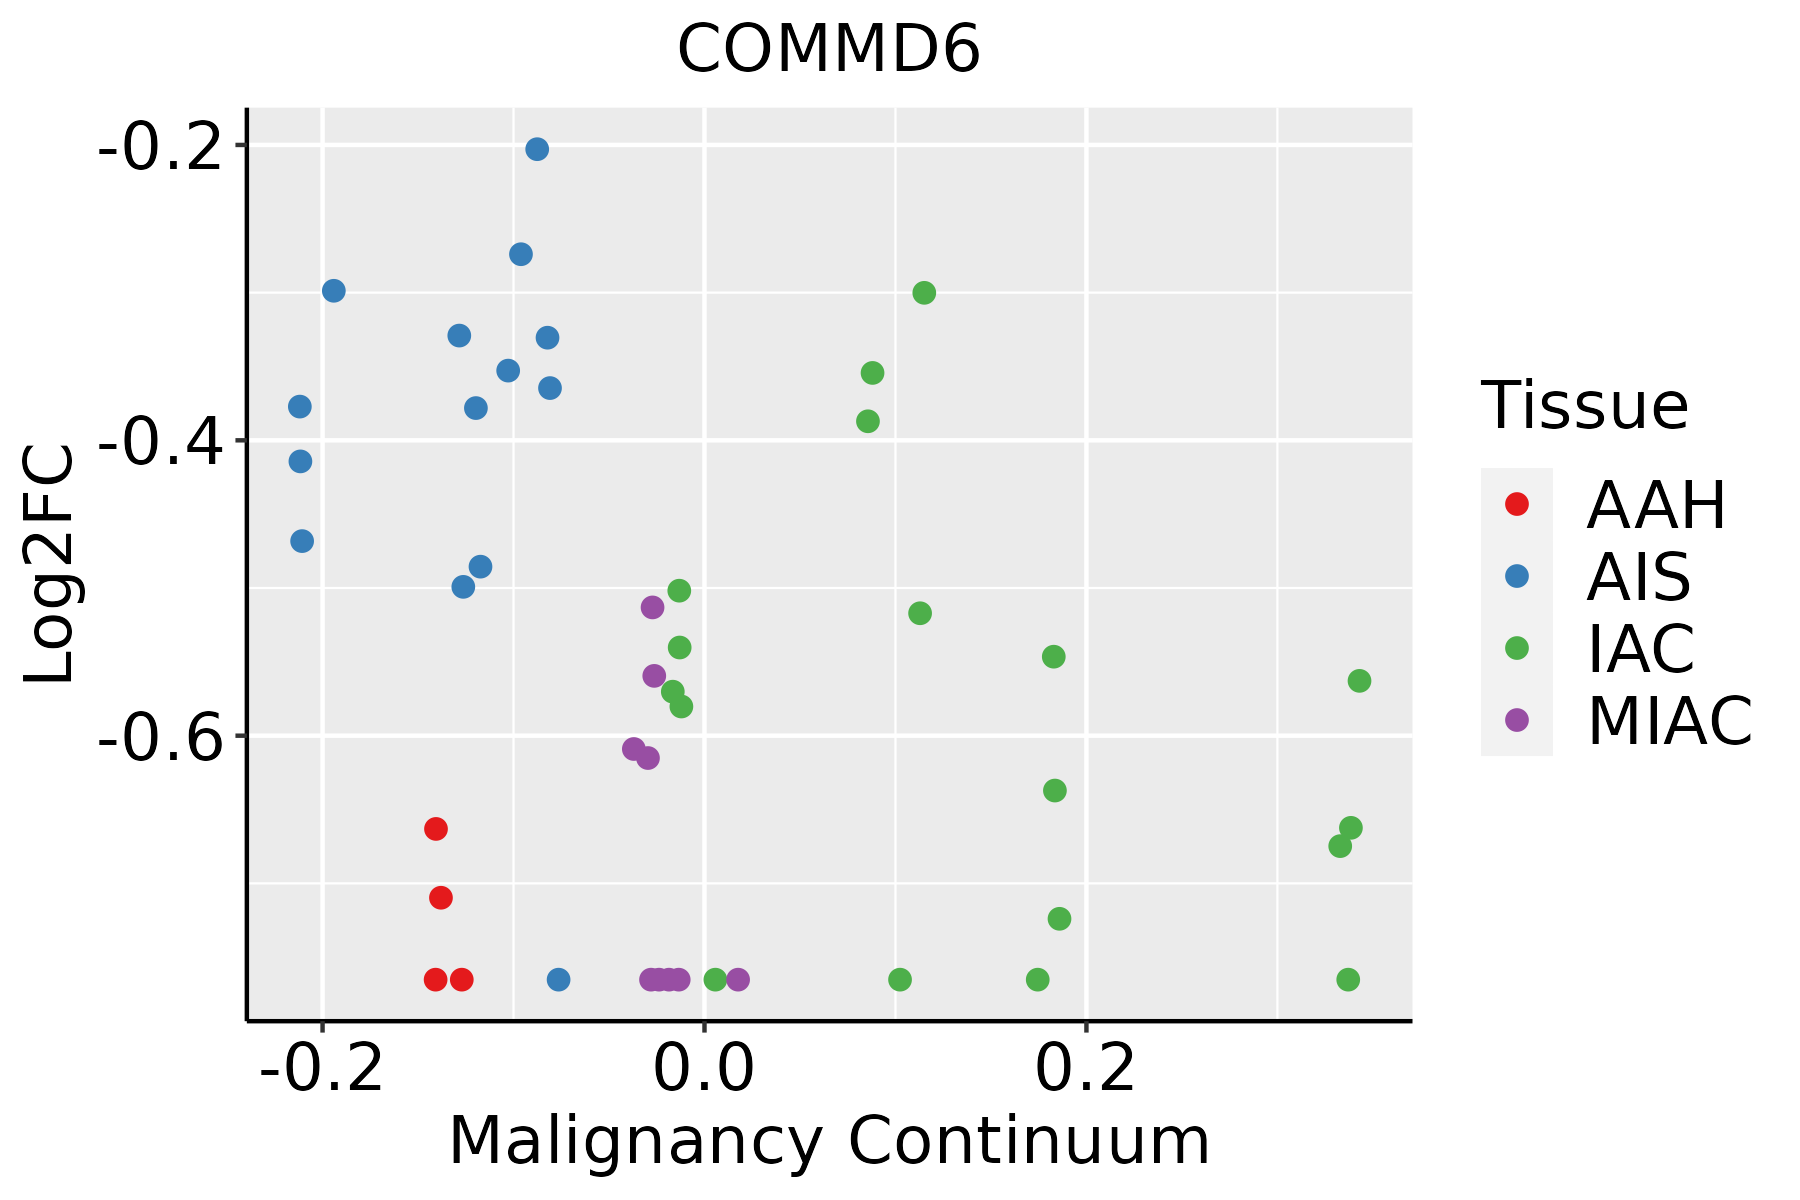 | AAH: Atypical adenomatous hyperplasia |
| AIS: Adenocarcinoma in situ |
| IAC: Invasive lung adenocarcinoma |
| MIA: Minimally invasive adenocarcinoma |
| Oral Cavity | 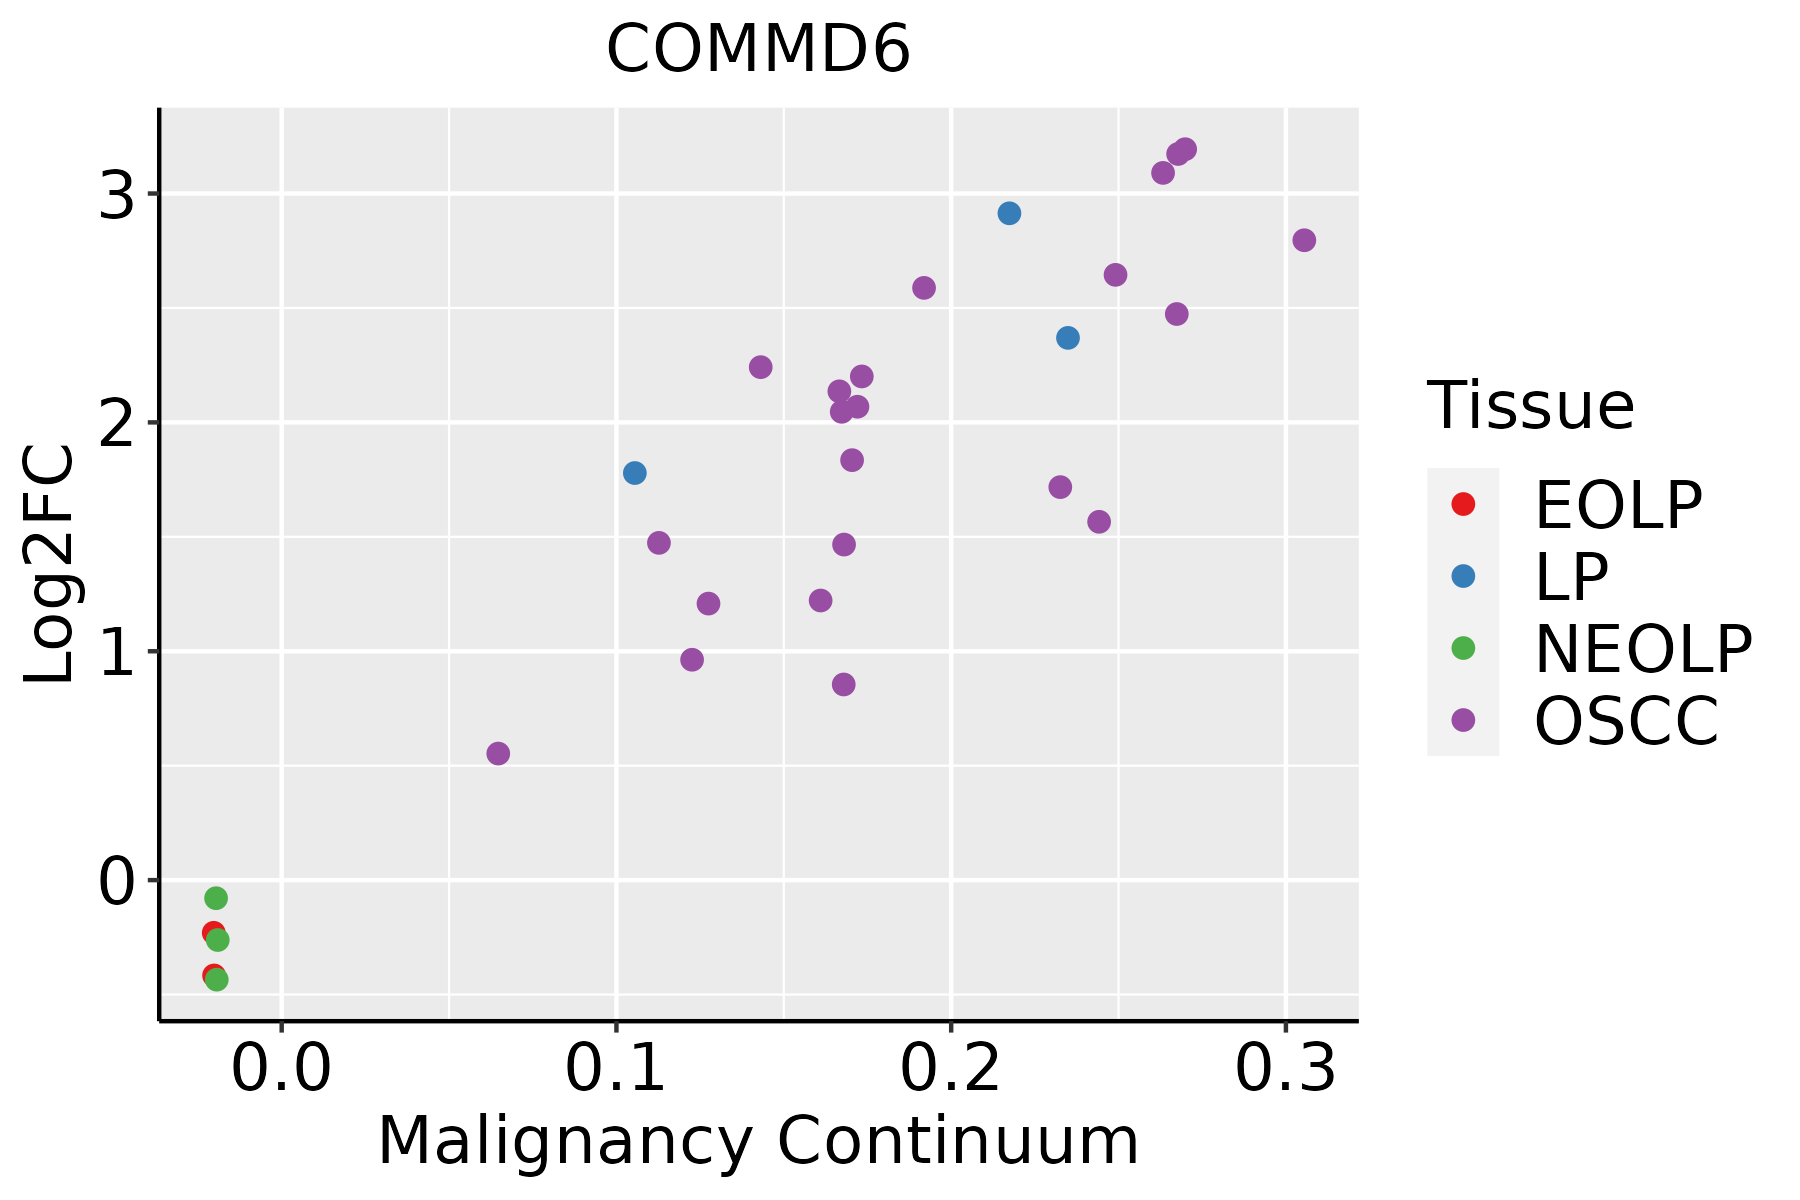 | EOLP: Erosive Oral lichen planus |
| LP: leukoplakia |
| NEOLP: Non-erosive oral lichen planus |
| OSCC: Oral squamous cell carcinoma |
| Prostate |  | BPH: Benign Prostatic Hyperplasia |
| Skin | 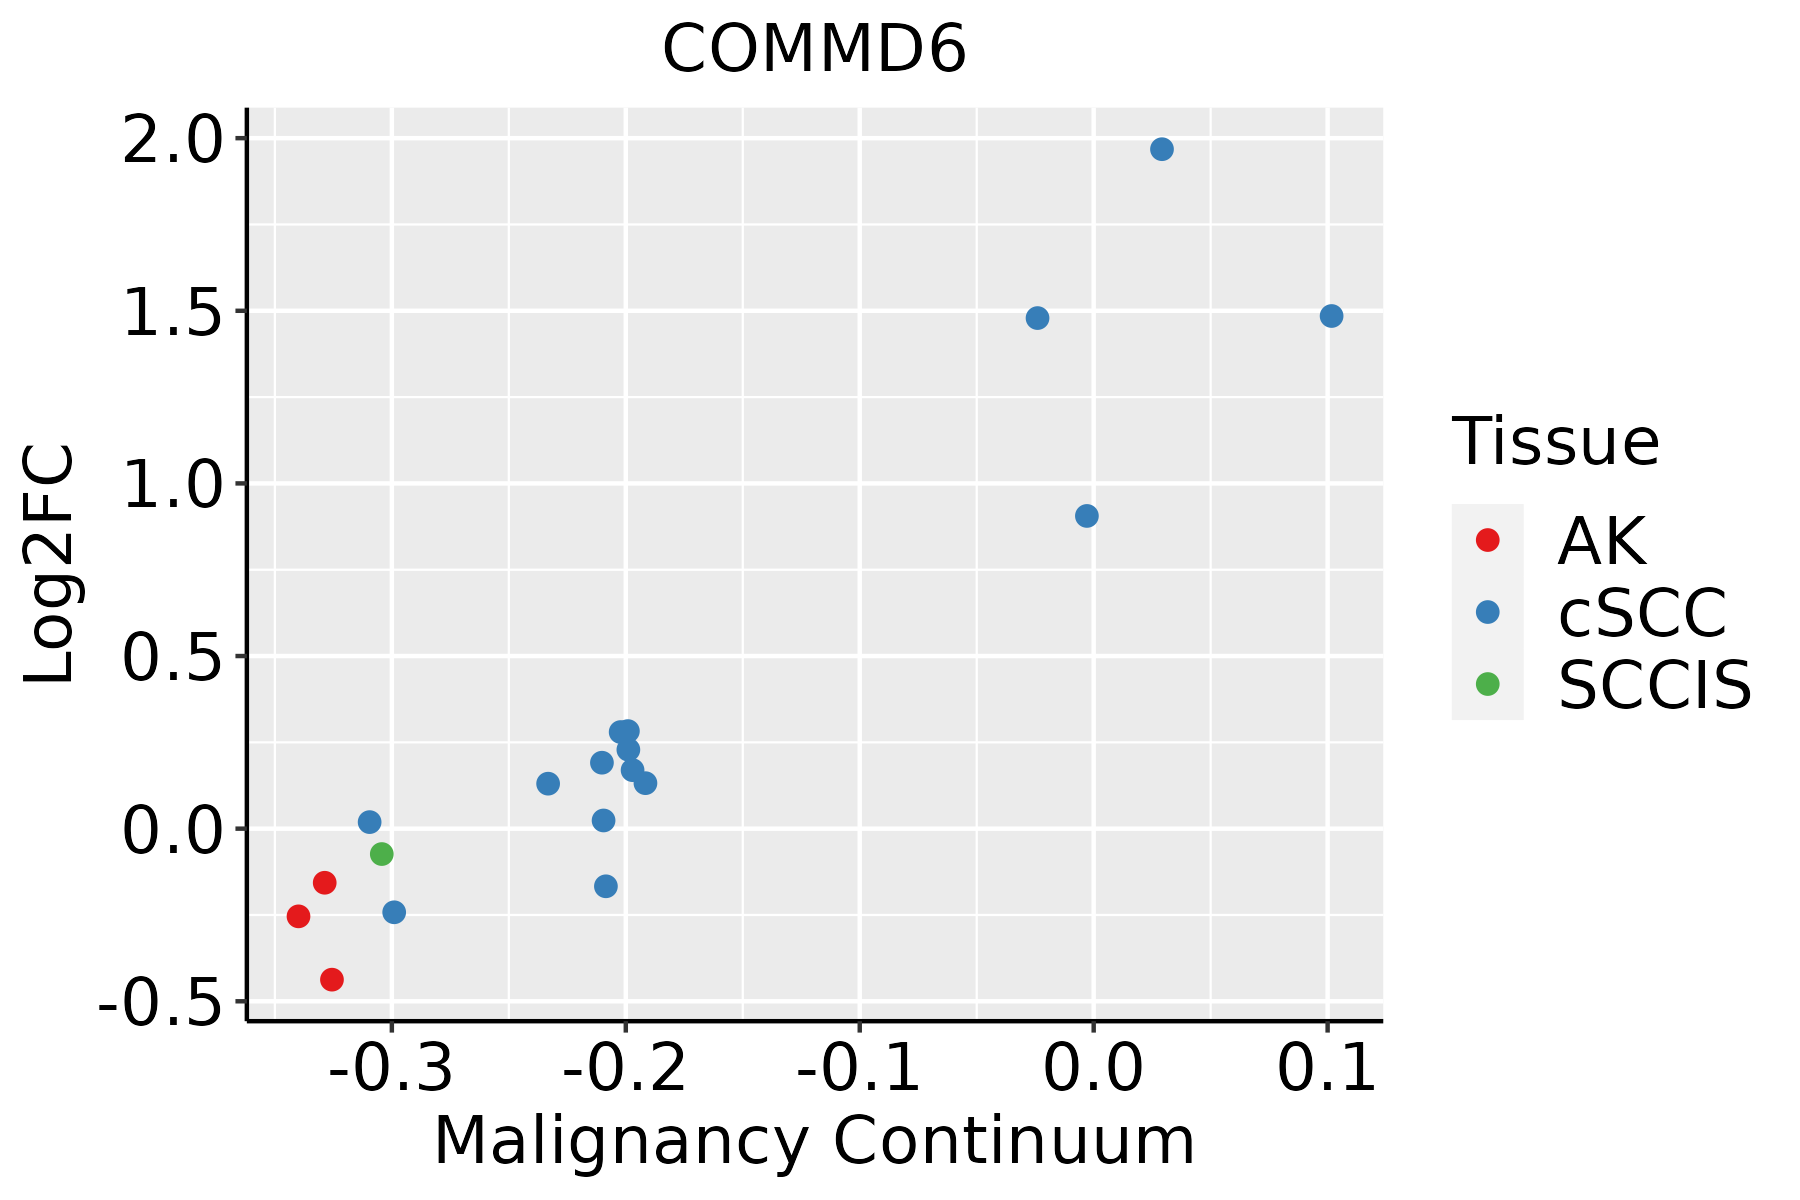 | AK: Actinic keratosis |
| cSCC: Cutaneous squamous cell carcinoma |
| SCCIS:squamous cell carcinoma in situ |
| Thyroid |  | ATC: Anaplastic thyroid cancer |
| HT: Hashimoto's thyroiditis |
| PTC: Papillary thyroid cancer |
| GO ID | Tissue | Disease Stage | Description | Gene Ratio | Bg Ratio | pvalue | p.adjust | Count |
| GO:00510904 | Cervix | CC | regulation of DNA-binding transcription factor activity | 87/2311 | 440/18723 | 4.85e-06 | 1.22e-04 | 87 |
| GO:005109012 | Cervix | HSIL_HPV | regulation of DNA-binding transcription factor activity | 35/737 | 440/18723 | 6.77e-05 | 1.58e-03 | 35 |
| GO:0051090 | Colorectum | MSS | regulation of DNA-binding transcription factor activity | 106/3467 | 440/18723 | 1.88e-03 | 1.65e-02 | 106 |
| GO:00510905 | Endometrium | AEH | regulation of DNA-binding transcription factor activity | 69/2100 | 440/18723 | 2.51e-03 | 1.87e-02 | 69 |
| GO:005109013 | Endometrium | EEC | regulation of DNA-binding transcription factor activity | 75/2168 | 440/18723 | 3.71e-04 | 3.97e-03 | 75 |
| GO:00510908 | Esophagus | ESCC | regulation of DNA-binding transcription factor activity | 252/8552 | 440/18723 | 5.22e-07 | 6.97e-06 | 252 |
| GO:00434332 | Esophagus | ESCC | negative regulation of DNA-binding transcription factor activity | 103/8552 | 185/18723 | 3.86e-03 | 1.57e-02 | 103 |
| GO:00320882 | Esophagus | ESCC | negative regulation of NF-kappaB transcription factor activity | 54/8552 | 93/18723 | 1.08e-02 | 3.67e-02 | 54 |
| GO:00510902 | Liver | HCC | regulation of DNA-binding transcription factor activity | 220/7958 | 440/18723 | 8.04e-04 | 4.82e-03 | 220 |
| GO:00510903 | Lung | IAC | regulation of DNA-binding transcription factor activity | 76/2061 | 440/18723 | 4.44e-05 | 1.05e-03 | 76 |
| GO:005109011 | Lung | AIS | regulation of DNA-binding transcription factor activity | 64/1849 | 440/18723 | 1.04e-03 | 1.36e-02 | 64 |
| GO:00510907 | Oral cavity | OSCC | regulation of DNA-binding transcription factor activity | 221/7305 | 440/18723 | 9.06e-07 | 1.23e-05 | 221 |
| GO:0032088 | Oral cavity | OSCC | negative regulation of NF-kappaB transcription factor activity | 47/7305 | 93/18723 | 1.55e-02 | 4.99e-02 | 47 |
| GO:005109015 | Oral cavity | LP | regulation of DNA-binding transcription factor activity | 147/4623 | 440/18723 | 2.00e-05 | 3.35e-04 | 147 |
| GO:0043433 | Oral cavity | LP | negative regulation of DNA-binding transcription factor activity | 61/4623 | 185/18723 | 6.68e-03 | 3.89e-02 | 61 |
| GO:005109021 | Oral cavity | EOLP | regulation of DNA-binding transcription factor activity | 80/2218 | 440/18723 | 5.77e-05 | 7.31e-04 | 80 |
| GO:00320881 | Oral cavity | EOLP | negative regulation of NF-kappaB transcription factor activity | 22/2218 | 93/18723 | 1.05e-03 | 7.77e-03 | 22 |
| GO:00434331 | Oral cavity | EOLP | negative regulation of DNA-binding transcription factor activity | 36/2218 | 185/18723 | 1.79e-03 | 1.17e-02 | 36 |
| GO:005109031 | Oral cavity | NEOLP | regulation of DNA-binding transcription factor activity | 72/2005 | 440/18723 | 1.66e-04 | 1.84e-03 | 72 |
| GO:00510906 | Prostate | BPH | regulation of DNA-binding transcription factor activity | 100/3107 | 440/18723 | 4.71e-04 | 3.37e-03 | 100 |
| Hugo Symbol | Variant Class | Variant Classification | dbSNP RS | HGVSc | HGVSp | HGVSp Short | SWISSPROT | BIOTYPE | SIFT | PolyPhen | Tumor Sample Barcode | Tissue | Histology | Sex | Age | Stage | Therapy Types | Drugs | Outcome |
| COMMD6 | SNV | Missense_Mutation | rs372073245 | c.20N>T | p.Pro7Leu | p.P7L | Q7Z4G1 | protein_coding | tolerated_low_confidence(0.27) | benign(0.012) | TCGA-AO-A0J9-01 | Breast | breast invasive carcinoma | Female | <65 | III/IV | Chemotherapy | cyclophosphamide | PD |
| COMMD6 | SNV | Missense_Mutation | novel | c.185N>G | p.Glu62Gly | p.E62G | Q7Z4G1 | protein_coding | deleterious(0) | probably_damaging(0.997) | TCGA-AJ-A3EK-01 | Endometrium | uterine corpus endometrioid carcinoma | Female | <65 | I/II | Chemotherapy | carboplatin | CR |
| COMMD6 | SNV | Missense_Mutation | novel | c.290N>T | p.Thr97Met | p.T97M | Q7Z4G1 | protein_coding | deleterious(0) | probably_damaging(0.999) | TCGA-AP-A1DV-01 | Endometrium | uterine corpus endometrioid carcinoma | Female | <65 | I/II | Unknown | Unknown | SD |
| COMMD6 | SNV | Missense_Mutation | novel | c.280G>A | p.Val94Ile | p.V94I | Q7Z4G1 | protein_coding | tolerated(0.21) | benign(0.011) | TCGA-AX-A2H2-01 | Endometrium | uterine corpus endometrioid carcinoma | Female | >=65 | I/II | Unknown | Unknown | SD |
| COMMD6 | SNV | Missense_Mutation | novel | c.290N>T | p.Thr97Met | p.T97M | Q7Z4G1 | protein_coding | deleterious(0) | probably_damaging(0.999) | TCGA-D1-A16X-01 | Endometrium | uterine corpus endometrioid carcinoma | Female | <65 | I/II | Unknown | Unknown | SD |
| COMMD6 | SNV | Missense_Mutation | novel | c.196C>G | p.Pro66Ala | p.P66A | Q7Z4G1 | protein_coding | deleterious(0.02) | possibly_damaging(0.741) | TCGA-EY-A4KR-01 | Endometrium | uterine corpus endometrioid carcinoma | Female | <65 | III/IV | Chemotherapy | carboplatin | PD |
| COMMD6 | SNV | Missense_Mutation | rs372073245 | c.20C>A | p.Pro7Gln | p.P7Q | Q7Z4G1 | protein_coding | deleterious_low_confidence(0.03) | possibly_damaging(0.905) | TCGA-QS-A8F1-01 | Endometrium | uterine corpus endometrioid carcinoma | Female | >=65 | III/IV | Chemotherapy | carboplatin | PD |
| COMMD6 | SNV | Missense_Mutation | | c.97N>C | p.Asp33His | p.D33H | Q7Z4G1 | protein_coding | deleterious(0.01) | probably_damaging(0.988) | TCGA-55-A4DF-01 | Lung | lung adenocarcinoma | Male | >=65 | I/II | Unknown | Unknown | PD |
| COMMD6 | SNV | Missense_Mutation | | c.113N>G | p.Leu38Arg | p.L38R | Q7Z4G1 | protein_coding | deleterious(0) | probably_damaging(0.999) | TCGA-BR-8680-01 | Stomach | stomach adenocarcinoma | Male | <65 | III/IV | Chemotherapy | oxaliplatin | CR |


