
|
|||||
|
 | |
| |
| |
| |
| |
| |
|
Gene: COLGALT1 |
Gene summary for COLGALT1 |
| Gene information | Species | Human | Gene symbol | COLGALT1 | Gene ID | 79709 |
| Gene name | collagen beta(1-O)galactosyltransferase 1 | |
| Gene Alias | BSVD3 | |
| Cytomap | 19p13.11 | |
| Gene Type | protein-coding | GO ID | GO:0008150 | UniProtAcc | Q8NBJ5 |
Top |
Malignant transformation analysis |
| Identification of the aberrant gene expression in precancerous and cancerous lesions by comparing the gene expression of stem-like cells in diseased tissues with normal stem cells |
| Entrez ID | Symbol | Replicates | Species | Organ | Tissue | Adj P-value | Log2FC | Malignancy |
| 79709 | COLGALT1 | LZE2T | Human | Esophagus | ESCC | 3.30e-02 | 3.26e-01 | 0.082 |
| 79709 | COLGALT1 | LZE7T | Human | Esophagus | ESCC | 2.82e-09 | 3.26e-01 | 0.0667 |
| 79709 | COLGALT1 | LZE24T | Human | Esophagus | ESCC | 2.13e-06 | 1.90e-01 | 0.0596 |
| 79709 | COLGALT1 | LZE21T | Human | Esophagus | ESCC | 2.40e-02 | 3.80e-01 | 0.0655 |
| 79709 | COLGALT1 | P1T-E | Human | Esophagus | ESCC | 1.68e-06 | 4.21e-01 | 0.0875 |
| 79709 | COLGALT1 | P2T-E | Human | Esophagus | ESCC | 3.39e-17 | 2.69e-01 | 0.1177 |
| 79709 | COLGALT1 | P4T-E | Human | Esophagus | ESCC | 1.87e-15 | 3.81e-01 | 0.1323 |
| 79709 | COLGALT1 | P5T-E | Human | Esophagus | ESCC | 1.42e-11 | 1.81e-01 | 0.1327 |
| 79709 | COLGALT1 | P8T-E | Human | Esophagus | ESCC | 3.15e-16 | 2.61e-01 | 0.0889 |
| 79709 | COLGALT1 | P9T-E | Human | Esophagus | ESCC | 2.35e-13 | 2.25e-01 | 0.1131 |
| 79709 | COLGALT1 | P10T-E | Human | Esophagus | ESCC | 3.74e-19 | 3.35e-01 | 0.116 |
| 79709 | COLGALT1 | P11T-E | Human | Esophagus | ESCC | 7.13e-13 | 7.38e-01 | 0.1426 |
| 79709 | COLGALT1 | P12T-E | Human | Esophagus | ESCC | 1.95e-17 | 3.11e-01 | 0.1122 |
| 79709 | COLGALT1 | P15T-E | Human | Esophagus | ESCC | 1.07e-12 | 3.45e-01 | 0.1149 |
| 79709 | COLGALT1 | P16T-E | Human | Esophagus | ESCC | 7.87e-18 | 2.31e-01 | 0.1153 |
| 79709 | COLGALT1 | P17T-E | Human | Esophagus | ESCC | 7.83e-10 | 7.65e-01 | 0.1278 |
| 79709 | COLGALT1 | P19T-E | Human | Esophagus | ESCC | 2.11e-05 | 6.79e-01 | 0.1662 |
| 79709 | COLGALT1 | P20T-E | Human | Esophagus | ESCC | 5.98e-24 | 4.48e-01 | 0.1124 |
| 79709 | COLGALT1 | P21T-E | Human | Esophagus | ESCC | 5.77e-38 | 8.30e-01 | 0.1617 |
| 79709 | COLGALT1 | P22T-E | Human | Esophagus | ESCC | 8.68e-16 | 1.95e-01 | 0.1236 |
| Page: 1 2 3 4 5 6 |
| Tissue | Expression Dynamics | Abbreviation |
| Esophagus | 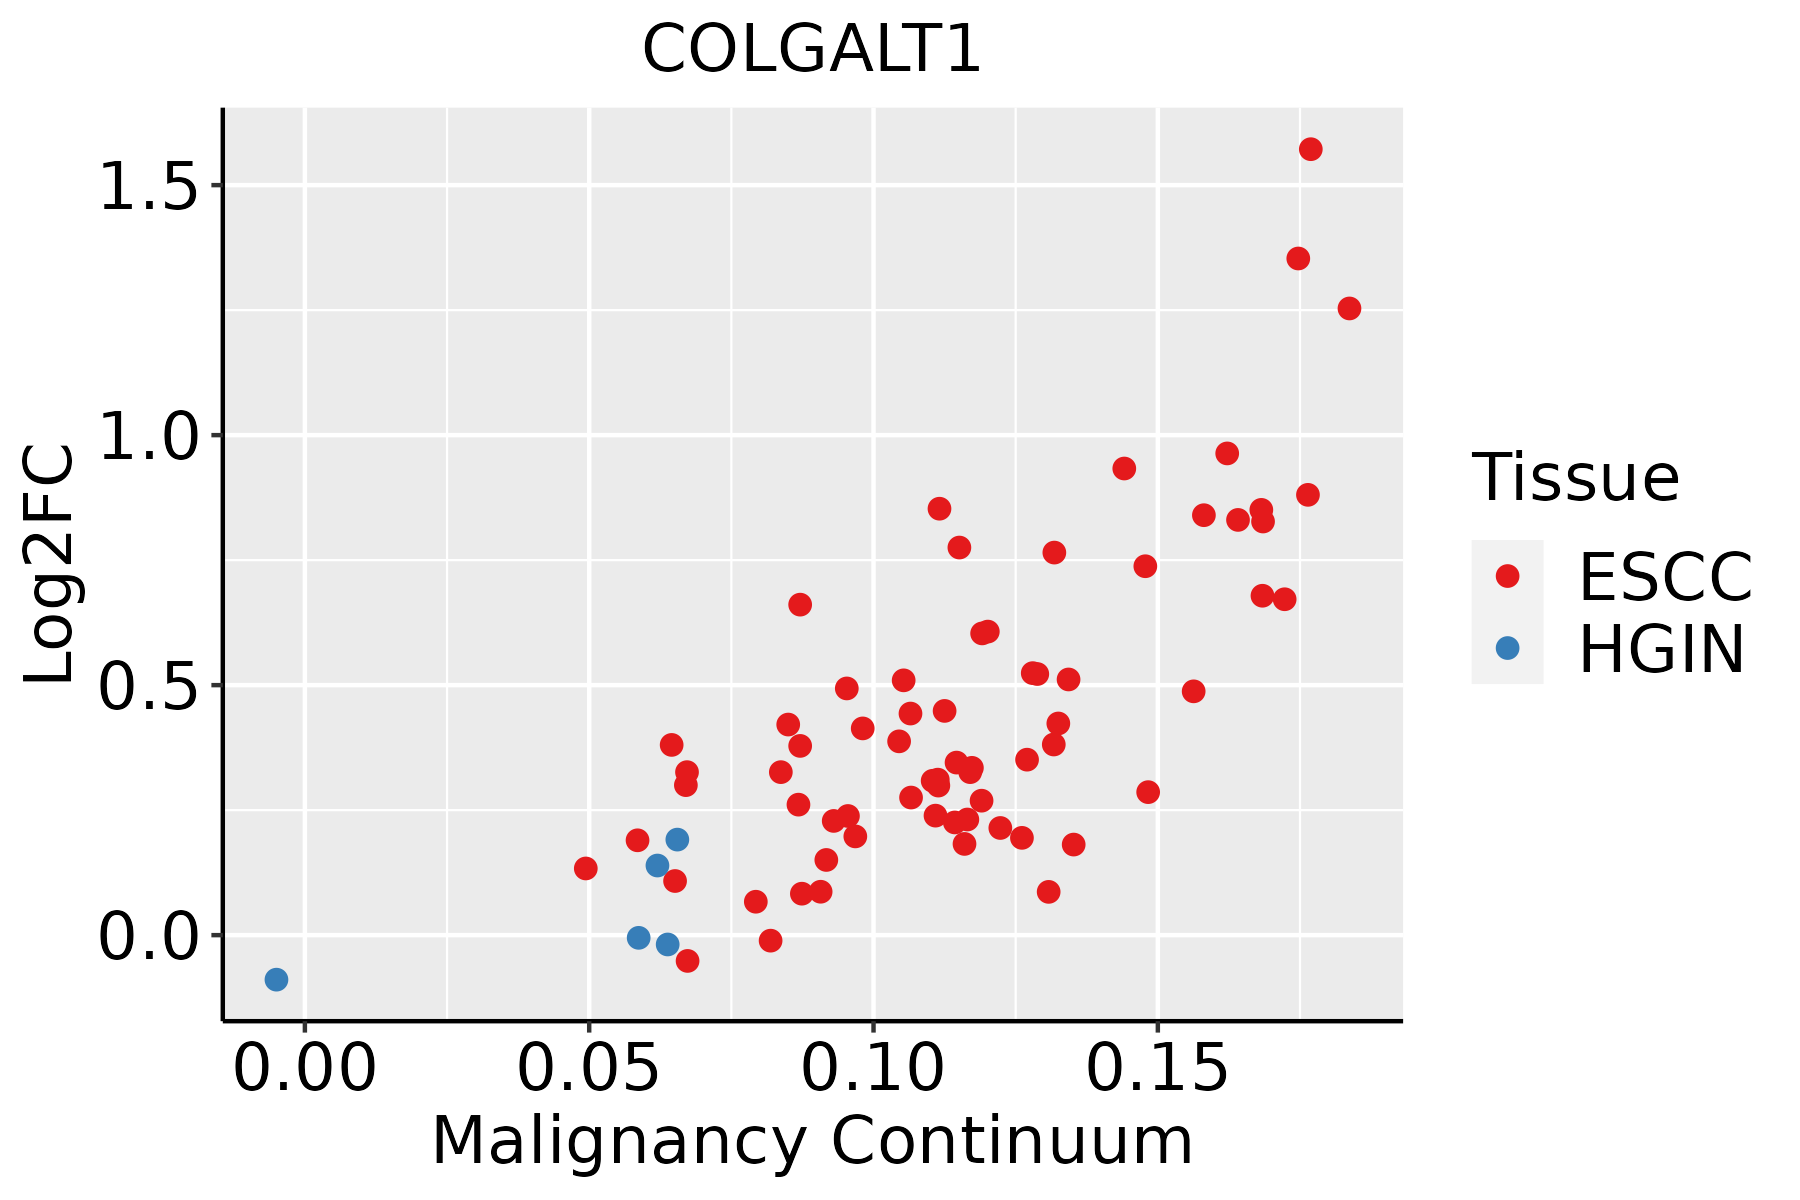 | ESCC: Esophageal squamous cell carcinoma |
| HGIN: High-grade intraepithelial neoplasias | ||
| LGIN: Low-grade intraepithelial neoplasias | ||
| Liver | 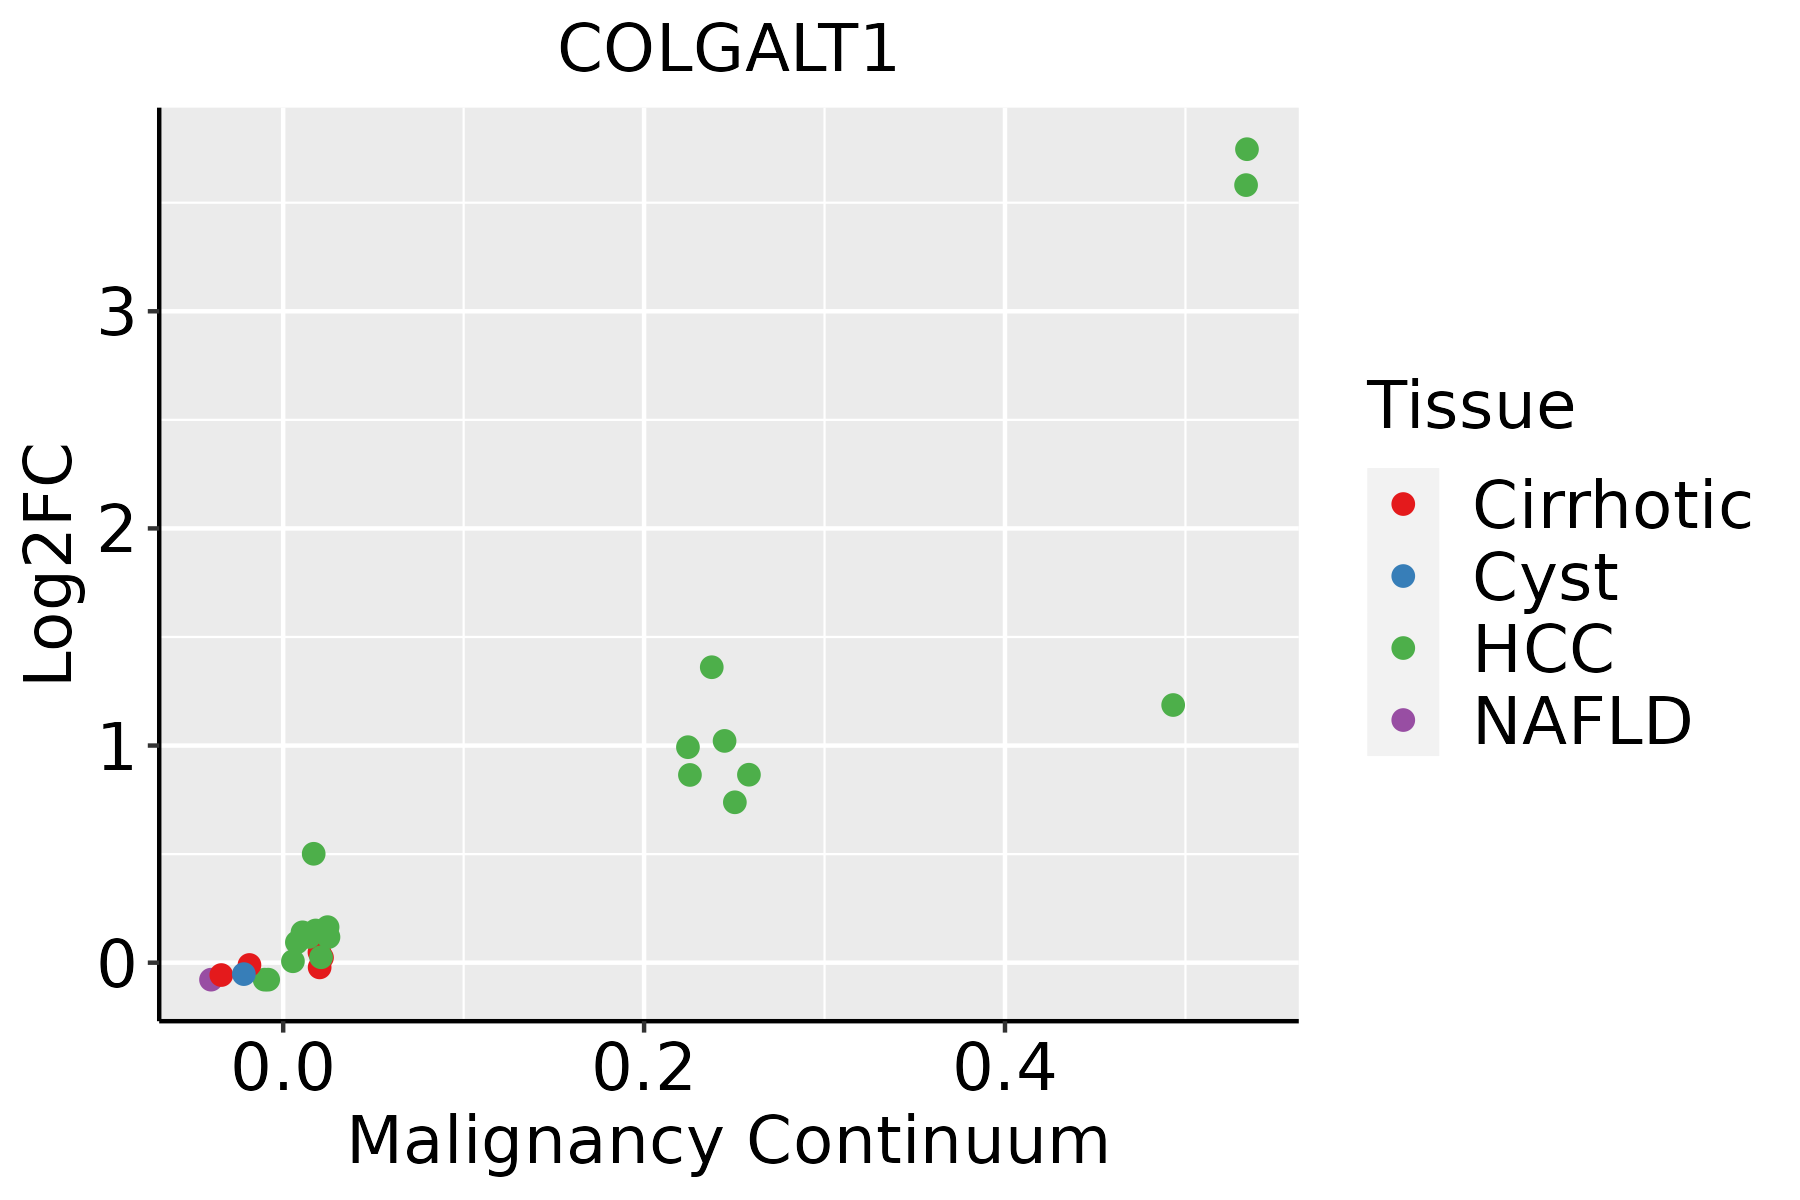 | HCC: Hepatocellular carcinoma |
| NAFLD: Non-alcoholic fatty liver disease | ||
| Oral Cavity | 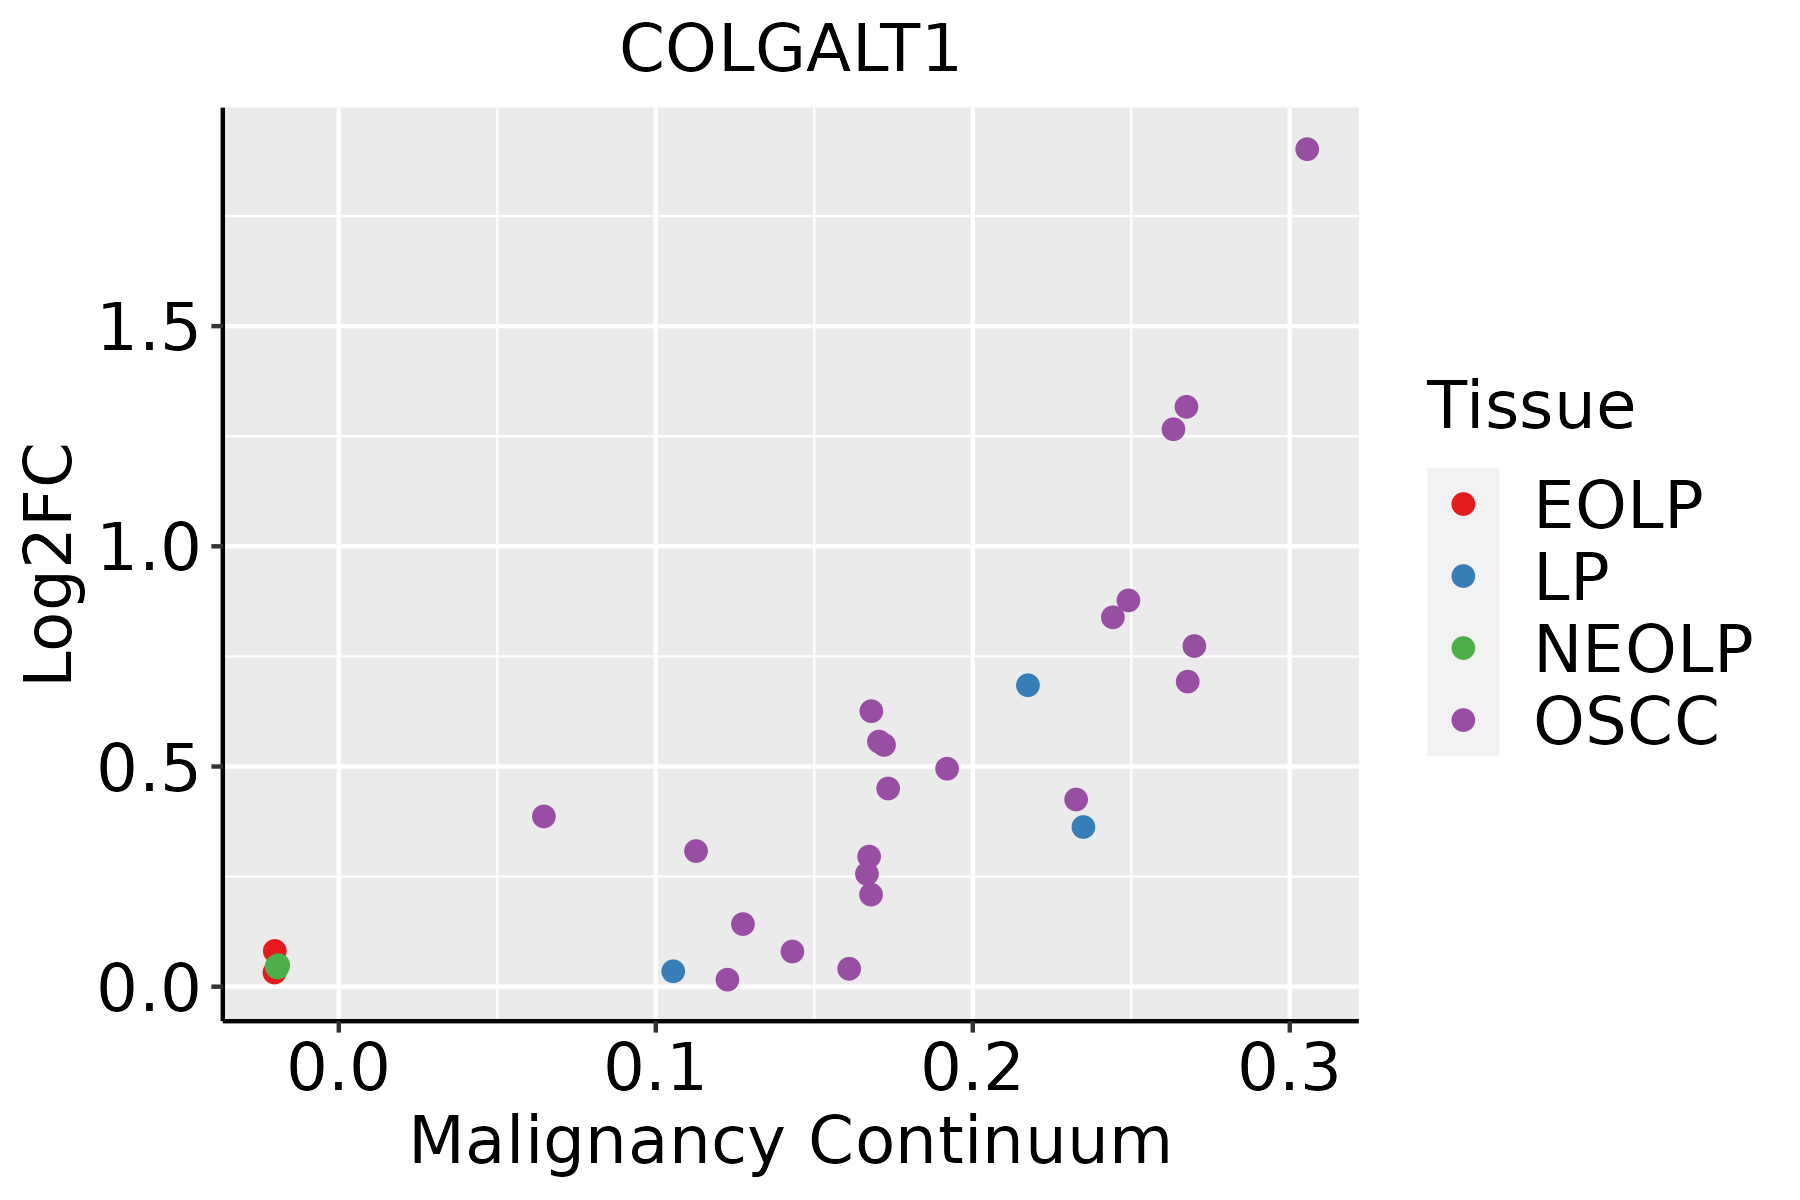 | EOLP: Erosive Oral lichen planus |
| LP: leukoplakia | ||
| NEOLP: Non-erosive oral lichen planus | ||
| OSCC: Oral squamous cell carcinoma | ||
| Skin | 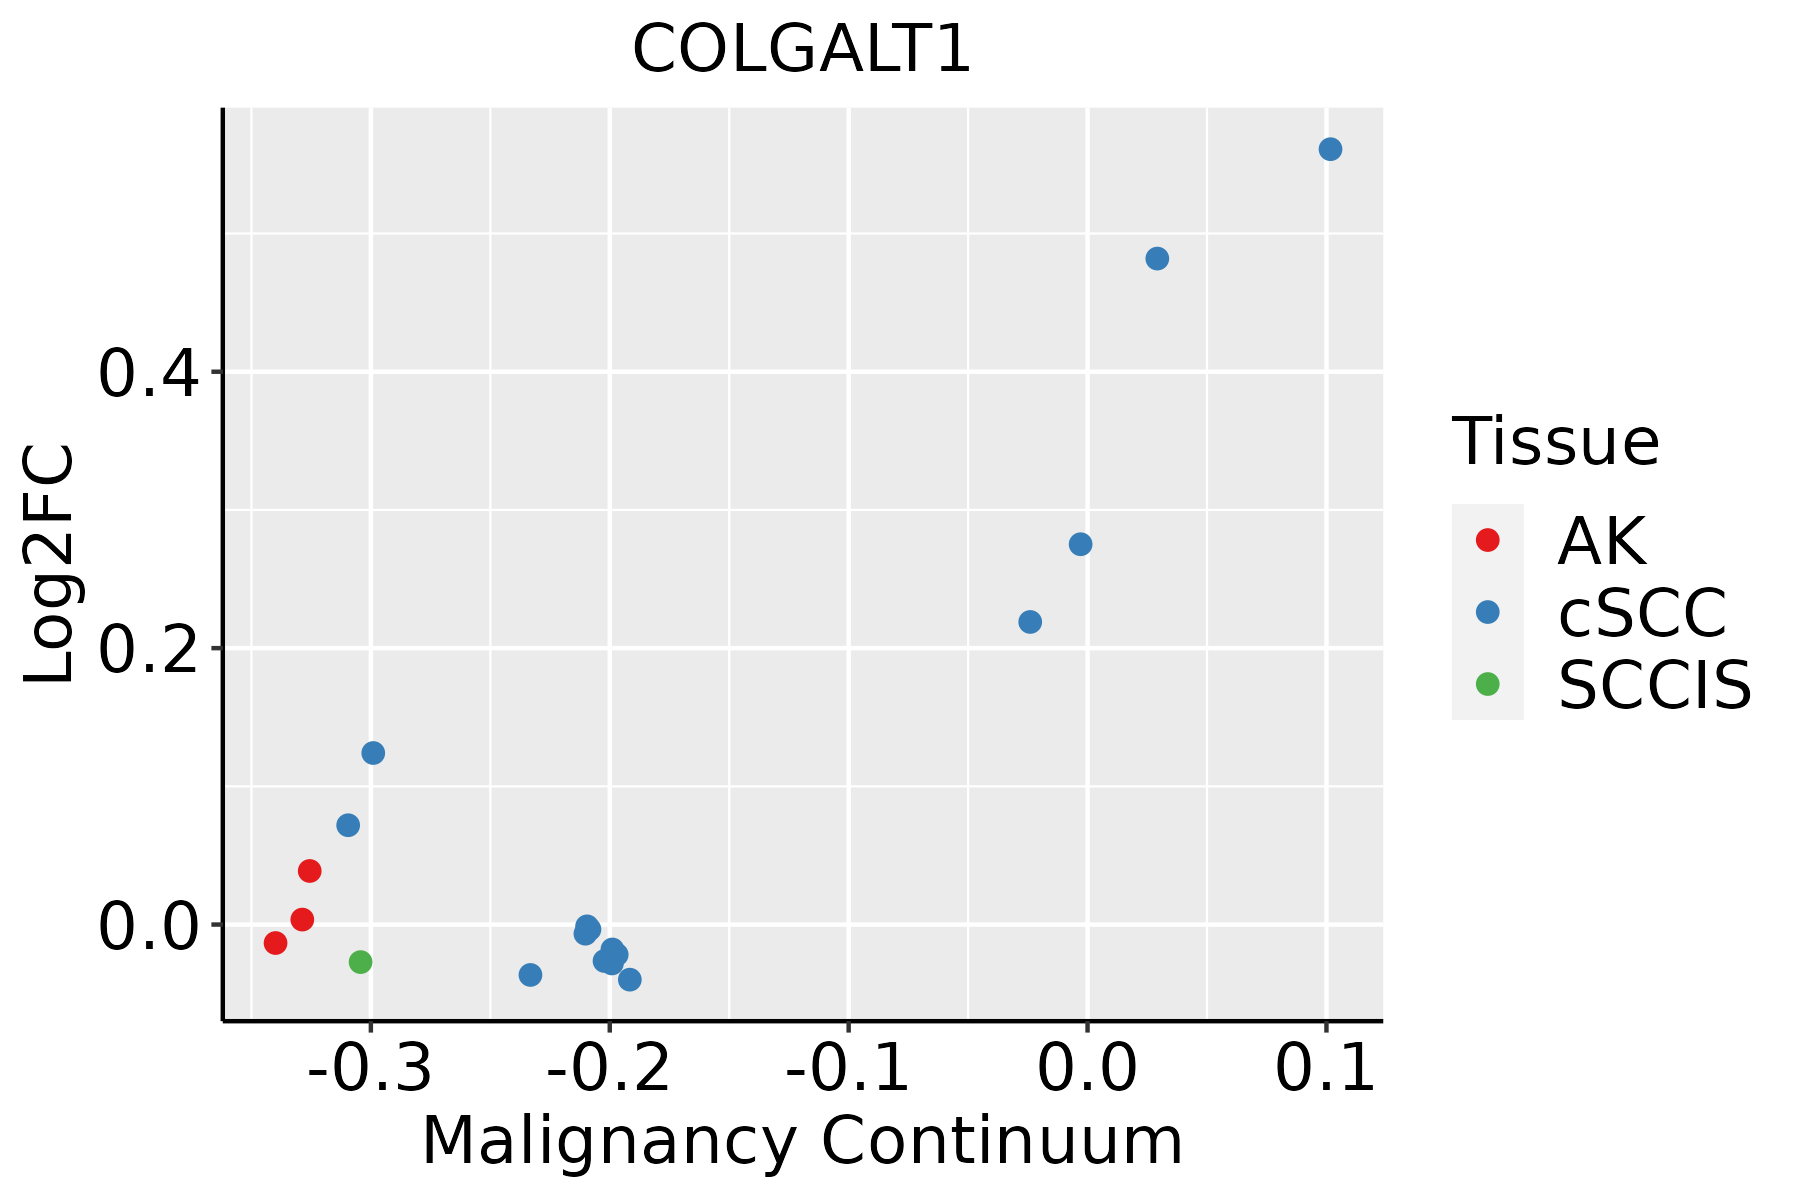 | AK: Actinic keratosis |
| cSCC: Cutaneous squamous cell carcinoma | ||
| SCCIS:squamous cell carcinoma in situ | ||
| Thyroid | 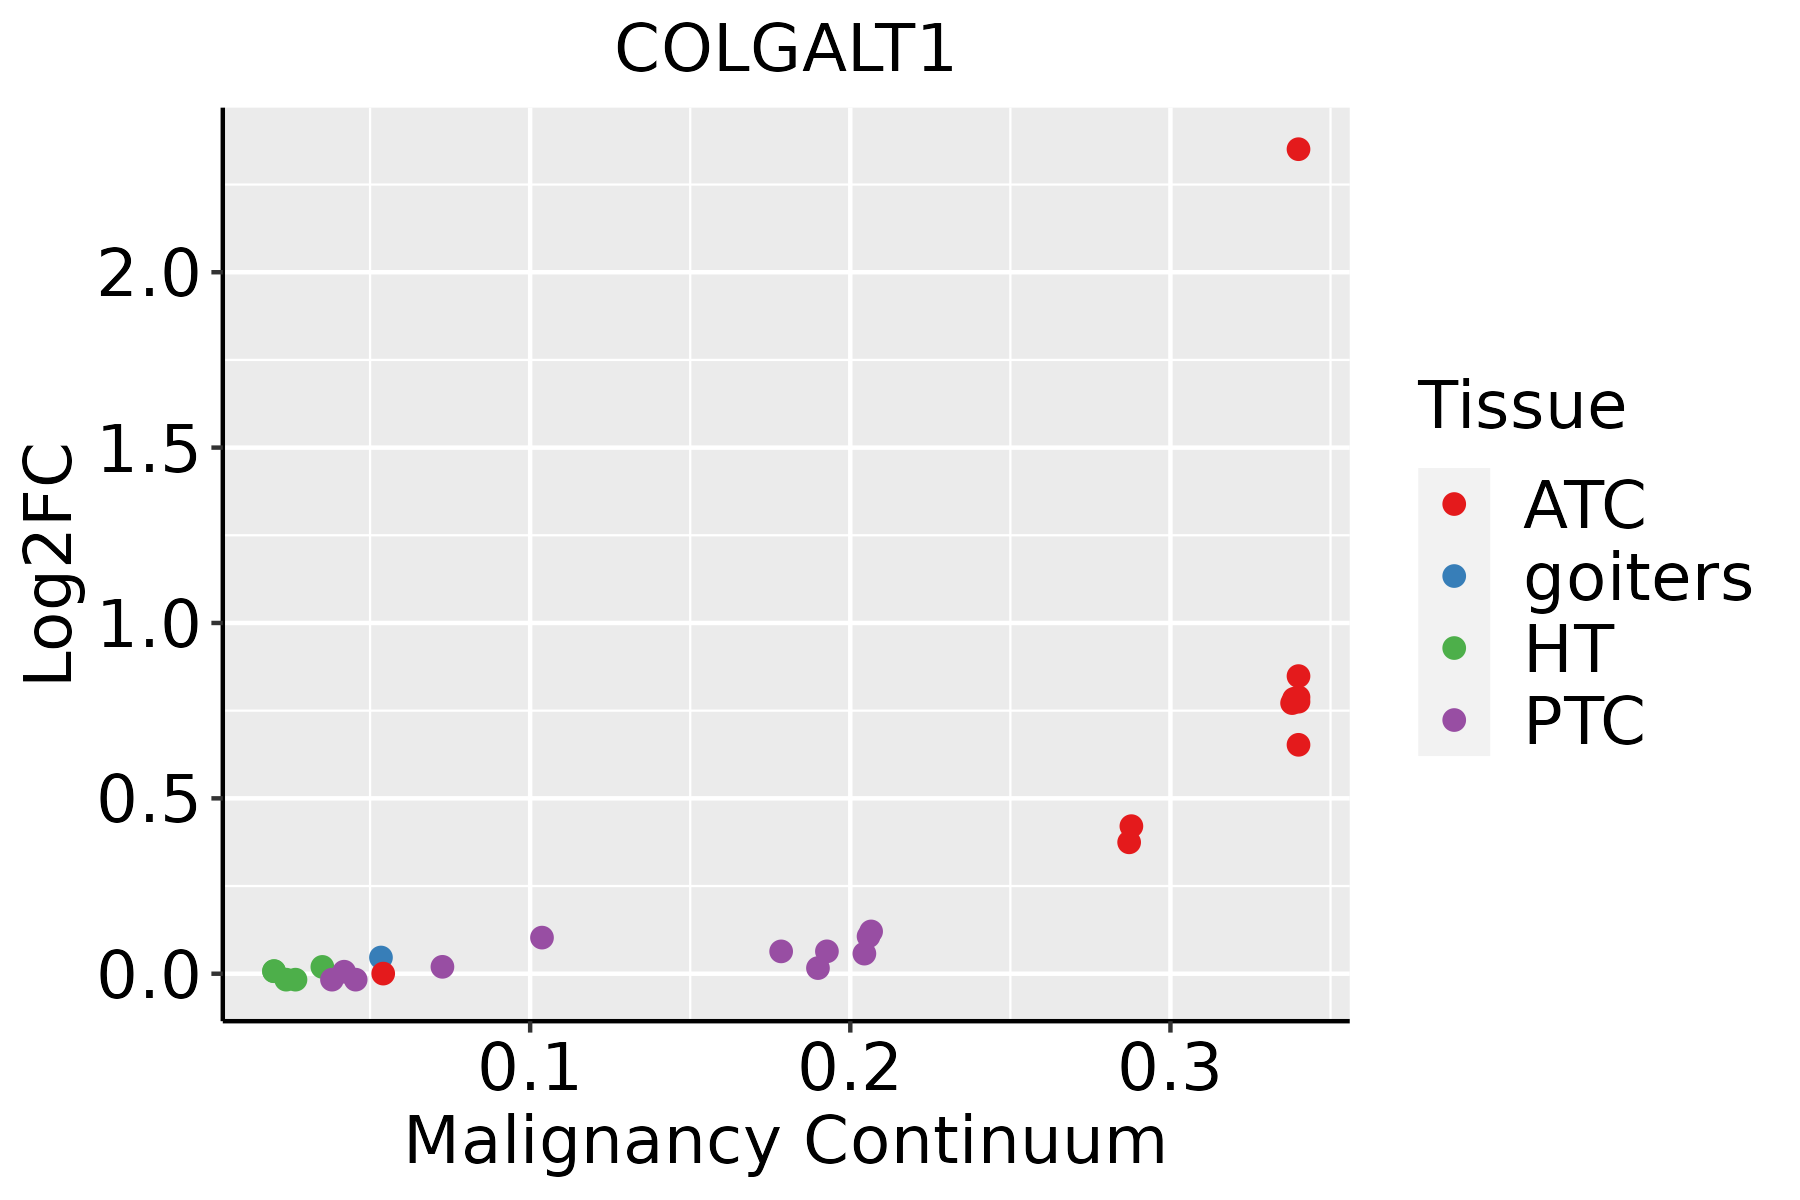 | ATC: Anaplastic thyroid cancer |
| HT: Hashimoto's thyroiditis | ||
| PTC: Papillary thyroid cancer |
| ∗log2FC in expression of this searched gene in stem-like cells from each diseased tissue sample relative to stem-like cells in normal samples in each tissue plotted against the malignancy continuum. Samples are colored based on if they are from different disease stage. |
Top |
Malignant transformation related pathway analysis |
| Find out the enriched GO biological processes and KEGG pathways involved in transition from healthy to precancer to cancer |
| Tissue | Disease Stage | Enriched GO biological Processes |
| Colorectum | AD |  |
| Colorectum | SER |  |
| Colorectum | MSS |  |
| Colorectum | MSI-H |  |
| Colorectum | FAP |  |
| ∗Top 15 enriched GO BP terms are showed in the bar plot of each disease state in each tissue. Each row represents a significant GO biological process which is colored according to the -log10(p.adjust). |
| Page: 1 2 3 4 5 6 7 8 9 |
| GO ID | Tissue | Disease Stage | Description | Gene Ratio | Bg Ratio | pvalue | p.adjust | Count |
| GO:1902905111 | Esophagus | ESCC | positive regulation of supramolecular fiber organization | 142/8552 | 209/18723 | 5.51e-11 | 1.76e-09 | 142 |
| GO:1902903111 | Esophagus | ESCC | regulation of supramolecular fiber organization | 237/8552 | 383/18723 | 9.06e-11 | 2.75e-09 | 237 |
| GO:00301984 | Esophagus | ESCC | extracellular matrix organization | 171/8552 | 301/18723 | 6.08e-05 | 4.67e-04 | 171 |
| GO:00430624 | Esophagus | ESCC | extracellular structure organization | 171/8552 | 302/18723 | 7.73e-05 | 5.76e-04 | 171 |
| GO:00452294 | Esophagus | ESCC | external encapsulating structure organization | 172/8552 | 304/18723 | 7.80e-05 | 5.80e-04 | 172 |
| GO:19030553 | Esophagus | ESCC | positive regulation of extracellular matrix organization | 20/8552 | 25/18723 | 4.81e-04 | 2.69e-03 | 20 |
| GO:00301993 | Esophagus | ESCC | collagen fibril organization | 40/8552 | 61/18723 | 1.35e-03 | 6.44e-03 | 40 |
| GO:19030532 | Esophagus | ESCC | regulation of extracellular matrix organization | 30/8552 | 48/18723 | 1.40e-02 | 4.57e-02 | 30 |
| GO:190290322 | Liver | HCC | regulation of supramolecular fiber organization | 224/7958 | 383/18723 | 1.54e-10 | 5.33e-09 | 224 |
| GO:190290522 | Liver | HCC | positive regulation of supramolecular fiber organization | 131/7958 | 209/18723 | 2.85e-09 | 7.69e-08 | 131 |
| GO:190290520 | Oral cavity | OSCC | positive regulation of supramolecular fiber organization | 131/7305 | 209/18723 | 3.18e-12 | 1.27e-10 | 131 |
| GO:190290320 | Oral cavity | OSCC | regulation of supramolecular fiber organization | 211/7305 | 383/18723 | 9.45e-11 | 2.88e-09 | 211 |
| GO:00301983 | Oral cavity | OSCC | extracellular matrix organization | 146/7305 | 301/18723 | 4.67e-04 | 2.77e-03 | 146 |
| GO:00452293 | Oral cavity | OSCC | external encapsulating structure organization | 147/7305 | 304/18723 | 5.30e-04 | 3.08e-03 | 147 |
| GO:00430623 | Oral cavity | OSCC | extracellular structure organization | 146/7305 | 302/18723 | 5.59e-04 | 3.23e-03 | 146 |
| GO:19030552 | Oral cavity | OSCC | positive regulation of extracellular matrix organization | 18/7305 | 25/18723 | 8.47e-04 | 4.47e-03 | 18 |
| GO:19030531 | Oral cavity | OSCC | regulation of extracellular matrix organization | 28/7305 | 48/18723 | 5.17e-03 | 2.02e-02 | 28 |
| GO:1902905110 | Oral cavity | LP | positive regulation of supramolecular fiber organization | 81/4623 | 209/18723 | 4.30e-06 | 8.80e-05 | 81 |
| GO:1902903110 | Oral cavity | LP | regulation of supramolecular fiber organization | 131/4623 | 383/18723 | 1.58e-05 | 2.78e-04 | 131 |
| GO:190290329 | Skin | cSCC | regulation of supramolecular fiber organization | 145/4864 | 383/18723 | 1.67e-07 | 3.71e-06 | 145 |
| Page: 1 2 |
| Pathway ID | Tissue | Disease Stage | Description | Gene Ratio | Bg Ratio | pvalue | p.adjust | qvalue | Count |
| hsa0031010 | Esophagus | ESCC | Lysine degradation | 41/4205 | 63/8465 | 9.63e-03 | 2.27e-02 | 1.16e-02 | 41 |
| hsa0031013 | Esophagus | ESCC | Lysine degradation | 41/4205 | 63/8465 | 9.63e-03 | 2.27e-02 | 1.16e-02 | 41 |
| hsa0031041 | Liver | HCC | Lysine degradation | 47/4020 | 63/8465 | 1.02e-05 | 7.58e-05 | 4.22e-05 | 47 |
| hsa0031051 | Liver | HCC | Lysine degradation | 47/4020 | 63/8465 | 1.02e-05 | 7.58e-05 | 4.22e-05 | 47 |
| Page: 1 |
Top |
Cell-cell communication analysis |
| Identification of potential cell-cell interactions between two cell types and their ligand-receptor pairs for different disease states |
| Ligand | Receptor | LRpair | Pathway | Tissue | Disease Stage |
| Page: 1 |
Top |
Single-cell gene regulatory network inference analysis |
| Find out the significant the regulons (TFs) and the target genes of each regulon across cell types for different disease states |
| TF | Cell Type | Tissue | Disease Stage | Target Gene | RSS | Regulon Activity |
| ∗The dot plots of a searched regulon are shown for all cell subpopulations in each disease state of each tissue based on the regulon specific score inferred using pySCENIC and by calculating the average expression. |
| Page: 1 |
Top |
Somatic mutation of malignant transformation related genes |
| Annotation of somatic variants for genes involved in malignant transformation |
| Hugo Symbol | Variant Class | Variant Classification | dbSNP RS | HGVSc | HGVSp | HGVSp Short | SWISSPROT | BIOTYPE | SIFT | PolyPhen | Tumor Sample Barcode | Tissue | Histology | Sex | Age | Stage | Therapy Types | Drugs | Outcome |
| COLGALT1 | SNV | Missense_Mutation | c.954G>C | p.Lys318Asn | p.K318N | Q8NBJ5 | protein_coding | tolerated(0.06) | benign(0.005) | TCGA-A2-A04U-01 | Breast | breast invasive carcinoma | Female | <65 | I/II | Chemotherapy | adriamycin | SD | |
| COLGALT1 | SNV | Missense_Mutation | c.1287N>C | p.Gln429His | p.Q429H | Q8NBJ5 | protein_coding | tolerated(0.06) | benign(0.005) | TCGA-BH-A0HP-01 | Breast | breast invasive carcinoma | Female | >=65 | III/IV | Chemotherapy | doxorubicin | SD | |
| COLGALT1 | SNV | Missense_Mutation | rs772575752 | c.317N>G | p.Val106Gly | p.V106G | Q8NBJ5 | protein_coding | tolerated(0.39) | benign(0.232) | TCGA-S3-A6ZG-01 | Breast | breast invasive carcinoma | Female | >=65 | I/II | Chemotherapy | doxorubicin | CR |
| COLGALT1 | SNV | Missense_Mutation | c.596C>G | p.Ser199Cys | p.S199C | Q8NBJ5 | protein_coding | deleterious(0) | probably_damaging(0.993) | TCGA-EK-A3GK-01 | Cervix | cervical & endocervical cancer | Female | <65 | I/II | Unknown | Unknown | SD | |
| COLGALT1 | SNV | Missense_Mutation | c.1321N>A | p.Glu441Lys | p.E441K | Q8NBJ5 | protein_coding | deleterious(0.01) | possibly_damaging(0.664) | TCGA-UC-A7PF-01 | Cervix | cervical & endocervical cancer | Female | <65 | I/II | Unknown | Unknown | SD | |
| COLGALT1 | SNV | Missense_Mutation | c.514C>T | p.Leu172Phe | p.L172F | Q8NBJ5 | protein_coding | tolerated(0.05) | benign(0.356) | TCGA-AA-3675-01 | Colorectum | colon adenocarcinoma | Male | >=65 | I/II | Unknown | Unknown | SD | |
| COLGALT1 | SNV | Missense_Mutation | rs747606083 | c.565N>A | p.Ala189Thr | p.A189T | Q8NBJ5 | protein_coding | deleterious(0) | possibly_damaging(0.848) | TCGA-AA-3710-01 | Colorectum | colon adenocarcinoma | Female | >=65 | I/II | Unknown | Unknown | SD |
| COLGALT1 | SNV | Missense_Mutation | rs149722085 | c.500N>T | p.Ala167Val | p.A167V | Q8NBJ5 | protein_coding | tolerated(0.22) | benign(0.023) | TCGA-AA-3845-01 | Colorectum | colon adenocarcinoma | Female | >=65 | I/II | Unknown | Unknown | PD |
| COLGALT1 | SNV | Missense_Mutation | rs780399866 | c.959N>T | p.Pro320Leu | p.P320L | Q8NBJ5 | protein_coding | deleterious(0) | possibly_damaging(0.706) | TCGA-AA-3955-01 | Colorectum | colon adenocarcinoma | Male | <65 | III/IV | Chemotherapy | capecitabine | CR |
| COLGALT1 | SNV | Missense_Mutation | c.343N>A | p.Val115Met | p.V115M | Q8NBJ5 | protein_coding | deleterious(0) | probably_damaging(0.991) | TCGA-AA-A01R-01 | Colorectum | colon adenocarcinoma | Male | <65 | III/IV | Chemotherapy | 5-fluorouracil | PD |
| Page: 1 2 3 4 5 6 7 |
Top |
Related drugs of malignant transformation related genes |
| Identification of chemicals and drugs interact with genes involved in malignant transfromation |
| (DGIdb 4.0) |
| Entrez ID | Symbol | Category | Interaction Types | Drug Claim Name | Drug Name | PMIDs |
| Page: 1 |

Copyright 2023-Present -The University of Texas Health Science Center at Houston |