
|
|||||
|
 | |
| |
| |
| |
| |
| |
|
Gene: COLEC12 |
Gene summary for COLEC12 |
| Gene information | Species | Human | Gene symbol | COLEC12 | Gene ID | 81035 |
| Gene name | collectin subfamily member 12 | |
| Gene Alias | CLP1 | |
| Cytomap | 18p11.32 | |
| Gene Type | protein-coding | GO ID | GO:0002221 | UniProtAcc | Q5KU26 |
Top |
Malignant transformation analysis |
| Identification of the aberrant gene expression in precancerous and cancerous lesions by comparing the gene expression of stem-like cells in diseased tissues with normal stem cells |
| Entrez ID | Symbol | Replicates | Species | Organ | Tissue | Adj P-value | Log2FC | Malignancy |
| 81035 | COLEC12 | PTC07 | Human | Thyroid | PTC | 2.26e-02 | 4.49e-02 | 0.2044 |
| 81035 | COLEC12 | ATC12 | Human | Thyroid | ATC | 1.17e-31 | 6.05e-01 | 0.34 |
| 81035 | COLEC12 | ATC13 | Human | Thyroid | ATC | 6.25e-04 | 8.33e-02 | 0.34 |
| 81035 | COLEC12 | ATC4 | Human | Thyroid | ATC | 2.92e-38 | 7.11e-01 | 0.34 |
| 81035 | COLEC12 | ATC5 | Human | Thyroid | ATC | 4.82e-02 | 8.86e-02 | 0.34 |
| Page: 1 |
| Tissue | Expression Dynamics | Abbreviation |
| Thyroid | 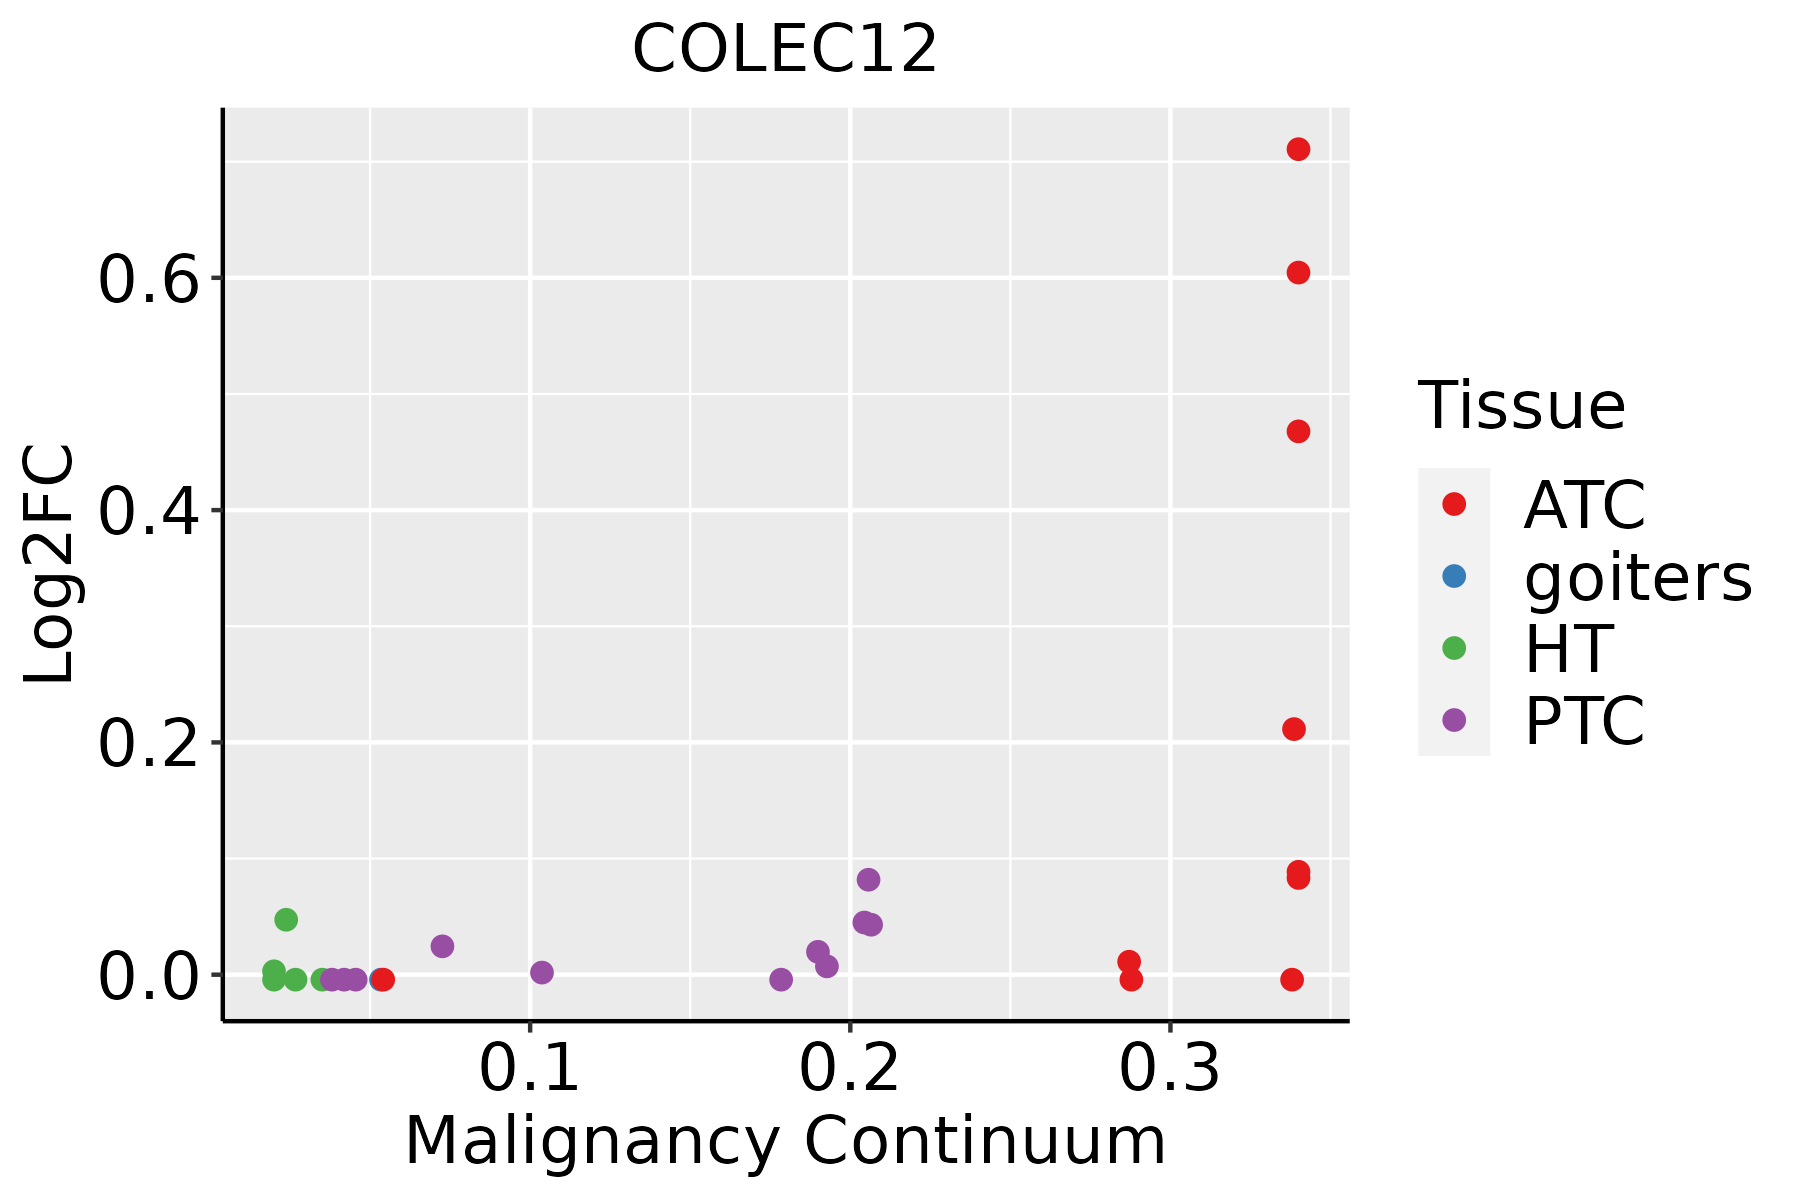 | ATC: Anaplastic thyroid cancer |
| HT: Hashimoto's thyroiditis | ||
| PTC: Papillary thyroid cancer |
| ∗log2FC in expression of this searched gene in stem-like cells from each diseased tissue sample relative to stem-like cells in normal samples in each tissue plotted against the malignancy continuum. Samples are colored based on if they are from different disease stage. |
Top |
Malignant transformation related pathway analysis |
| Find out the enriched GO biological processes and KEGG pathways involved in transition from healthy to precancer to cancer |
| Tissue | Disease Stage | Enriched GO biological Processes |
| Colorectum | AD |  |
| Colorectum | SER |  |
| Colorectum | MSS |  |
| Colorectum | MSI-H |  |
| Colorectum | FAP |  |
| ∗Top 15 enriched GO BP terms are showed in the bar plot of each disease state in each tissue. Each row represents a significant GO biological process which is colored according to the -log10(p.adjust). |
| Page: 1 2 3 4 5 6 7 8 9 |
| GO ID | Tissue | Disease Stage | Description | Gene Ratio | Bg Ratio | pvalue | p.adjust | Count |
| GO:0009743113 | Thyroid | PTC | response to carbohydrate | 111/5968 | 253/18723 | 3.77e-05 | 3.48e-04 | 111 |
| GO:00022215 | Thyroid | PTC | pattern recognition receptor signaling pathway | 77/5968 | 172/18723 | 2.56e-04 | 1.84e-03 | 77 |
| GO:00713593 | Thyroid | PTC | cellular response to dsRNA | 15/5968 | 22/18723 | 5.11e-04 | 3.32e-03 | 15 |
| GO:00713602 | Thyroid | PTC | cellular response to exogenous dsRNA | 12/5968 | 18/18723 | 2.55e-03 | 1.31e-02 | 12 |
| GO:0071322111 | Thyroid | PTC | cellular response to carbohydrate stimulus | 68/5968 | 163/18723 | 5.00e-03 | 2.31e-02 | 68 |
| GO:00433312 | Thyroid | PTC | response to dsRNA | 26/5968 | 55/18723 | 1.21e-02 | 4.75e-02 | 26 |
| GO:000974333 | Thyroid | ATC | response to carbohydrate | 114/6293 | 253/18723 | 9.26e-05 | 6.81e-04 | 114 |
| GO:000222114 | Thyroid | ATC | pattern recognition receptor signaling pathway | 80/6293 | 172/18723 | 2.89e-04 | 1.84e-03 | 80 |
| GO:007135912 | Thyroid | ATC | cellular response to dsRNA | 15/6293 | 22/18723 | 9.63e-04 | 5.13e-03 | 15 |
| GO:007132224 | Thyroid | ATC | cellular response to carbohydrate stimulus | 72/6293 | 163/18723 | 3.12e-03 | 1.41e-02 | 72 |
| GO:00713601 | Thyroid | ATC | cellular response to exogenous dsRNA | 12/6293 | 18/18723 | 4.22e-03 | 1.79e-02 | 12 |
| GO:004333111 | Thyroid | ATC | response to dsRNA | 27/6293 | 55/18723 | 1.24e-02 | 4.38e-02 | 27 |
| Page: 1 |
| Pathway ID | Tissue | Disease Stage | Description | Gene Ratio | Bg Ratio | pvalue | p.adjust | qvalue | Count |
| Page: 1 |
Top |
Cell-cell communication analysis |
| Identification of potential cell-cell interactions between two cell types and their ligand-receptor pairs for different disease states |
| Ligand | Receptor | LRpair | Pathway | Tissue | Disease Stage |
| Page: 1 |
Top |
Single-cell gene regulatory network inference analysis |
| Find out the significant the regulons (TFs) and the target genes of each regulon across cell types for different disease states |
| TF | Cell Type | Tissue | Disease Stage | Target Gene | RSS | Regulon Activity |
| ∗The dot plots of a searched regulon are shown for all cell subpopulations in each disease state of each tissue based on the regulon specific score inferred using pySCENIC and by calculating the average expression. |
| Page: 1 |
Top |
Somatic mutation of malignant transformation related genes |
| Annotation of somatic variants for genes involved in malignant transformation |
| Hugo Symbol | Variant Class | Variant Classification | dbSNP RS | HGVSc | HGVSp | HGVSp Short | SWISSPROT | BIOTYPE | SIFT | PolyPhen | Tumor Sample Barcode | Tissue | Histology | Sex | Age | Stage | Therapy Types | Drugs | Outcome |
| COLEC12 | SNV | Missense_Mutation | c.313A>C | p.Asn105His | p.N105H | Q5KU26 | protein_coding | deleterious(0.01) | possibly_damaging(0.77) | TCGA-AR-A251-01 | Breast | breast invasive carcinoma | Female | <65 | III/IV | Chemotherapy | doxorubicin | SD | |
| COLEC12 | SNV | Missense_Mutation | rs568456291 | c.1076C>T | p.Thr359Met | p.T359M | Q5KU26 | protein_coding | deleterious(0.03) | possibly_damaging(0.549) | TCGA-BH-A18T-01 | Breast | breast invasive carcinoma | Female | >=65 | I/II | Unknown | Unknown | PD |
| COLEC12 | insertion | Frame_Shift_Ins | novel | c.673_674insAATTT | p.Arg225GlnfsTer36 | p.R225Qfs*36 | Q5KU26 | protein_coding | TCGA-AN-A04C-01 | Breast | breast invasive carcinoma | Female | <65 | I/II | Unknown | Unknown | SD | ||
| COLEC12 | insertion | Frame_Shift_Ins | novel | c.671_672insACAAGTTACTCTAAAACTTG | p.Arg225GlnfsTer41 | p.R225Qfs*41 | Q5KU26 | protein_coding | TCGA-AN-A04C-01 | Breast | breast invasive carcinoma | Female | <65 | I/II | Unknown | Unknown | SD | ||
| COLEC12 | insertion | Nonsense_Mutation | novel | c.463_464insGAATTCAAGAGCAGCTTAGCTAGATGGTCCTGACTCA | p.Glu155GlyfsTer8 | p.E155Gfs*8 | Q5KU26 | protein_coding | TCGA-B6-A0I6-01 | Breast | breast invasive carcinoma | Female | <65 | I/II | Unknown | Unknown | PD | ||
| COLEC12 | SNV | Missense_Mutation | rs143447500 | c.404N>T | p.Thr135Met | p.T135M | Q5KU26 | protein_coding | tolerated(0.24) | benign(0.003) | TCGA-C5-A8XI-01 | Cervix | cervical & endocervical cancer | Female | >=65 | I/II | Chemotherapy | cisplatin | SD |
| COLEC12 | SNV | Missense_Mutation | c.740N>C | p.Val247Ala | p.V247A | Q5KU26 | protein_coding | tolerated(0.27) | benign(0.007) | TCGA-DR-A0ZM-01 | Cervix | cervical & endocervical cancer | Female | <65 | III/IV | Unspecific | Cisplatin | SD | |
| COLEC12 | SNV | Missense_Mutation | rs146515222 | c.1178G>A | p.Arg393His | p.R393H | Q5KU26 | protein_coding | deleterious(0.02) | possibly_damaging(0.54) | TCGA-EA-A3HQ-01 | Cervix | cervical & endocervical cancer | Female | <65 | I/II | Unknown | Unknown | SD |
| COLEC12 | SNV | Missense_Mutation | c.1576C>A | p.Pro526Thr | p.P526T | Q5KU26 | protein_coding | deleterious(0.01) | benign(0.247) | TCGA-EA-A5FO-01 | Cervix | cervical & endocervical cancer | Female | <65 | I/II | Unknown | Unknown | SD | |
| COLEC12 | SNV | Missense_Mutation | rs765714248 | c.1072N>T | p.Arg358Trp | p.R358W | Q5KU26 | protein_coding | deleterious(0.02) | possibly_damaging(0.65) | TCGA-EK-A2R9-01 | Cervix | cervical & endocervical cancer | Female | <65 | I/II | Unknown | Unknown | SD |
| Page: 1 2 3 4 5 6 7 8 9 10 11 12 13 14 15 |
Top |
Related drugs of malignant transformation related genes |
| Identification of chemicals and drugs interact with genes involved in malignant transfromation |
| (DGIdb 4.0) |
| Entrez ID | Symbol | Category | Interaction Types | Drug Claim Name | Drug Name | PMIDs |
| Page: 1 |

Copyright 2023-Present -The University of Texas Health Science Center at Houston |