
|
|||||
|
 | |
| |
| |
| |
| |
| |
|
Gene: COL9A3 |
Gene summary for COL9A3 |
| Gene information | Species | Human | Gene symbol | COL9A3 | Gene ID | 1299 |
| Gene name | collagen type IX alpha 3 chain | |
| Gene Alias | DJ885L7.4.1 | |
| Cytomap | 20q13.33 | |
| Gene Type | protein-coding | GO ID | GO:0000003 | UniProtAcc | Q14050 |
Top |
Malignant transformation analysis |
| Identification of the aberrant gene expression in precancerous and cancerous lesions by comparing the gene expression of stem-like cells in diseased tissues with normal stem cells |
| Entrez ID | Symbol | Replicates | Species | Organ | Tissue | Adj P-value | Log2FC | Malignancy |
| 1299 | COL9A3 | P2T-E | Human | Esophagus | ESCC | 1.39e-110 | 1.96e+00 | 0.1177 |
| 1299 | COL9A3 | P4T-E | Human | Esophagus | ESCC | 1.75e-05 | 1.51e-01 | 0.1323 |
| 1299 | COL9A3 | P5T-E | Human | Esophagus | ESCC | 4.52e-06 | 1.31e-01 | 0.1327 |
| 1299 | COL9A3 | P9T-E | Human | Esophagus | ESCC | 8.16e-12 | 2.83e-01 | 0.1131 |
| 1299 | COL9A3 | P10T-E | Human | Esophagus | ESCC | 2.40e-05 | 1.18e-01 | 0.116 |
| 1299 | COL9A3 | P11T-E | Human | Esophagus | ESCC | 5.37e-25 | 9.46e-01 | 0.1426 |
| 1299 | COL9A3 | P12T-E | Human | Esophagus | ESCC | 2.73e-35 | 7.26e-01 | 0.1122 |
| 1299 | COL9A3 | P15T-E | Human | Esophagus | ESCC | 8.45e-04 | 2.33e-01 | 0.1149 |
| 1299 | COL9A3 | P16T-E | Human | Esophagus | ESCC | 2.05e-115 | 3.34e+00 | 0.1153 |
| 1299 | COL9A3 | P19T-E | Human | Esophagus | ESCC | 1.65e-10 | 1.15e+00 | 0.1662 |
| 1299 | COL9A3 | P20T-E | Human | Esophagus | ESCC | 1.17e-04 | 1.28e-01 | 0.1124 |
| 1299 | COL9A3 | P21T-E | Human | Esophagus | ESCC | 1.35e-08 | 2.69e-01 | 0.1617 |
| 1299 | COL9A3 | P22T-E | Human | Esophagus | ESCC | 2.13e-08 | 1.00e-01 | 0.1236 |
| 1299 | COL9A3 | P27T-E | Human | Esophagus | ESCC | 2.26e-06 | 4.45e-01 | 0.1055 |
| 1299 | COL9A3 | P28T-E | Human | Esophagus | ESCC | 2.00e-11 | 2.23e-01 | 0.1149 |
| 1299 | COL9A3 | P31T-E | Human | Esophagus | ESCC | 2.53e-70 | 1.61e+00 | 0.1251 |
| 1299 | COL9A3 | P32T-E | Human | Esophagus | ESCC | 1.54e-07 | 6.90e-01 | 0.1666 |
| 1299 | COL9A3 | P38T-E | Human | Esophagus | ESCC | 3.67e-05 | 1.72e-01 | 0.127 |
| 1299 | COL9A3 | P39T-E | Human | Esophagus | ESCC | 5.71e-08 | 9.52e-02 | 0.0894 |
| 1299 | COL9A3 | P42T-E | Human | Esophagus | ESCC | 9.05e-04 | 4.72e-01 | 0.1175 |
| Page: 1 2 3 |
| Tissue | Expression Dynamics | Abbreviation |
| Esophagus |  | ESCC: Esophageal squamous cell carcinoma |
| HGIN: High-grade intraepithelial neoplasias | ||
| LGIN: Low-grade intraepithelial neoplasias | ||
| Liver | 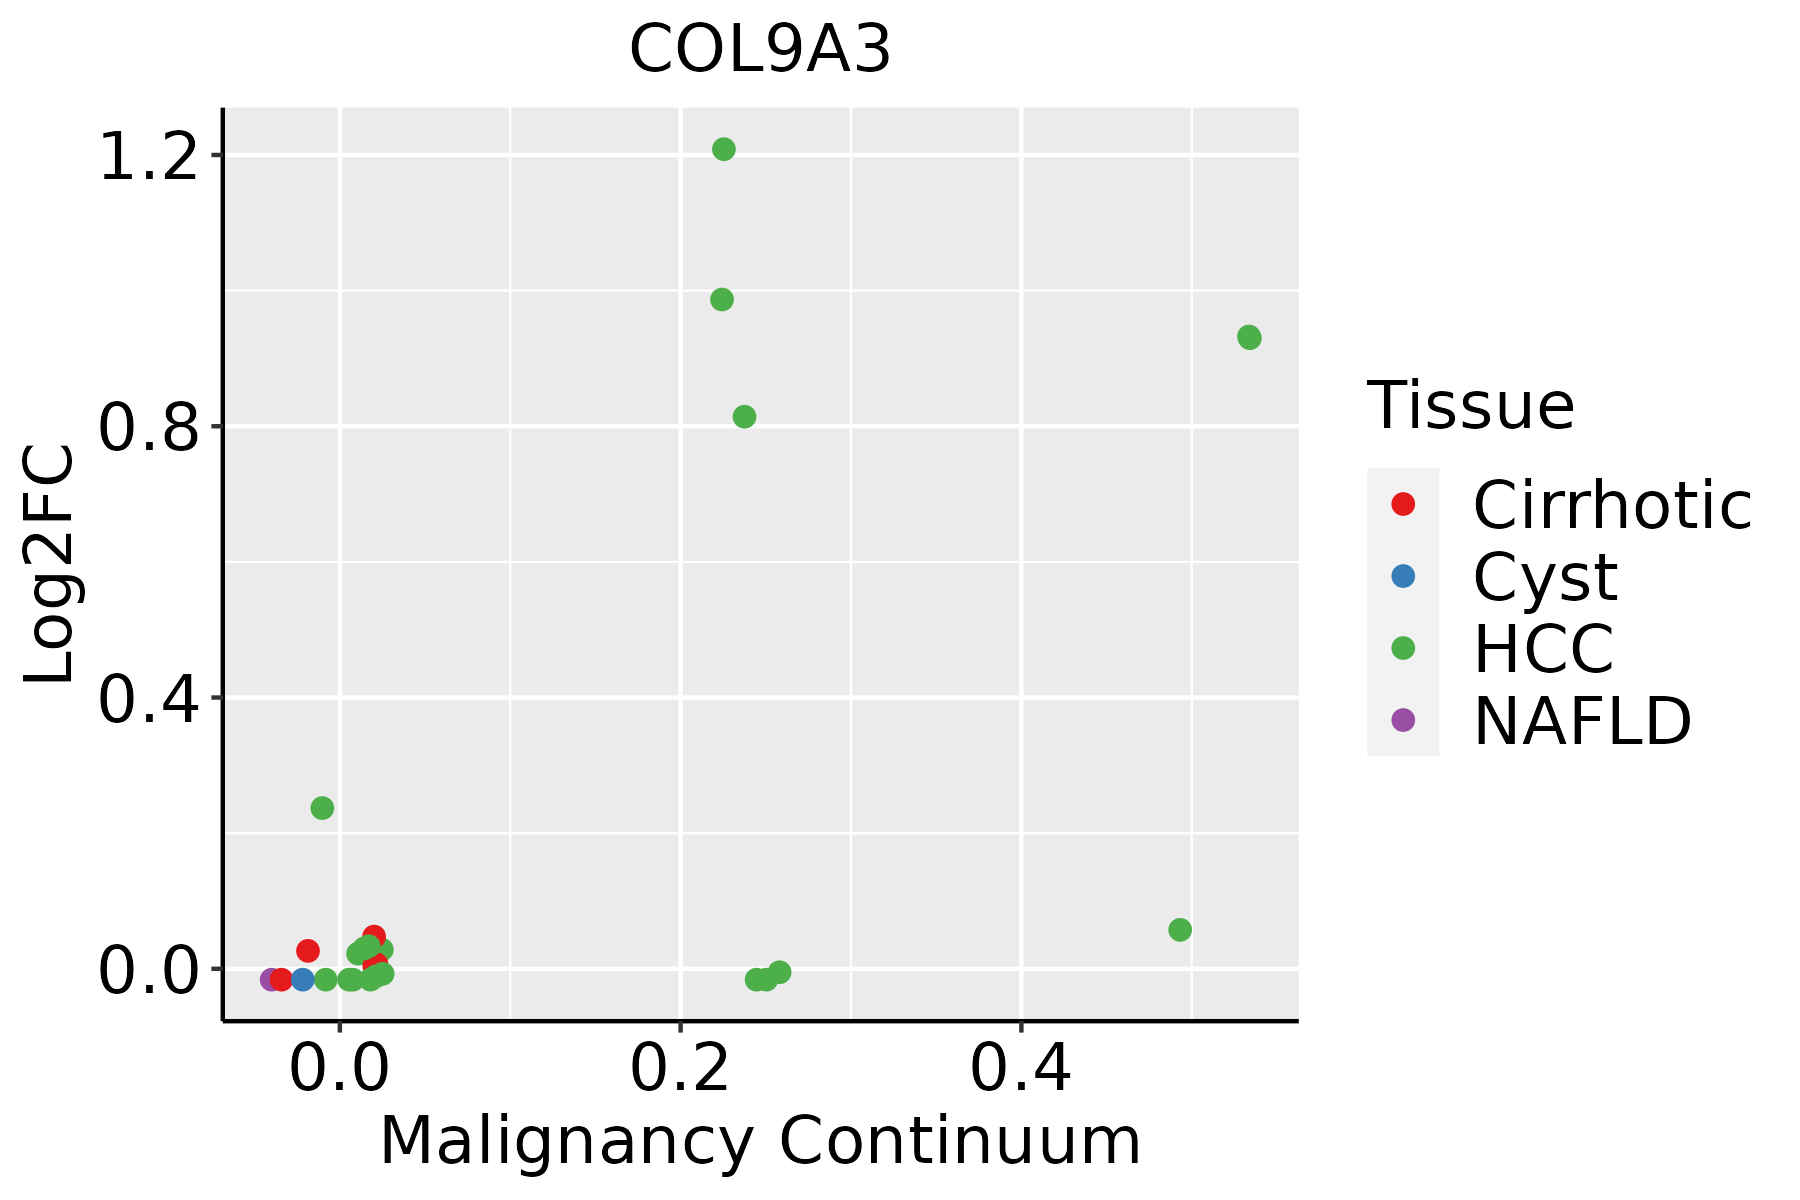 | HCC: Hepatocellular carcinoma |
| NAFLD: Non-alcoholic fatty liver disease | ||
| Thyroid |  | ATC: Anaplastic thyroid cancer |
| HT: Hashimoto's thyroiditis | ||
| PTC: Papillary thyroid cancer |
| ∗log2FC in expression of this searched gene in stem-like cells from each diseased tissue sample relative to stem-like cells in normal samples in each tissue plotted against the malignancy continuum. Samples are colored based on if they are from different disease stage. |
Top |
Malignant transformation related pathway analysis |
| Find out the enriched GO biological processes and KEGG pathways involved in transition from healthy to precancer to cancer |
| Tissue | Disease Stage | Enriched GO biological Processes |
| Colorectum | AD |  |
| Colorectum | SER |  |
| Colorectum | MSS |  |
| Colorectum | MSI-H |  |
| Colorectum | FAP |  |
| ∗Top 15 enriched GO BP terms are showed in the bar plot of each disease state in each tissue. Each row represents a significant GO biological process which is colored according to the -log10(p.adjust). |
| Page: 1 2 3 4 5 6 7 8 9 |
| GO ID | Tissue | Disease Stage | Description | Gene Ratio | Bg Ratio | pvalue | p.adjust | Count |
| GO:0061458110 | Esophagus | ESCC | reproductive system development | 247/8552 | 427/18723 | 2.24e-07 | 3.42e-06 | 247 |
| GO:004860818 | Esophagus | ESCC | reproductive structure development | 245/8552 | 424/18723 | 2.82e-07 | 4.14e-06 | 245 |
| GO:00301984 | Esophagus | ESCC | extracellular matrix organization | 171/8552 | 301/18723 | 6.08e-05 | 4.67e-04 | 171 |
| GO:00430624 | Esophagus | ESCC | extracellular structure organization | 171/8552 | 302/18723 | 7.73e-05 | 5.76e-04 | 171 |
| GO:00452294 | Esophagus | ESCC | external encapsulating structure organization | 172/8552 | 304/18723 | 7.80e-05 | 5.80e-04 | 172 |
| GO:006145811 | Liver | HCC | reproductive system development | 205/7958 | 427/18723 | 1.16e-02 | 4.27e-02 | 205 |
| GO:003019812 | Thyroid | ATC | extracellular matrix organization | 152/6293 | 301/18723 | 8.63e-10 | 2.24e-08 | 152 |
| GO:004306212 | Thyroid | ATC | extracellular structure organization | 152/6293 | 302/18723 | 1.17e-09 | 2.94e-08 | 152 |
| GO:004522912 | Thyroid | ATC | external encapsulating structure organization | 152/6293 | 304/18723 | 2.11e-09 | 5.08e-08 | 152 |
| GO:006145827 | Thyroid | ATC | reproductive system development | 193/6293 | 427/18723 | 3.32e-07 | 4.92e-06 | 193 |
| GO:004860825 | Thyroid | ATC | reproductive structure development | 190/6293 | 424/18723 | 8.40e-07 | 1.11e-05 | 190 |
| GO:004654621 | Thyroid | ATC | development of primary male sexual characteristics | 72/6293 | 142/18723 | 1.85e-05 | 1.69e-04 | 72 |
| GO:000858421 | Thyroid | ATC | male gonad development | 71/6293 | 141/18723 | 2.83e-05 | 2.38e-04 | 71 |
| GO:004666112 | Thyroid | ATC | male sex differentiation | 77/6293 | 165/18723 | 3.27e-04 | 2.04e-03 | 77 |
| GO:000840613 | Thyroid | ATC | gonad development | 96/6293 | 221/18723 | 1.40e-03 | 7.25e-03 | 96 |
| GO:00451374 | Thyroid | ATC | development of primary sexual characteristics | 97/6293 | 227/18723 | 2.47e-03 | 1.14e-02 | 97 |
| GO:00466603 | Thyroid | ATC | female sex differentiation | 51/6293 | 114/18723 | 8.62e-03 | 3.28e-02 | 51 |
| GO:00085853 | Thyroid | ATC | female gonad development | 43/6293 | 95/18723 | 1.19e-02 | 4.22e-02 | 43 |
| Page: 1 |
| Pathway ID | Tissue | Disease Stage | Description | Gene Ratio | Bg Ratio | pvalue | p.adjust | qvalue | Count |
| hsa0516510 | Esophagus | ESCC | Human papillomavirus infection | 215/4205 | 331/8465 | 7.86e-09 | 7.12e-08 | 3.65e-08 | 215 |
| hsa0451020 | Esophagus | ESCC | Focal adhesion | 127/4205 | 203/8465 | 1.25e-04 | 4.99e-04 | 2.56e-04 | 127 |
| hsa041517 | Esophagus | ESCC | PI3K-Akt signaling pathway | 197/4205 | 354/8465 | 1.24e-02 | 2.83e-02 | 1.45e-02 | 197 |
| hsa0516515 | Esophagus | ESCC | Human papillomavirus infection | 215/4205 | 331/8465 | 7.86e-09 | 7.12e-08 | 3.65e-08 | 215 |
| hsa04510111 | Esophagus | ESCC | Focal adhesion | 127/4205 | 203/8465 | 1.25e-04 | 4.99e-04 | 2.56e-04 | 127 |
| hsa0415114 | Esophagus | ESCC | PI3K-Akt signaling pathway | 197/4205 | 354/8465 | 1.24e-02 | 2.83e-02 | 1.45e-02 | 197 |
| hsa0451041 | Liver | HCC | Focal adhesion | 125/4020 | 203/8465 | 3.12e-05 | 1.88e-04 | 1.04e-04 | 125 |
| hsa051652 | Liver | HCC | Human papillomavirus infection | 188/4020 | 331/8465 | 3.34e-04 | 1.49e-03 | 8.29e-04 | 188 |
| hsa0451051 | Liver | HCC | Focal adhesion | 125/4020 | 203/8465 | 3.12e-05 | 1.88e-04 | 1.04e-04 | 125 |
| hsa051653 | Liver | HCC | Human papillomavirus infection | 188/4020 | 331/8465 | 3.34e-04 | 1.49e-03 | 8.29e-04 | 188 |
| Page: 1 |
Top |
Cell-cell communication analysis |
| Identification of potential cell-cell interactions between two cell types and their ligand-receptor pairs for different disease states |
| Ligand | Receptor | LRpair | Pathway | Tissue | Disease Stage |
| COL9A3 | ITGA1_ITGB1 | COL9A3_ITGA1_ITGB1 | COLLAGEN | Esophagus | ESCC |
| COL9A3 | ITGA2_ITGB1 | COL9A3_ITGA2_ITGB1 | COLLAGEN | Esophagus | ESCC |
| COL9A3 | ITGA3_ITGB1 | COL9A3_ITGA3_ITGB1 | COLLAGEN | Esophagus | ESCC |
| COL9A3 | ITGA9_ITGB1 | COL9A3_ITGA9_ITGB1 | COLLAGEN | Esophagus | ESCC |
| COL9A3 | ITGA11_ITGB1 | COL9A3_ITGA11_ITGB1 | COLLAGEN | Esophagus | ESCC |
| COL9A3 | ITGAV_ITGB8 | COL9A3_ITGAV_ITGB8 | COLLAGEN | Esophagus | ESCC |
| COL9A3 | CD44 | COL9A3_CD44 | COLLAGEN | Esophagus | ESCC |
| COL9A3 | SDC1 | COL9A3_SDC1 | COLLAGEN | Esophagus | ESCC |
| COL9A3 | SDC4 | COL9A3_SDC4 | COLLAGEN | Esophagus | ESCC |
| COL9A3 | CD44 | COL9A3_CD44 | COLLAGEN | GC | Precancer |
| COL9A3 | SDC4 | COL9A3_SDC4 | COLLAGEN | GC | Precancer |
| COL9A3 | ITGA1_ITGB1 | COL9A3_ITGA1_ITGB1 | COLLAGEN | HNSCC | Precancer |
| COL9A3 | ITGA2_ITGB1 | COL9A3_ITGA2_ITGB1 | COLLAGEN | HNSCC | Precancer |
| COL9A3 | ITGA3_ITGB1 | COL9A3_ITGA3_ITGB1 | COLLAGEN | HNSCC | Precancer |
| COL9A3 | ITGA9_ITGB1 | COL9A3_ITGA9_ITGB1 | COLLAGEN | HNSCC | Precancer |
| COL9A3 | ITGAV_ITGB8 | COL9A3_ITGAV_ITGB8 | COLLAGEN | HNSCC | Precancer |
| COL9A3 | SDC1 | COL9A3_SDC1 | COLLAGEN | HNSCC | Precancer |
| COL9A3 | SDC4 | COL9A3_SDC4 | COLLAGEN | HNSCC | Precancer |
| COL9A3 | ITGA1_ITGB1 | COL9A3_ITGA1_ITGB1 | COLLAGEN | Prostate | BPH |
| COL9A3 | ITGA2_ITGB1 | COL9A3_ITGA2_ITGB1 | COLLAGEN | Prostate | BPH |
| Page: 1 2 |
Top |
Single-cell gene regulatory network inference analysis |
| Find out the significant the regulons (TFs) and the target genes of each regulon across cell types for different disease states |
| TF | Cell Type | Tissue | Disease Stage | Target Gene | RSS | Regulon Activity |
| ∗The dot plots of a searched regulon are shown for all cell subpopulations in each disease state of each tissue based on the regulon specific score inferred using pySCENIC and by calculating the average expression. |
| Page: 1 |
Top |
Somatic mutation of malignant transformation related genes |
| Annotation of somatic variants for genes involved in malignant transformation |
| Hugo Symbol | Variant Class | Variant Classification | dbSNP RS | HGVSc | HGVSp | HGVSp Short | SWISSPROT | BIOTYPE | SIFT | PolyPhen | Tumor Sample Barcode | Tissue | Histology | Sex | Age | Stage | Therapy Types | Drugs | Outcome |
| COL9A3 | SNV | Missense_Mutation | novel | c.1048G>C | p.Glu350Gln | p.E350Q | Q14050 | protein_coding | tolerated(0.22) | possibly_damaging(0.87) | TCGA-A8-A06Q-01 | Breast | breast invasive carcinoma | Female | <65 | III/IV | Unknown | Unknown | SD |
| COL9A3 | SNV | Missense_Mutation | c.1469N>C | p.Gly490Ala | p.G490A | Q14050 | protein_coding | deleterious(0.02) | probably_damaging(0.999) | TCGA-A8-A097-01 | Breast | breast invasive carcinoma | Female | >=65 | I/II | Hormone Therapy | tamoxiphen | SD | |
| COL9A3 | SNV | Missense_Mutation | rs760318814 | c.1528N>T | p.Thr510Ser | p.T510S | Q14050 | protein_coding | tolerated(0.21) | benign(0.092) | TCGA-BH-A1F5-01 | Breast | breast invasive carcinoma | Female | <65 | I/II | Unknown | Unknown | SD |
| COL9A3 | SNV | Missense_Mutation | c.1843N>A | p.Glu615Lys | p.E615K | Q14050 | protein_coding | tolerated(1) | benign(0.023) | TCGA-C8-A278-01 | Breast | breast invasive carcinoma | Female | <65 | III/IV | Hormone Therapy | tamoxiphen | SD | |
| COL9A3 | SNV | Missense_Mutation | c.810N>T | p.Arg270Ser | p.R270S | Q14050 | protein_coding | deleterious(0.01) | benign(0.073) | TCGA-E9-A22E-01 | Breast | breast invasive carcinoma | Female | <65 | III/IV | Chemotherapy | cyclophosphane | SD | |
| COL9A3 | insertion | Frame_Shift_Ins | novel | c.1522_1523insA | p.Gly508GlufsTer93 | p.G508Efs*93 | Q14050 | protein_coding | TCGA-AO-A0JB-01 | Breast | breast invasive carcinoma | Female | <65 | III/IV | Chemotherapy | cyclophosphamide | SD | ||
| COL9A3 | insertion | Frame_Shift_Ins | novel | c.1644_1645insT | p.Ala549CysfsTer52 | p.A549Cfs*52 | Q14050 | protein_coding | TCGA-AO-A0JB-01 | Breast | breast invasive carcinoma | Female | <65 | III/IV | Chemotherapy | cyclophosphamide | SD | ||
| COL9A3 | insertion | Nonsense_Mutation | novel | c.1645_1646insGAGTCTGACCTGACCCGGTGCT | p.Ala549GlyfsTer3 | p.A549Gfs*3 | Q14050 | protein_coding | TCGA-AO-A0JB-01 | Breast | breast invasive carcinoma | Female | <65 | III/IV | Chemotherapy | cyclophosphamide | SD | ||
| COL9A3 | SNV | Missense_Mutation | rs531144768 | c.1102N>A | p.Val368Ile | p.V368I | Q14050 | protein_coding | tolerated(1) | benign(0.001) | TCGA-AD-5900-01 | Colorectum | colon adenocarcinoma | Male | >=65 | I/II | Unknown | Unknown | SD |
| COL9A3 | SNV | Missense_Mutation | c.521N>A | p.Cys174Tyr | p.C174Y | Q14050 | protein_coding | deleterious(0) | possibly_damaging(0.854) | TCGA-CK-4951-01 | Colorectum | colon adenocarcinoma | Female | >=65 | I/II | Unknown | Unknown | PD |
| Page: 1 2 3 4 5 6 7 8 9 10 |
Top |
Related drugs of malignant transformation related genes |
| Identification of chemicals and drugs interact with genes involved in malignant transfromation |
| (DGIdb 4.0) |
| Entrez ID | Symbol | Category | Interaction Types | Drug Claim Name | Drug Name | PMIDs |
| Page: 1 |

Copyright 2023-Present -The University of Texas Health Science Center at Houston |