
|
|||||
|
 | |
| |
| |
| |
| |
| |
|
Gene: COL9A2 |
Gene summary for COL9A2 |
| Gene information | Species | Human | Gene symbol | COL9A2 | Gene ID | 1298 |
| Gene name | collagen type IX alpha 2 chain | |
| Gene Alias | DJ39G22.4 | |
| Cytomap | 1p34.2 | |
| Gene Type | protein-coding | GO ID | GO:0001501 | UniProtAcc | Q14055 |
Top |
Malignant transformation analysis |
| Identification of the aberrant gene expression in precancerous and cancerous lesions by comparing the gene expression of stem-like cells in diseased tissues with normal stem cells |
| Entrez ID | Symbol | Replicates | Species | Organ | Tissue | Adj P-value | Log2FC | Malignancy |
| 1298 | COL9A2 | LZE8T | Human | Esophagus | ESCC | 4.41e-02 | 9.86e-02 | 0.067 |
| 1298 | COL9A2 | LZE22D1 | Human | Esophagus | HGIN | 3.26e-02 | 1.32e-01 | 0.0595 |
| 1298 | COL9A2 | LZE22T | Human | Esophagus | ESCC | 1.54e-04 | 2.41e-01 | 0.068 |
| 1298 | COL9A2 | LZE24T | Human | Esophagus | ESCC | 3.17e-06 | 1.67e-01 | 0.0596 |
| 1298 | COL9A2 | P1T-E | Human | Esophagus | ESCC | 7.43e-09 | 3.54e-01 | 0.0875 |
| 1298 | COL9A2 | P2T-E | Human | Esophagus | ESCC | 1.21e-58 | 1.03e+00 | 0.1177 |
| 1298 | COL9A2 | P8T-E | Human | Esophagus | ESCC | 2.87e-11 | 1.81e-01 | 0.0889 |
| 1298 | COL9A2 | P10T-E | Human | Esophagus | ESCC | 1.21e-34 | 5.65e-01 | 0.116 |
| 1298 | COL9A2 | P11T-E | Human | Esophagus | ESCC | 4.74e-03 | 2.11e-01 | 0.1426 |
| 1298 | COL9A2 | P12T-E | Human | Esophagus | ESCC | 2.60e-26 | 5.14e-01 | 0.1122 |
| 1298 | COL9A2 | P15T-E | Human | Esophagus | ESCC | 8.45e-04 | 1.24e-01 | 0.1149 |
| 1298 | COL9A2 | P16T-E | Human | Esophagus | ESCC | 1.37e-54 | 9.22e-01 | 0.1153 |
| 1298 | COL9A2 | P17T-E | Human | Esophagus | ESCC | 2.68e-03 | 2.27e-01 | 0.1278 |
| 1298 | COL9A2 | P20T-E | Human | Esophagus | ESCC | 3.97e-02 | 9.69e-02 | 0.1124 |
| 1298 | COL9A2 | P21T-E | Human | Esophagus | ESCC | 2.16e-02 | 5.09e-02 | 0.1617 |
| 1298 | COL9A2 | P22T-E | Human | Esophagus | ESCC | 1.02e-10 | 1.34e-01 | 0.1236 |
| 1298 | COL9A2 | P23T-E | Human | Esophagus | ESCC | 7.44e-14 | 3.19e-01 | 0.108 |
| 1298 | COL9A2 | P24T-E | Human | Esophagus | ESCC | 6.73e-07 | 1.02e-01 | 0.1287 |
| 1298 | COL9A2 | P26T-E | Human | Esophagus | ESCC | 3.27e-15 | 2.69e-01 | 0.1276 |
| 1298 | COL9A2 | P27T-E | Human | Esophagus | ESCC | 2.99e-22 | 6.96e-01 | 0.1055 |
| Page: 1 2 3 |
| Tissue | Expression Dynamics | Abbreviation |
| Esophagus | 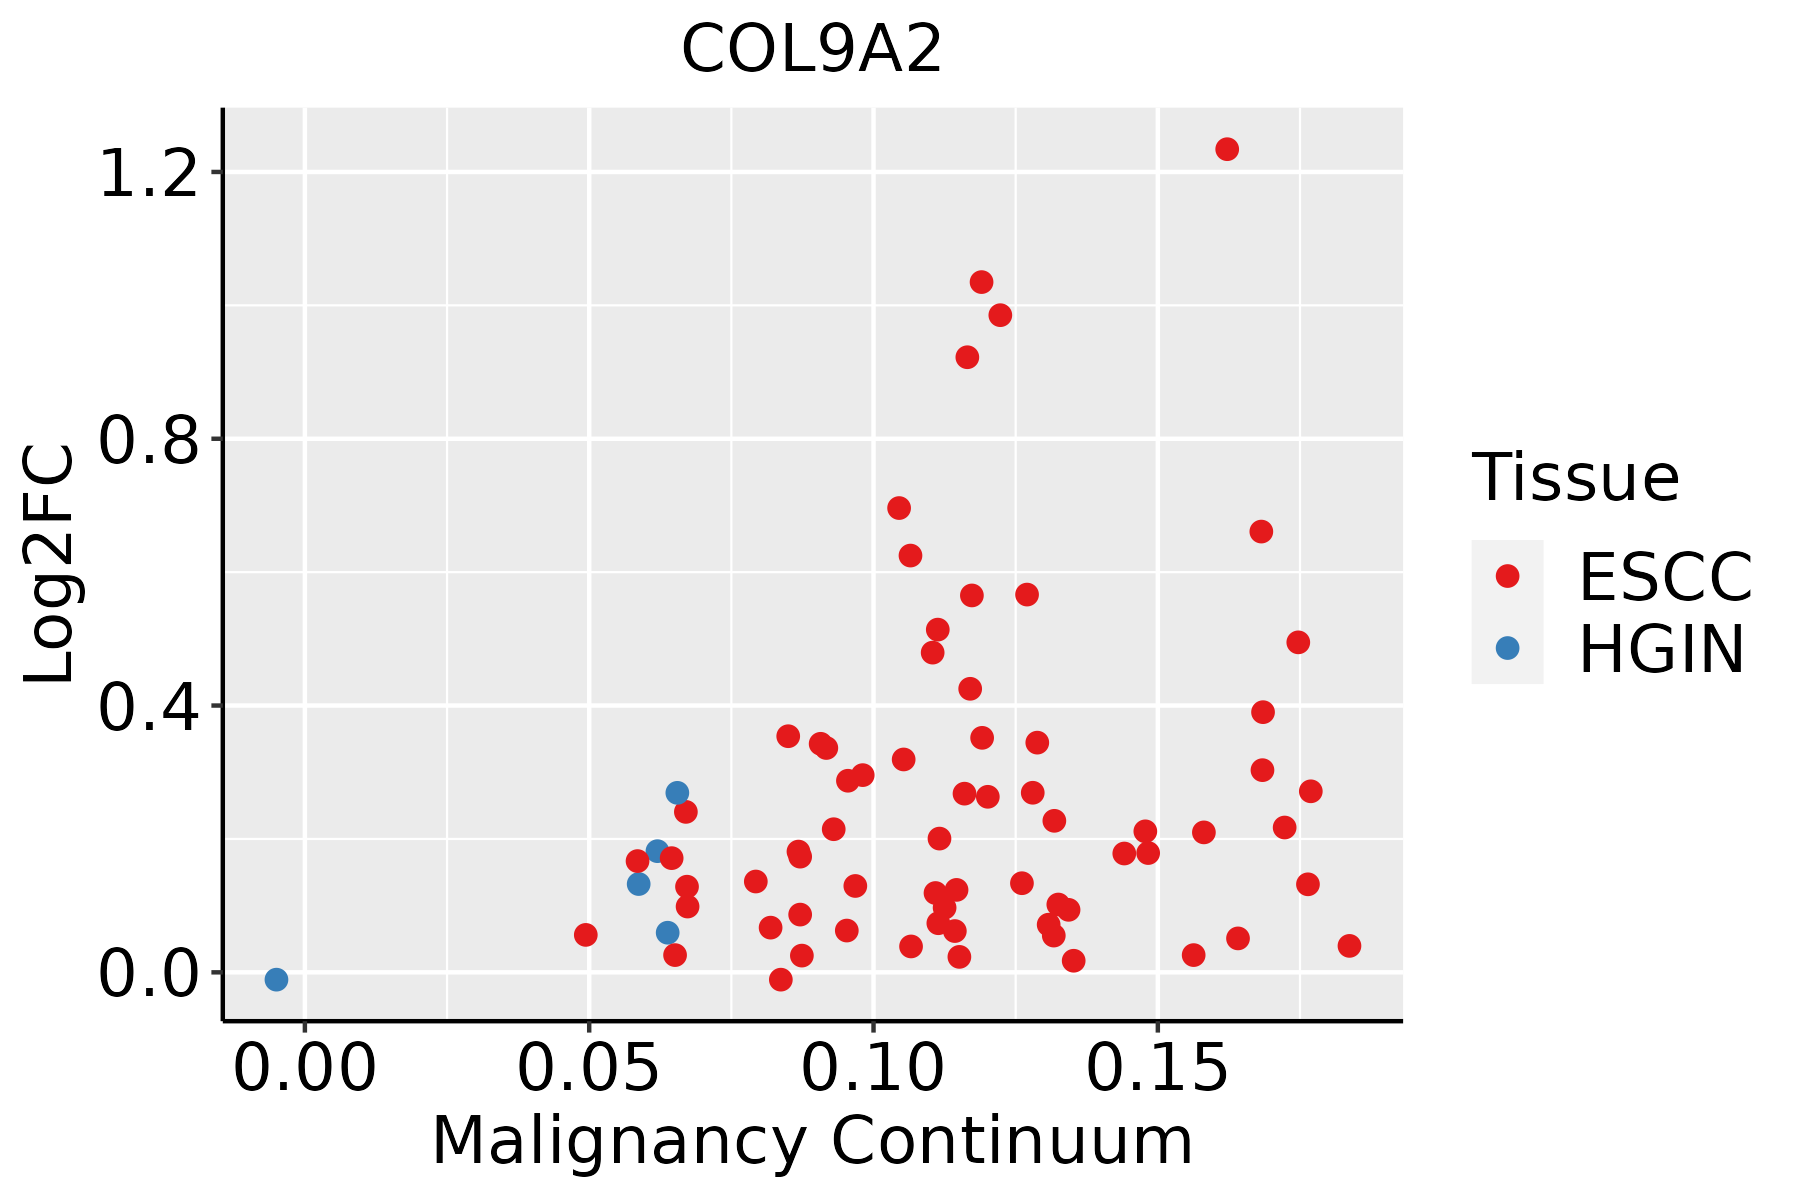 | ESCC: Esophageal squamous cell carcinoma |
| HGIN: High-grade intraepithelial neoplasias | ||
| LGIN: Low-grade intraepithelial neoplasias |
| ∗log2FC in expression of this searched gene in stem-like cells from each diseased tissue sample relative to stem-like cells in normal samples in each tissue plotted against the malignancy continuum. Samples are colored based on if they are from different disease stage. |
Top |
Malignant transformation related pathway analysis |
| Find out the enriched GO biological processes and KEGG pathways involved in transition from healthy to precancer to cancer |
| Tissue | Disease Stage | Enriched GO biological Processes |
| Colorectum | AD |  |
| Colorectum | SER |  |
| Colorectum | MSS |  |
| Colorectum | MSI-H |  |
| Colorectum | FAP |  |
| ∗Top 15 enriched GO BP terms are showed in the bar plot of each disease state in each tissue. Each row represents a significant GO biological process which is colored according to the -log10(p.adjust). |
| Page: 1 2 3 4 5 6 7 8 9 |
| GO ID | Tissue | Disease Stage | Description | Gene Ratio | Bg Ratio | pvalue | p.adjust | Count |
| GO:00301984 | Esophagus | ESCC | extracellular matrix organization | 171/8552 | 301/18723 | 6.08e-05 | 4.67e-04 | 171 |
| GO:00430624 | Esophagus | ESCC | extracellular structure organization | 171/8552 | 302/18723 | 7.73e-05 | 5.76e-04 | 171 |
| GO:00452294 | Esophagus | ESCC | external encapsulating structure organization | 172/8552 | 304/18723 | 7.80e-05 | 5.80e-04 | 172 |
| Page: 1 |
| Pathway ID | Tissue | Disease Stage | Description | Gene Ratio | Bg Ratio | pvalue | p.adjust | qvalue | Count |
| hsa0516510 | Esophagus | ESCC | Human papillomavirus infection | 215/4205 | 331/8465 | 7.86e-09 | 7.12e-08 | 3.65e-08 | 215 |
| hsa0451020 | Esophagus | ESCC | Focal adhesion | 127/4205 | 203/8465 | 1.25e-04 | 4.99e-04 | 2.56e-04 | 127 |
| hsa041517 | Esophagus | ESCC | PI3K-Akt signaling pathway | 197/4205 | 354/8465 | 1.24e-02 | 2.83e-02 | 1.45e-02 | 197 |
| hsa0516515 | Esophagus | ESCC | Human papillomavirus infection | 215/4205 | 331/8465 | 7.86e-09 | 7.12e-08 | 3.65e-08 | 215 |
| hsa04510111 | Esophagus | ESCC | Focal adhesion | 127/4205 | 203/8465 | 1.25e-04 | 4.99e-04 | 2.56e-04 | 127 |
| hsa0415114 | Esophagus | ESCC | PI3K-Akt signaling pathway | 197/4205 | 354/8465 | 1.24e-02 | 2.83e-02 | 1.45e-02 | 197 |
| Page: 1 |
Top |
Cell-cell communication analysis |
| Identification of potential cell-cell interactions between two cell types and their ligand-receptor pairs for different disease states |
| Ligand | Receptor | LRpair | Pathway | Tissue | Disease Stage |
| COL9A2 | ITGA1_ITGB1 | COL9A2_ITGA1_ITGB1 | COLLAGEN | Cervix | CC |
| COL9A2 | ITGA2_ITGB1 | COL9A2_ITGA2_ITGB1 | COLLAGEN | Cervix | CC |
| COL9A2 | ITGA3_ITGB1 | COL9A2_ITGA3_ITGB1 | COLLAGEN | Cervix | CC |
| COL9A2 | ITGA9_ITGB1 | COL9A2_ITGA9_ITGB1 | COLLAGEN | Cervix | CC |
| COL9A2 | ITGA11_ITGB1 | COL9A2_ITGA11_ITGB1 | COLLAGEN | Cervix | CC |
| COL9A2 | ITGAV_ITGB8 | COL9A2_ITGAV_ITGB8 | COLLAGEN | Cervix | CC |
| COL9A2 | CD44 | COL9A2_CD44 | COLLAGEN | Cervix | CC |
| COL9A2 | SDC1 | COL9A2_SDC1 | COLLAGEN | Cervix | CC |
| COL9A2 | SDC4 | COL9A2_SDC4 | COLLAGEN | Cervix | CC |
| COL9A2 | ITGA1_ITGB1 | COL9A2_ITGA1_ITGB1 | COLLAGEN | THCA | ADJ |
| COL9A2 | ITGA3_ITGB1 | COL9A2_ITGA3_ITGB1 | COLLAGEN | THCA | ADJ |
| COL9A2 | ITGA9_ITGB1 | COL9A2_ITGA9_ITGB1 | COLLAGEN | THCA | ADJ |
| COL9A2 | ITGA10_ITGB1 | COL9A2_ITGA10_ITGB1 | COLLAGEN | THCA | ADJ |
| COL9A2 | ITGA11_ITGB1 | COL9A2_ITGA11_ITGB1 | COLLAGEN | THCA | ADJ |
| COL9A2 | CD44 | COL9A2_CD44 | COLLAGEN | THCA | ADJ |
| COL9A2 | SDC4 | COL9A2_SDC4 | COLLAGEN | THCA | ADJ |
| COL9A2 | ITGA1_ITGB1 | COL9A2_ITGA1_ITGB1 | COLLAGEN | THCA | Cancer |
| COL9A2 | ITGA2_ITGB1 | COL9A2_ITGA2_ITGB1 | COLLAGEN | THCA | Cancer |
| COL9A2 | ITGA3_ITGB1 | COL9A2_ITGA3_ITGB1 | COLLAGEN | THCA | Cancer |
| COL9A2 | ITGA9_ITGB1 | COL9A2_ITGA9_ITGB1 | COLLAGEN | THCA | Cancer |
| Page: 1 2 |
Top |
Single-cell gene regulatory network inference analysis |
| Find out the significant the regulons (TFs) and the target genes of each regulon across cell types for different disease states |
| TF | Cell Type | Tissue | Disease Stage | Target Gene | RSS | Regulon Activity |
| ∗The dot plots of a searched regulon are shown for all cell subpopulations in each disease state of each tissue based on the regulon specific score inferred using pySCENIC and by calculating the average expression. |
| Page: 1 |
Top |
Somatic mutation of malignant transformation related genes |
| Annotation of somatic variants for genes involved in malignant transformation |
| Hugo Symbol | Variant Class | Variant Classification | dbSNP RS | HGVSc | HGVSp | HGVSp Short | SWISSPROT | BIOTYPE | SIFT | PolyPhen | Tumor Sample Barcode | Tissue | Histology | Sex | Age | Stage | Therapy Types | Drugs | Outcome |
| COL9A2 | SNV | Missense_Mutation | c.559N>T | p.Gly187Trp | p.G187W | Q14055 | protein_coding | deleterious(0) | probably_damaging(1) | TCGA-A1-A0SP-01 | Breast | breast invasive carcinoma | Female | <65 | I/II | Chemotherapy | SD | ||
| COL9A2 | SNV | Missense_Mutation | c.670N>T | p.Ile224Phe | p.I224F | Q14055 | protein_coding | deleterious(0.02) | probably_damaging(0.996) | TCGA-E9-A244-01 | Breast | breast invasive carcinoma | Female | <65 | I/II | Chemotherapy | cyclophosphamide | SD | |
| COL9A2 | SNV | Missense_Mutation | rs768840439 | c.1903G>A | p.Gly635Ser | p.G635S | Q14055 | protein_coding | deleterious(0.02) | probably_damaging(1) | TCGA-2W-A8YY-01 | Cervix | cervical & endocervical cancer | Female | <65 | I/II | Chemotherapy | cisplatin | CR |
| COL9A2 | SNV | Missense_Mutation | rs868625575 | c.1816C>T | p.Pro606Ser | p.P606S | Q14055 | protein_coding | deleterious(0.01) | possibly_damaging(0.656) | TCGA-2W-A8YY-01 | Cervix | cervical & endocervical cancer | Female | <65 | I/II | Chemotherapy | cisplatin | CR |
| COL9A2 | SNV | Missense_Mutation | rs779917331 | c.1652C>T | p.Ala551Val | p.A551V | Q14055 | protein_coding | tolerated(0.17) | possibly_damaging(0.874) | TCGA-AA-3510-01 | Colorectum | colon adenocarcinoma | Male | >=65 | I/II | Unknown | Unknown | SD |
| COL9A2 | SNV | Missense_Mutation | rs754945201 | c.1637G>A | p.Arg546Gln | p.R546Q | Q14055 | protein_coding | deleterious(0) | possibly_damaging(0.884) | TCGA-AY-5543-01 | Colorectum | colon adenocarcinoma | Female | >=65 | I/II | Chemotherapy | oxaliplatin | SD |
| COL9A2 | SNV | Missense_Mutation | rs763798270 | c.455N>A | p.Gly152Glu | p.G152E | Q14055 | protein_coding | deleterious(0) | possibly_damaging(0.658) | TCGA-CA-6718-01 | Colorectum | colon adenocarcinoma | Male | <65 | I/II | Unknown | Unknown | PD |
| COL9A2 | SNV | Missense_Mutation | rs772278003 | c.1636C>T | p.Arg546Trp | p.R546W | Q14055 | protein_coding | deleterious(0) | probably_damaging(0.982) | TCGA-CM-4746-01 | Colorectum | colon adenocarcinoma | Male | <65 | I/II | Unknown | Unknown | SD |
| COL9A2 | SNV | Missense_Mutation | rs200949058 | c.1553G>A | p.Arg518Gln | p.R518Q | Q14055 | protein_coding | deleterious(0.01) | probably_damaging(0.936) | TCGA-D5-6539-01 | Colorectum | colon adenocarcinoma | Female | <65 | I/II | Unknown | Unknown | SD |
| COL9A2 | SNV | Missense_Mutation | c.1144G>T | p.Gly382Cys | p.G382C | Q14055 | protein_coding | deleterious(0) | probably_damaging(1) | TCGA-DM-A1HB-01 | Colorectum | colon adenocarcinoma | Male | >=65 | III/IV | Unknown | Unknown | SD |
| Page: 1 2 3 4 5 6 7 8 |
Top |
Related drugs of malignant transformation related genes |
| Identification of chemicals and drugs interact with genes involved in malignant transfromation |
| (DGIdb 4.0) |
| Entrez ID | Symbol | Category | Interaction Types | Drug Claim Name | Drug Name | PMIDs |
| Page: 1 |

Copyright 2023-Present -The University of Texas Health Science Center at Houston |