
|
|||||
|
 | |
| |
| |
| |
| |
| |
|
Gene: COL8A1 |
Gene summary for COL8A1 |
| Gene information | Species | Human | Gene symbol | COL8A1 | Gene ID | 1295 |
| Gene name | collagen type VIII alpha 1 chain | |
| Gene Alias | C3orf7 | |
| Cytomap | 3q12.1 | |
| Gene Type | protein-coding | GO ID | GO:0001525 | UniProtAcc | P27658 |
Top |
Malignant transformation analysis |
| Identification of the aberrant gene expression in precancerous and cancerous lesions by comparing the gene expression of stem-like cells in diseased tissues with normal stem cells |
| Entrez ID | Symbol | Replicates | Species | Organ | Tissue | Adj P-value | Log2FC | Malignancy |
| 1295 | COL8A1 | P4T-E | Human | Esophagus | ESCC | 4.84e-08 | 1.01e+00 | 0.1323 |
| 1295 | COL8A1 | P9T-E | Human | Esophagus | ESCC | 8.26e-05 | 9.03e-01 | 0.1131 |
| 1295 | COL8A1 | P11T-E | Human | Esophagus | ESCC | 5.26e-14 | 2.50e+00 | 0.1426 |
| 1295 | COL8A1 | P19T-E | Human | Esophagus | ESCC | 3.99e-09 | 2.91e+00 | 0.1662 |
| 1295 | COL8A1 | P24T-E | Human | Esophagus | ESCC | 1.32e-02 | 9.58e-01 | 0.1287 |
| 1295 | COL8A1 | P32T-E | Human | Esophagus | ESCC | 1.60e-09 | 1.73e+00 | 0.1666 |
| 1295 | COL8A1 | P37T-E | Human | Esophagus | ESCC | 1.37e-19 | 8.00e-01 | 0.1371 |
| 1295 | COL8A1 | P42T-E | Human | Esophagus | ESCC | 8.42e-03 | 1.20e+00 | 0.1175 |
| 1295 | COL8A1 | P44T-E | Human | Esophagus | ESCC | 2.72e-11 | 1.39e+00 | 0.1096 |
| 1295 | COL8A1 | P56T-E | Human | Esophagus | ESCC | 1.66e-13 | 3.48e+00 | 0.1613 |
| 1295 | COL8A1 | P76T-E | Human | Esophagus | ESCC | 2.87e-57 | 2.24e+00 | 0.1207 |
| 1295 | COL8A1 | RNA-P25T1-P25T1-1 | Human | Lung | AIS | 3.17e-03 | 6.30e-01 | -0.2116 |
| 1295 | COL8A1 | RNA-P25T1-P25T1-4 | Human | Lung | AIS | 2.12e-03 | 6.78e-01 | -0.2119 |
| 1295 | COL8A1 | RNA-P6T2-P6T2-1 | Human | Lung | IAC | 8.76e-09 | 4.72e-01 | -0.0166 |
| 1295 | COL8A1 | RNA-P6T2-P6T2-2 | Human | Lung | IAC | 1.28e-14 | 5.39e-01 | -0.0132 |
| 1295 | COL8A1 | RNA-P6T2-P6T2-3 | Human | Lung | IAC | 7.67e-11 | 4.17e-01 | -0.013 |
| 1295 | COL8A1 | RNA-P6T2-P6T2-4 | Human | Lung | IAC | 3.00e-09 | 4.26e-01 | -0.0121 |
| 1295 | COL8A1 | RNA-P7T1-P7T1-1 | Human | Lung | AIS | 3.32e-05 | 7.59e-01 | -0.0961 |
| 1295 | COL8A1 | RNA-P7T1-P7T1-2 | Human | Lung | AIS | 3.07e-07 | 8.30e-01 | -0.0876 |
| 1295 | COL8A1 | RNA-P7T1-P7T1-3 | Human | Lung | AIS | 1.60e-03 | 7.33e-01 | -0.0822 |
| Page: 1 2 |
| Tissue | Expression Dynamics | Abbreviation |
| Esophagus |  | ESCC: Esophageal squamous cell carcinoma |
| HGIN: High-grade intraepithelial neoplasias | ||
| LGIN: Low-grade intraepithelial neoplasias | ||
| Lung | 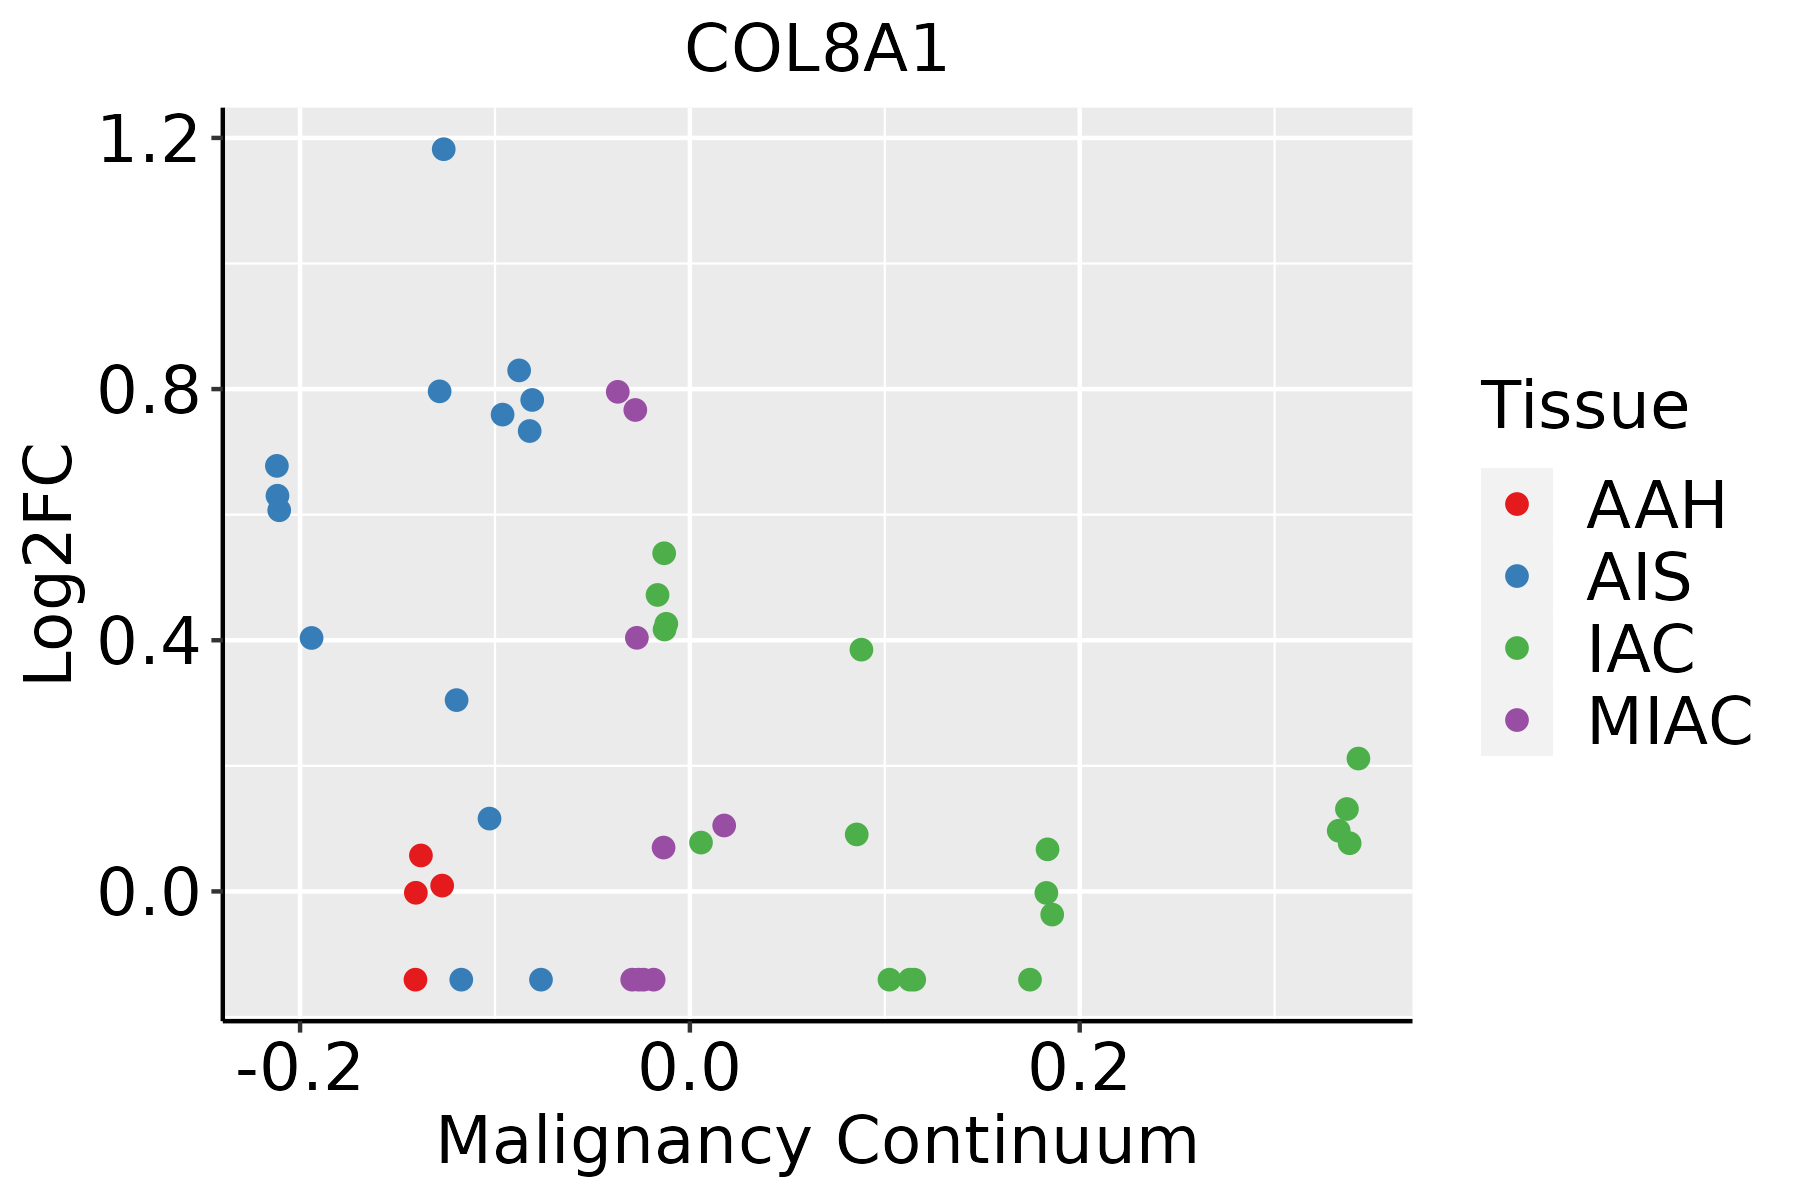 | AAH: Atypical adenomatous hyperplasia |
| AIS: Adenocarcinoma in situ | ||
| IAC: Invasive lung adenocarcinoma | ||
| MIA: Minimally invasive adenocarcinoma | ||
| Thyroid |  | ATC: Anaplastic thyroid cancer |
| HT: Hashimoto's thyroiditis | ||
| PTC: Papillary thyroid cancer |
| ∗log2FC in expression of this searched gene in stem-like cells from each diseased tissue sample relative to stem-like cells in normal samples in each tissue plotted against the malignancy continuum. Samples are colored based on if they are from different disease stage. |
Top |
Malignant transformation related pathway analysis |
| Find out the enriched GO biological processes and KEGG pathways involved in transition from healthy to precancer to cancer |
| Tissue | Disease Stage | Enriched GO biological Processes |
| Colorectum | AD |  |
| Colorectum | SER |  |
| Colorectum | MSS |  |
| Colorectum | MSI-H |  |
| Colorectum | FAP |  |
| ∗Top 15 enriched GO BP terms are showed in the bar plot of each disease state in each tissue. Each row represents a significant GO biological process which is colored according to the -log10(p.adjust). |
| Page: 1 2 3 4 5 6 7 8 9 |
| GO ID | Tissue | Disease Stage | Description | Gene Ratio | Bg Ratio | pvalue | p.adjust | Count |
| GO:003158919 | Esophagus | ESCC | cell-substrate adhesion | 221/8552 | 363/18723 | 3.06e-09 | 6.62e-08 | 221 |
| GO:001081020 | Esophagus | ESCC | regulation of cell-substrate adhesion | 144/8552 | 221/18723 | 3.55e-09 | 7.45e-08 | 144 |
| GO:004578527 | Esophagus | ESCC | positive regulation of cell adhesion | 255/8552 | 437/18723 | 5.07e-08 | 9.11e-07 | 255 |
| GO:001081126 | Esophagus | ESCC | positive regulation of cell-substrate adhesion | 84/8552 | 123/18723 | 3.18e-07 | 4.50e-06 | 84 |
| GO:00073698 | Esophagus | ESCC | gastrulation | 115/8552 | 185/18723 | 4.35e-06 | 4.64e-05 | 115 |
| GO:00074926 | Esophagus | ESCC | endoderm development | 54/8552 | 77/18723 | 1.20e-05 | 1.12e-04 | 54 |
| GO:00301984 | Esophagus | ESCC | extracellular matrix organization | 171/8552 | 301/18723 | 6.08e-05 | 4.67e-04 | 171 |
| GO:00430624 | Esophagus | ESCC | extracellular structure organization | 171/8552 | 302/18723 | 7.73e-05 | 5.76e-04 | 171 |
| GO:00452294 | Esophagus | ESCC | external encapsulating structure organization | 172/8552 | 304/18723 | 7.80e-05 | 5.80e-04 | 172 |
| GO:005067318 | Esophagus | ESCC | epithelial cell proliferation | 238/8552 | 437/18723 | 1.19e-04 | 8.20e-04 | 238 |
| GO:00017064 | Esophagus | ESCC | endoderm formation | 38/8552 | 54/18723 | 2.08e-04 | 1.31e-03 | 38 |
| GO:00017044 | Esophagus | ESCC | formation of primary germ layer | 75/8552 | 121/18723 | 2.17e-04 | 1.36e-03 | 75 |
| GO:00359873 | Esophagus | ESCC | endodermal cell differentiation | 32/8552 | 45/18723 | 4.87e-04 | 2.70e-03 | 32 |
| GO:00315897 | Lung | IAC | cell-substrate adhesion | 85/2061 | 363/18723 | 8.57e-12 | 4.27e-09 | 85 |
| GO:00108108 | Lung | IAC | regulation of cell-substrate adhesion | 57/2061 | 221/18723 | 5.09e-10 | 1.04e-07 | 57 |
| GO:00457858 | Lung | IAC | positive regulation of cell adhesion | 87/2061 | 437/18723 | 2.59e-08 | 3.13e-06 | 87 |
| GO:00108118 | Lung | IAC | positive regulation of cell-substrate adhesion | 29/2061 | 123/18723 | 5.35e-05 | 1.21e-03 | 29 |
| GO:00506735 | Lung | IAC | epithelial cell proliferation | 68/2061 | 437/18723 | 2.05e-03 | 2.05e-02 | 68 |
| GO:003158913 | Lung | AIS | cell-substrate adhesion | 80/1849 | 363/18723 | 3.80e-12 | 3.16e-09 | 80 |
| GO:001081013 | Lung | AIS | regulation of cell-substrate adhesion | 55/1849 | 221/18723 | 7.48e-11 | 2.49e-08 | 55 |
| Page: 1 2 3 |
| Pathway ID | Tissue | Disease Stage | Description | Gene Ratio | Bg Ratio | pvalue | p.adjust | qvalue | Count |
| Page: 1 |
Top |
Cell-cell communication analysis |
| Identification of potential cell-cell interactions between two cell types and their ligand-receptor pairs for different disease states |
| Ligand | Receptor | LRpair | Pathway | Tissue | Disease Stage |
| Page: 1 |
Top |
Single-cell gene regulatory network inference analysis |
| Find out the significant the regulons (TFs) and the target genes of each regulon across cell types for different disease states |
| TF | Cell Type | Tissue | Disease Stage | Target Gene | RSS | Regulon Activity |
| ∗The dot plots of a searched regulon are shown for all cell subpopulations in each disease state of each tissue based on the regulon specific score inferred using pySCENIC and by calculating the average expression. |
| Page: 1 |
Top |
Somatic mutation of malignant transformation related genes |
| Annotation of somatic variants for genes involved in malignant transformation |
| Hugo Symbol | Variant Class | Variant Classification | dbSNP RS | HGVSc | HGVSp | HGVSp Short | SWISSPROT | BIOTYPE | SIFT | PolyPhen | Tumor Sample Barcode | Tissue | Histology | Sex | Age | Stage | Therapy Types | Drugs | Outcome |
| COL8A1 | SNV | Missense_Mutation | c.1562C>T | p.Pro521Leu | p.P521L | P27658 | protein_coding | deleterious(0.05) | benign(0.017) | TCGA-BH-A1EV-01 | Breast | breast invasive carcinoma | Female | <65 | III/IV | Unknown | Unknown | PD | |
| COL8A1 | SNV | Missense_Mutation | rs375350800 | c.2068N>A | p.Asp690Asn | p.D690N | P27658 | protein_coding | deleterious(0) | benign(0.135) | TCGA-D8-A1XQ-01 | Breast | breast invasive carcinoma | Female | >=65 | I/II | Unknown | Unknown | SD |
| COL8A1 | SNV | Missense_Mutation | c.1187N>T | p.Gly396Val | p.G396V | P27658 | protein_coding | deleterious(0) | probably_damaging(0.999) | TCGA-D8-A27G-01 | Breast | breast invasive carcinoma | Female | >=65 | I/II | Unknown | Unknown | SD | |
| COL8A1 | SNV | Missense_Mutation | novel | c.547N>A | p.Gln183Lys | p.Q183K | P27658 | protein_coding | tolerated(0.13) | benign(0.005) | TCGA-E2-A15I-01 | Breast | breast invasive carcinoma | Female | <65 | I/II | Hormone Therapy | tamoxiphen | SD |
| COL8A1 | SNV | Missense_Mutation | c.482N>T | p.Gly161Val | p.G161V | P27658 | protein_coding | deleterious(0) | probably_damaging(1) | TCGA-E2-A15J-01 | Breast | breast invasive carcinoma | Female | <65 | I/II | Chemotherapy | docetaxel | SD | |
| COL8A1 | deletion | Frame_Shift_Del | c.1789delN | p.His599MetfsTer24 | p.H599Mfs*24 | P27658 | protein_coding | TCGA-AN-A0AK-01 | Breast | breast invasive carcinoma | Female | >=65 | I/II | Unknown | Unknown | SD | |||
| COL8A1 | insertion | Frame_Shift_Ins | novel | c.2196_2197insACTTTGCATACCACGTTCACTGCAAGGGGGG | p.His733ThrfsTer41 | p.H733Tfs*41 | P27658 | protein_coding | TCGA-AN-A0FX-01 | Breast | breast invasive carcinoma | Female | <65 | I/II | Unknown | Unknown | SD | ||
| COL8A1 | insertion | Frame_Shift_Ins | novel | c.924_925insAT | p.Pro309IlefsTer73 | p.P309Ifs*73 | P27658 | protein_coding | TCGA-AQ-A04J-01 | Breast | breast invasive carcinoma | Female | <65 | I/II | Chemotherapy | cytoxan | SD | ||
| COL8A1 | insertion | Frame_Shift_Ins | novel | c.925_926insTACTAATCAATCTCTCTCTCTCCCCCCATACCCCTTCTCT | p.Pro309LeufsTer66 | p.P309Lfs*66 | P27658 | protein_coding | TCGA-AQ-A04J-01 | Breast | breast invasive carcinoma | Female | <65 | I/II | Chemotherapy | cytoxan | SD | ||
| COL8A1 | deletion | Frame_Shift_Del | novel | c.361delN | p.Gly121ValfsTer133 | p.G121Vfs*133 | P27658 | protein_coding | TCGA-D8-A27V-01 | Breast | breast invasive carcinoma | Female | <65 | I/II | Hormone Therapy | tamoxiphen | SD |
| Page: 1 2 3 4 5 6 7 8 9 10 11 12 13 |
Top |
Related drugs of malignant transformation related genes |
| Identification of chemicals and drugs interact with genes involved in malignant transfromation |
| (DGIdb 4.0) |
| Entrez ID | Symbol | Category | Interaction Types | Drug Claim Name | Drug Name | PMIDs |
| Page: 1 |

Copyright 2023-Present -The University of Texas Health Science Center at Houston |