| Tissue | Expression Dynamics | Abbreviation |
| Endometrium |  | AEH: Atypical endometrial hyperplasia |
| EEC: Endometrioid Cancer |
| Esophagus | 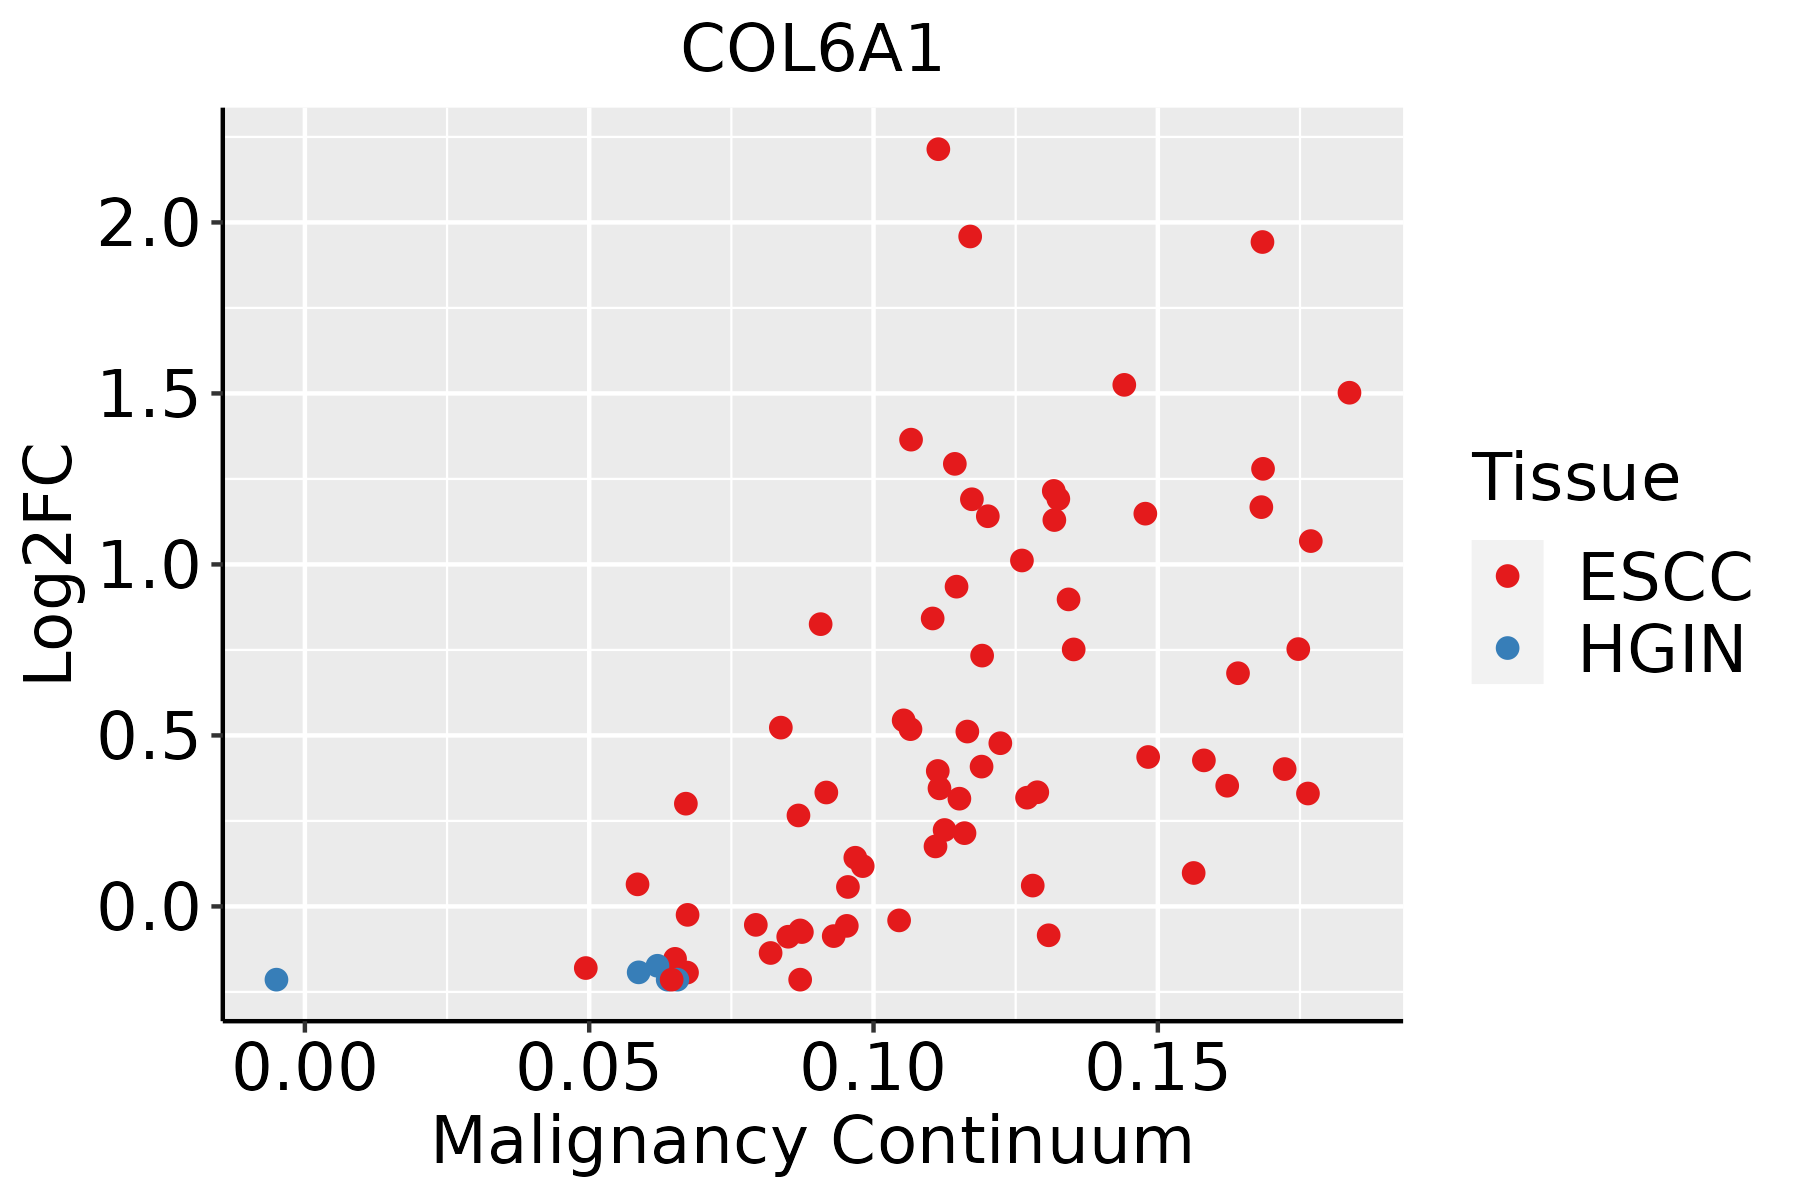 | ESCC: Esophageal squamous cell carcinoma |
| HGIN: High-grade intraepithelial neoplasias |
| LGIN: Low-grade intraepithelial neoplasias |
| Liver |  | HCC: Hepatocellular carcinoma |
| NAFLD: Non-alcoholic fatty liver disease |
| Oral Cavity |  | EOLP: Erosive Oral lichen planus |
| LP: leukoplakia |
| NEOLP: Non-erosive oral lichen planus |
| OSCC: Oral squamous cell carcinoma |
| Skin | 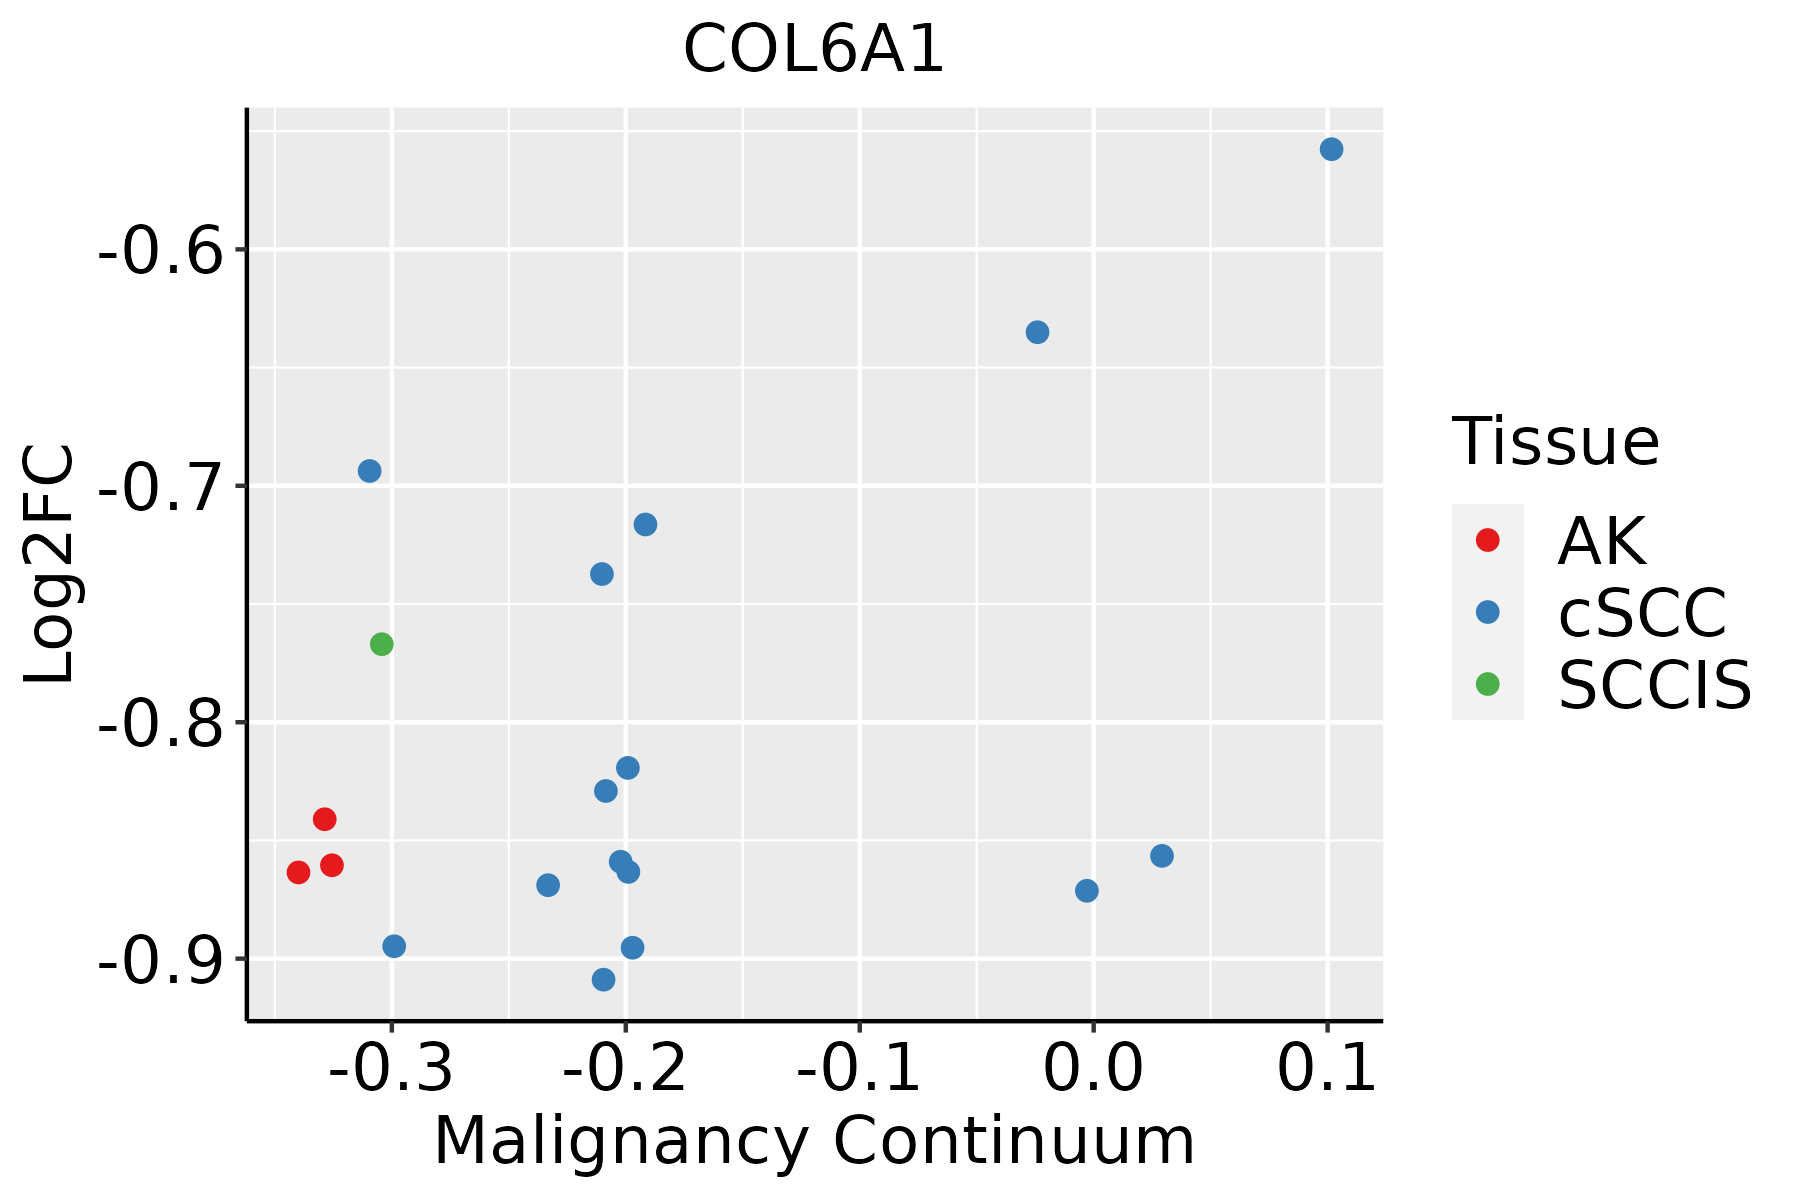 | AK: Actinic keratosis |
| cSCC: Cutaneous squamous cell carcinoma |
| SCCIS:squamous cell carcinoma in situ |
| Thyroid | 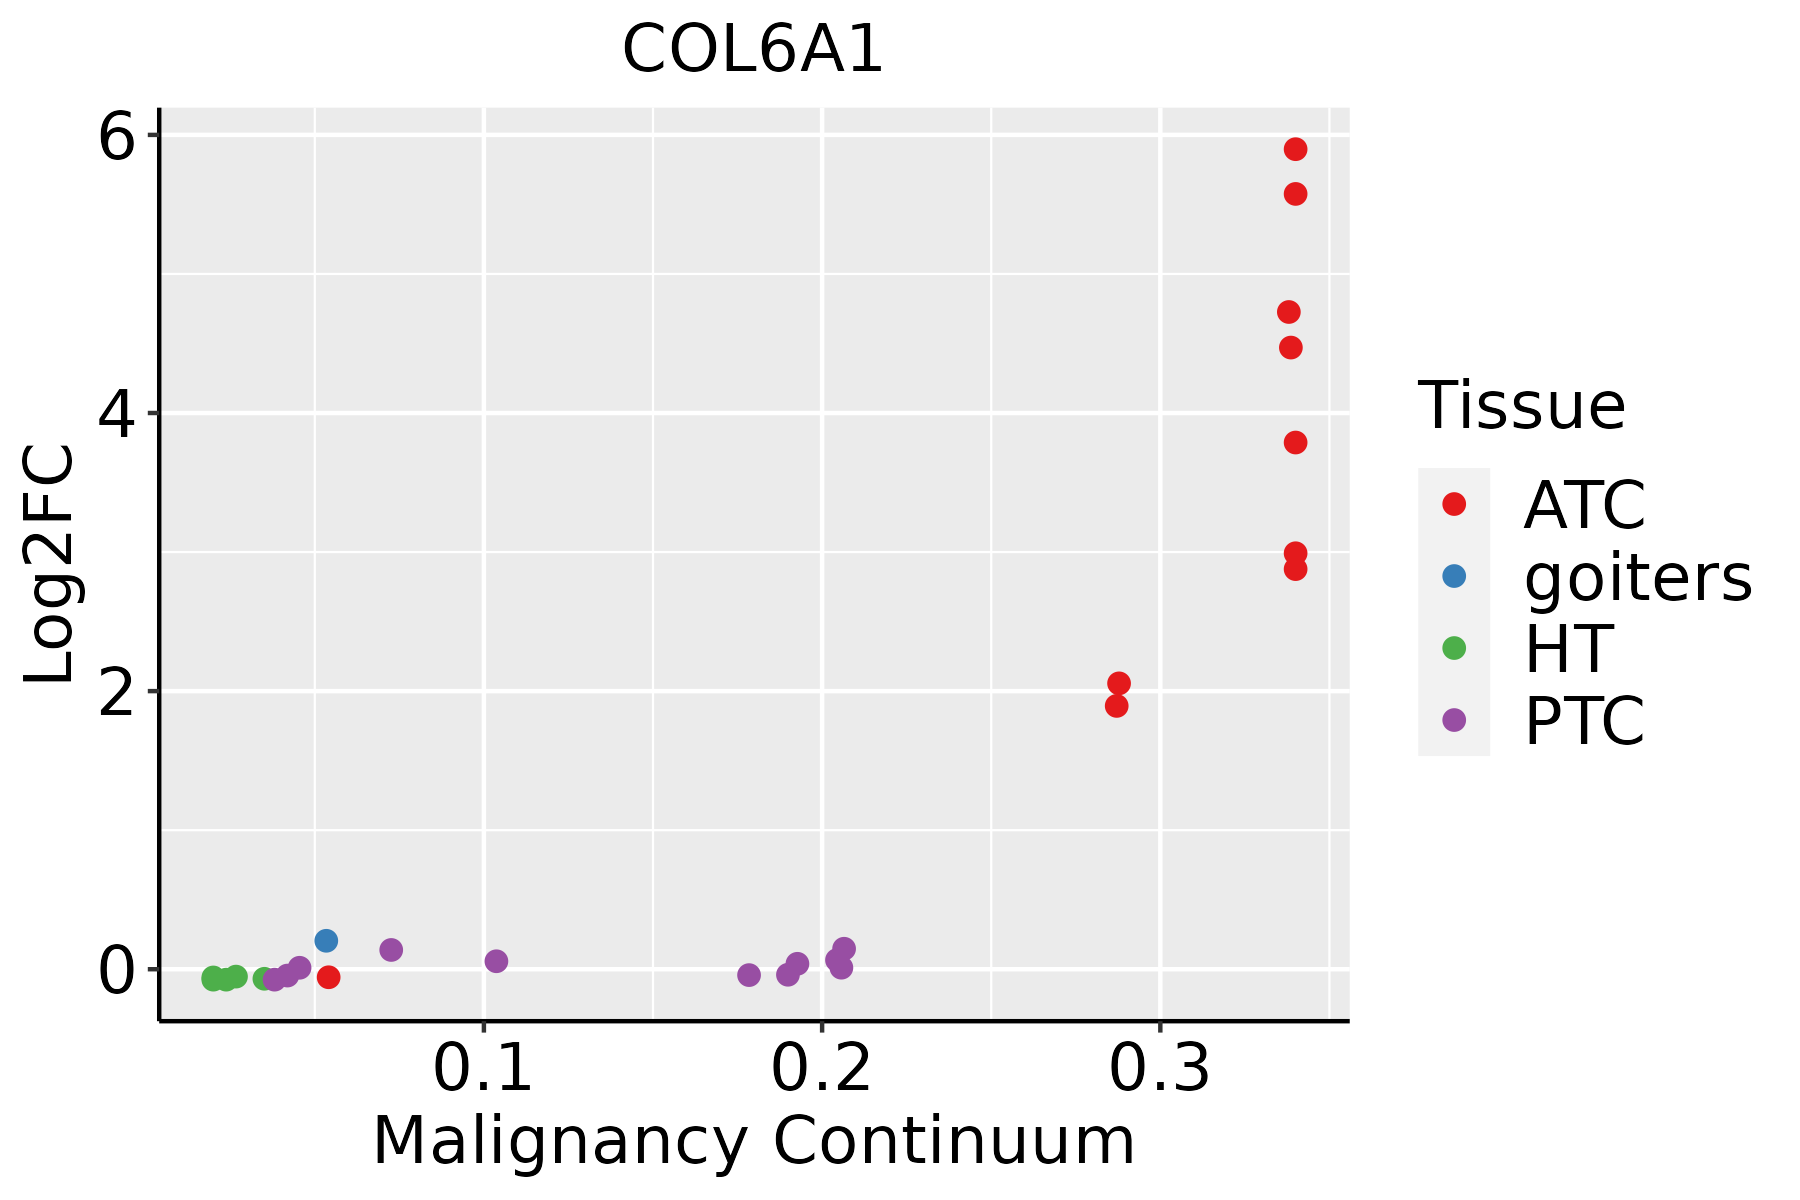 | ATC: Anaplastic thyroid cancer |
| HT: Hashimoto's thyroiditis |
| PTC: Papillary thyroid cancer |
| GO ID | Tissue | Disease Stage | Description | Gene Ratio | Bg Ratio | pvalue | p.adjust | Count |
| GO:00016498 | Endometrium | AEH | osteoblast differentiation | 52/2100 | 229/18723 | 4.74e-07 | 1.92e-05 | 52 |
| GO:00015038 | Endometrium | AEH | ossification | 78/2100 | 408/18723 | 1.54e-06 | 4.85e-05 | 78 |
| GO:00011017 | Endometrium | AEH | response to acid chemical | 28/2100 | 135/18723 | 9.24e-04 | 8.43e-03 | 28 |
| GO:00432005 | Endometrium | AEH | response to amino acid | 24/2100 | 116/18723 | 2.14e-03 | 1.65e-02 | 24 |
| GO:00712302 | Endometrium | AEH | cellular response to amino acid stimulus | 16/2100 | 71/18723 | 4.68e-03 | 2.99e-02 | 16 |
| GO:00712293 | Endometrium | AEH | cellular response to acid chemical | 17/2100 | 80/18723 | 6.76e-03 | 3.94e-02 | 17 |
| GO:000164914 | Endometrium | EEC | osteoblast differentiation | 53/2168 | 229/18723 | 5.32e-07 | 2.02e-05 | 53 |
| GO:000150313 | Endometrium | EEC | ossification | 79/2168 | 408/18723 | 2.72e-06 | 7.67e-05 | 79 |
| GO:000110113 | Endometrium | EEC | response to acid chemical | 29/2168 | 135/18723 | 6.98e-04 | 6.68e-03 | 29 |
| GO:004320012 | Endometrium | EEC | response to amino acid | 25/2168 | 116/18723 | 1.50e-03 | 1.21e-02 | 25 |
| GO:007123011 | Endometrium | EEC | cellular response to amino acid stimulus | 17/2168 | 71/18723 | 2.57e-03 | 1.86e-02 | 17 |
| GO:007122911 | Endometrium | EEC | cellular response to acid chemical | 18/2168 | 80/18723 | 4.02e-03 | 2.66e-02 | 18 |
| GO:000164918 | Esophagus | ESCC | osteoblast differentiation | 140/8552 | 229/18723 | 1.63e-06 | 1.95e-05 | 140 |
| GO:000150317 | Esophagus | ESCC | ossification | 232/8552 | 408/18723 | 3.00e-06 | 3.40e-05 | 232 |
| GO:00073698 | Esophagus | ESCC | gastrulation | 115/8552 | 185/18723 | 4.35e-06 | 4.64e-05 | 115 |
| GO:00074926 | Esophagus | ESCC | endoderm development | 54/8552 | 77/18723 | 1.20e-05 | 1.12e-04 | 54 |
| GO:00432007 | Esophagus | ESCC | response to amino acid | 74/8552 | 116/18723 | 6.23e-05 | 4.76e-04 | 74 |
| GO:000110110 | Esophagus | ESCC | response to acid chemical | 84/8552 | 135/18723 | 7.70e-05 | 5.74e-04 | 84 |
| GO:00712305 | Esophagus | ESCC | cellular response to amino acid stimulus | 48/8552 | 71/18723 | 1.55e-04 | 1.03e-03 | 48 |
| GO:00017064 | Esophagus | ESCC | endoderm formation | 38/8552 | 54/18723 | 2.08e-04 | 1.31e-03 | 38 |
| Pathway ID | Tissue | Disease Stage | Description | Gene Ratio | Bg Ratio | pvalue | p.adjust | qvalue | Count |
| hsa0451015 | Endometrium | AEH | Focal adhesion | 58/1197 | 203/8465 | 4.99e-08 | 7.37e-07 | 5.39e-07 | 58 |
| hsa0451016 | Endometrium | AEH | Focal adhesion | 58/1197 | 203/8465 | 4.99e-08 | 7.37e-07 | 5.39e-07 | 58 |
| hsa0451024 | Endometrium | EEC | Focal adhesion | 58/1237 | 203/8465 | 1.61e-07 | 2.30e-06 | 1.71e-06 | 58 |
| hsa0451034 | Endometrium | EEC | Focal adhesion | 58/1237 | 203/8465 | 1.61e-07 | 2.30e-06 | 1.71e-06 | 58 |
| hsa0516510 | Esophagus | ESCC | Human papillomavirus infection | 215/4205 | 331/8465 | 7.86e-09 | 7.12e-08 | 3.65e-08 | 215 |
| hsa0451020 | Esophagus | ESCC | Focal adhesion | 127/4205 | 203/8465 | 1.25e-04 | 4.99e-04 | 2.56e-04 | 127 |
| hsa041517 | Esophagus | ESCC | PI3K-Akt signaling pathway | 197/4205 | 354/8465 | 1.24e-02 | 2.83e-02 | 1.45e-02 | 197 |
| hsa0516515 | Esophagus | ESCC | Human papillomavirus infection | 215/4205 | 331/8465 | 7.86e-09 | 7.12e-08 | 3.65e-08 | 215 |
| hsa04510111 | Esophagus | ESCC | Focal adhesion | 127/4205 | 203/8465 | 1.25e-04 | 4.99e-04 | 2.56e-04 | 127 |
| hsa0415114 | Esophagus | ESCC | PI3K-Akt signaling pathway | 197/4205 | 354/8465 | 1.24e-02 | 2.83e-02 | 1.45e-02 | 197 |
| hsa0451021 | Liver | Cirrhotic | Focal adhesion | 93/2530 | 203/8465 | 9.27e-07 | 1.10e-05 | 6.80e-06 | 93 |
| hsa05165 | Liver | Cirrhotic | Human papillomavirus infection | 124/2530 | 331/8465 | 1.55e-03 | 7.83e-03 | 4.83e-03 | 124 |
| hsa0451031 | Liver | Cirrhotic | Focal adhesion | 93/2530 | 203/8465 | 9.27e-07 | 1.10e-05 | 6.80e-06 | 93 |
| hsa051651 | Liver | Cirrhotic | Human papillomavirus infection | 124/2530 | 331/8465 | 1.55e-03 | 7.83e-03 | 4.83e-03 | 124 |
| hsa0451041 | Liver | HCC | Focal adhesion | 125/4020 | 203/8465 | 3.12e-05 | 1.88e-04 | 1.04e-04 | 125 |
| hsa051652 | Liver | HCC | Human papillomavirus infection | 188/4020 | 331/8465 | 3.34e-04 | 1.49e-03 | 8.29e-04 | 188 |
| hsa0451051 | Liver | HCC | Focal adhesion | 125/4020 | 203/8465 | 3.12e-05 | 1.88e-04 | 1.04e-04 | 125 |
| hsa051653 | Liver | HCC | Human papillomavirus infection | 188/4020 | 331/8465 | 3.34e-04 | 1.49e-03 | 8.29e-04 | 188 |
| hsa051659 | Oral cavity | OSCC | Human papillomavirus infection | 200/3704 | 331/8465 | 3.83e-10 | 4.93e-09 | 2.51e-09 | 200 |
| hsa0451019 | Oral cavity | OSCC | Focal adhesion | 128/3704 | 203/8465 | 1.71e-08 | 1.63e-07 | 8.31e-08 | 128 |
| Hugo Symbol | Variant Class | Variant Classification | dbSNP RS | HGVSc | HGVSp | HGVSp Short | SWISSPROT | BIOTYPE | SIFT | PolyPhen | Tumor Sample Barcode | Tissue | Histology | Sex | Age | Stage | Therapy Types | Drugs | Outcome |
| COL6A1 | SNV | Missense_Mutation | novel | c.142N>T | p.Val48Leu | p.V48L | P12109 | protein_coding | deleterious(0) | probably_damaging(0.996) | TCGA-A7-A26H-01 | Breast | breast invasive carcinoma | Female | >=65 | I/II | Hormone Therapy | anastrozole | PD |
| COL6A1 | SNV | Missense_Mutation | rs780891158 | c.2782C>T | p.Arg928Cys | p.R928C | P12109 | protein_coding | deleterious(0) | probably_damaging(0.949) | TCGA-A7-A426-01 | Breast | breast invasive carcinoma | Female | <65 | III/IV | Chemotherapy | adriamycin | SD |
| COL6A1 | SNV | Missense_Mutation | | c.1933C>A | p.Leu645Met | p.L645M | P12109 | protein_coding | deleterious(0.01) | probably_damaging(0.993) | TCGA-A8-A06X-01 | Breast | breast invasive carcinoma | Female | >=65 | I/II | Unknown | Unknown | SD |
| COL6A1 | SNV | Missense_Mutation | rs752259110 | c.784N>T | p.Arg262Trp | p.R262W | P12109 | protein_coding | deleterious(0.02) | probably_damaging(0.969) | TCGA-E9-A1R2-01 | Breast | breast invasive carcinoma | Female | <65 | III/IV | Chemotherapy | taxotere | CR |
| COL6A1 | SNV | Missense_Mutation | rs368239109 | c.1315N>T | p.Arg439Trp | p.R439W | P12109 | protein_coding | deleterious(0.01) | probably_damaging(0.986) | TCGA-E9-A1RE-01 | Breast | breast invasive carcinoma | Female | >=65 | III/IV | Hormone Therapy | tamoxiphen | SD |
| COL6A1 | deletion | Frame_Shift_Del | novel | c.1242delN | p.Pro415GlnfsTer90 | p.P415Qfs*90 | P12109 | protein_coding | | | TCGA-D8-A27V-01 | Breast | breast invasive carcinoma | Female | <65 | I/II | Hormone Therapy | tamoxiphen | SD |
| COL6A1 | deletion | Frame_Shift_Del | novel | c.1821delN | p.Cys607TrpfsTer39 | p.C607Wfs*39 | P12109 | protein_coding | | | TCGA-D8-A27V-01 | Breast | breast invasive carcinoma | Female | <65 | I/II | Hormone Therapy | tamoxiphen | SD |
| COL6A1 | deletion | Frame_Shift_Del | novel | c.2339delN | p.Gln781ArgfsTer22 | p.Q781Rfs*22 | P12109 | protein_coding | | | TCGA-EW-A2FV-01 | Breast | breast invasive carcinoma | Female | <65 | III/IV | Chemotherapy | docetaxel | SD |
| COL6A1 | SNV | Missense_Mutation | rs201456885 | c.2998N>A | p.Glu1000Lys | p.E1000K | P12109 | protein_coding | deleterious(0.02) | benign(0.251) | TCGA-2W-A8YY-01 | Cervix | cervical & endocervical cancer | Female | <65 | I/II | Chemotherapy | cisplatin | CR |
| COL6A1 | SNV | Missense_Mutation | | c.1870N>C | p.Glu624Gln | p.E624Q | P12109 | protein_coding | deleterious(0.02) | probably_damaging(0.999) | TCGA-C5-A1BQ-01 | Cervix | cervical & endocervical cancer | Female | >=65 | III/IV | Chemotherapy | cisplatin | CR |


