
|
|||||
|
 | |
| |
| |
| |
| |
| |
|
Gene: COL5A2 |
Gene summary for COL5A2 |
| Gene information | Species | Human | Gene symbol | COL5A2 | Gene ID | 1290 |
| Gene name | collagen type V alpha 2 chain | |
| Gene Alias | EDSC | |
| Cytomap | 2q32.2 | |
| Gene Type | protein-coding | GO ID | GO:0001101 | UniProtAcc | P05997 |
Top |
Malignant transformation analysis |
| Identification of the aberrant gene expression in precancerous and cancerous lesions by comparing the gene expression of stem-like cells in diseased tissues with normal stem cells |
| Entrez ID | Symbol | Replicates | Species | Organ | Tissue | Adj P-value | Log2FC | Malignancy |
| 1290 | COL5A2 | P4T-E | Human | Esophagus | ESCC | 4.63e-07 | 8.12e-01 | 0.1323 |
| 1290 | COL5A2 | P5T-E | Human | Esophagus | ESCC | 1.23e-03 | 7.49e-01 | 0.1327 |
| 1290 | COL5A2 | P8T-E | Human | Esophagus | ESCC | 1.75e-03 | 1.67e-01 | 0.0889 |
| 1290 | COL5A2 | P9T-E | Human | Esophagus | ESCC | 1.94e-09 | 1.10e+00 | 0.1131 |
| 1290 | COL5A2 | P10T-E | Human | Esophagus | ESCC | 6.57e-12 | 6.32e-01 | 0.116 |
| 1290 | COL5A2 | P11T-E | Human | Esophagus | ESCC | 1.73e-26 | 1.42e+00 | 0.1426 |
| 1290 | COL5A2 | P19T-E | Human | Esophagus | ESCC | 1.24e-09 | 9.43e-01 | 0.1662 |
| 1290 | COL5A2 | P21T-E | Human | Esophagus | ESCC | 8.67e-04 | 3.53e-01 | 0.1617 |
| 1290 | COL5A2 | P22T-E | Human | Esophagus | ESCC | 2.54e-08 | 5.52e-01 | 0.1236 |
| 1290 | COL5A2 | P23T-E | Human | Esophagus | ESCC | 1.07e-08 | 5.93e-01 | 0.108 |
| 1290 | COL5A2 | P24T-E | Human | Esophagus | ESCC | 3.08e-12 | 5.91e-01 | 0.1287 |
| 1290 | COL5A2 | P26T-E | Human | Esophagus | ESCC | 3.31e-02 | 1.47e-01 | 0.1276 |
| 1290 | COL5A2 | P32T-E | Human | Esophagus | ESCC | 3.22e-80 | 2.22e+00 | 0.1666 |
| 1290 | COL5A2 | P37T-E | Human | Esophagus | ESCC | 6.60e-61 | 1.88e+00 | 0.1371 |
| 1290 | COL5A2 | P40T-E | Human | Esophagus | ESCC | 9.85e-04 | 4.20e-01 | 0.109 |
| 1290 | COL5A2 | P42T-E | Human | Esophagus | ESCC | 3.08e-12 | 1.38e+00 | 0.1175 |
| 1290 | COL5A2 | P44T-E | Human | Esophagus | ESCC | 6.30e-10 | 1.61e+00 | 0.1096 |
| 1290 | COL5A2 | P47T-E | Human | Esophagus | ESCC | 1.19e-12 | 1.18e+00 | 0.1067 |
| 1290 | COL5A2 | P49T-E | Human | Esophagus | ESCC | 1.04e-02 | 9.43e-01 | 0.1768 |
| 1290 | COL5A2 | P54T-E | Human | Esophagus | ESCC | 2.03e-29 | 9.24e-01 | 0.0975 |
| Page: 1 2 3 |
| Tissue | Expression Dynamics | Abbreviation |
| Esophagus | 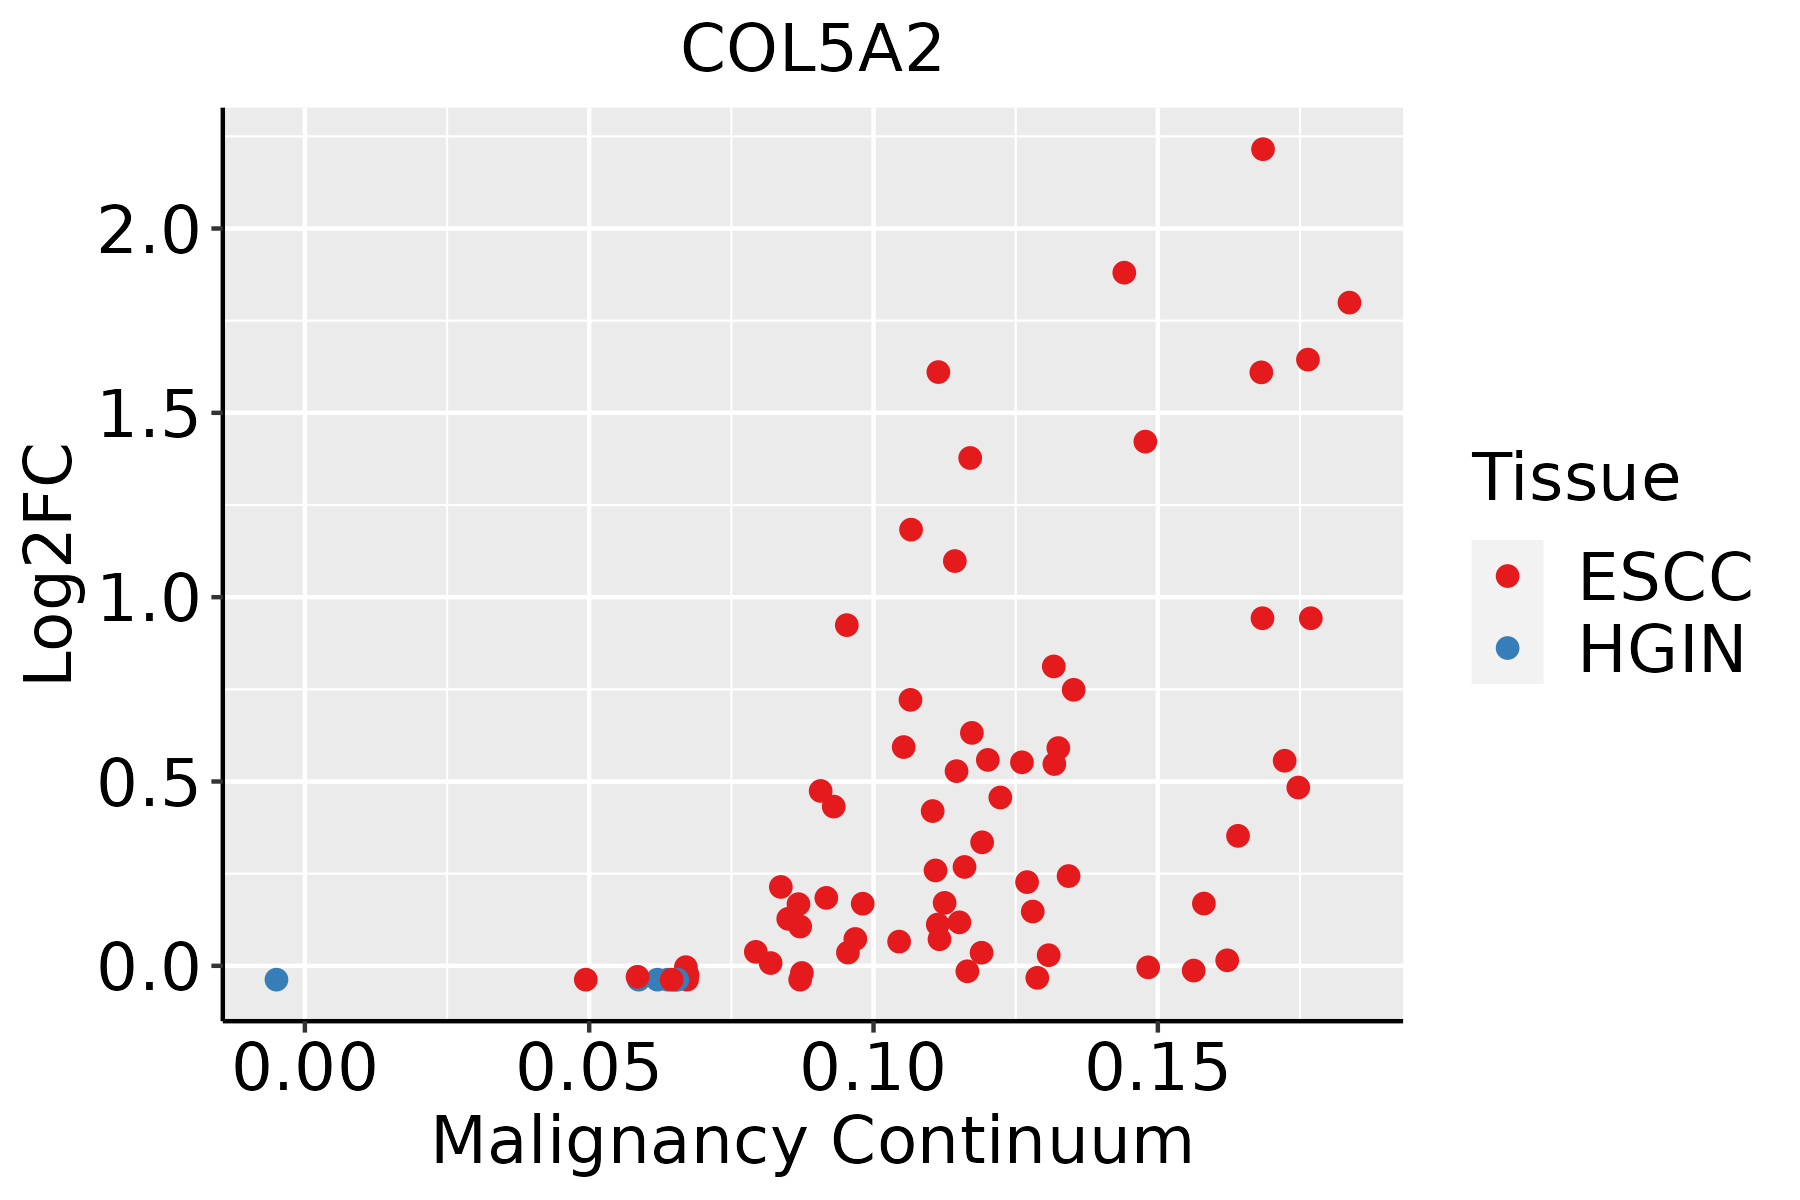 | ESCC: Esophageal squamous cell carcinoma |
| HGIN: High-grade intraepithelial neoplasias | ||
| LGIN: Low-grade intraepithelial neoplasias | ||
| Liver | 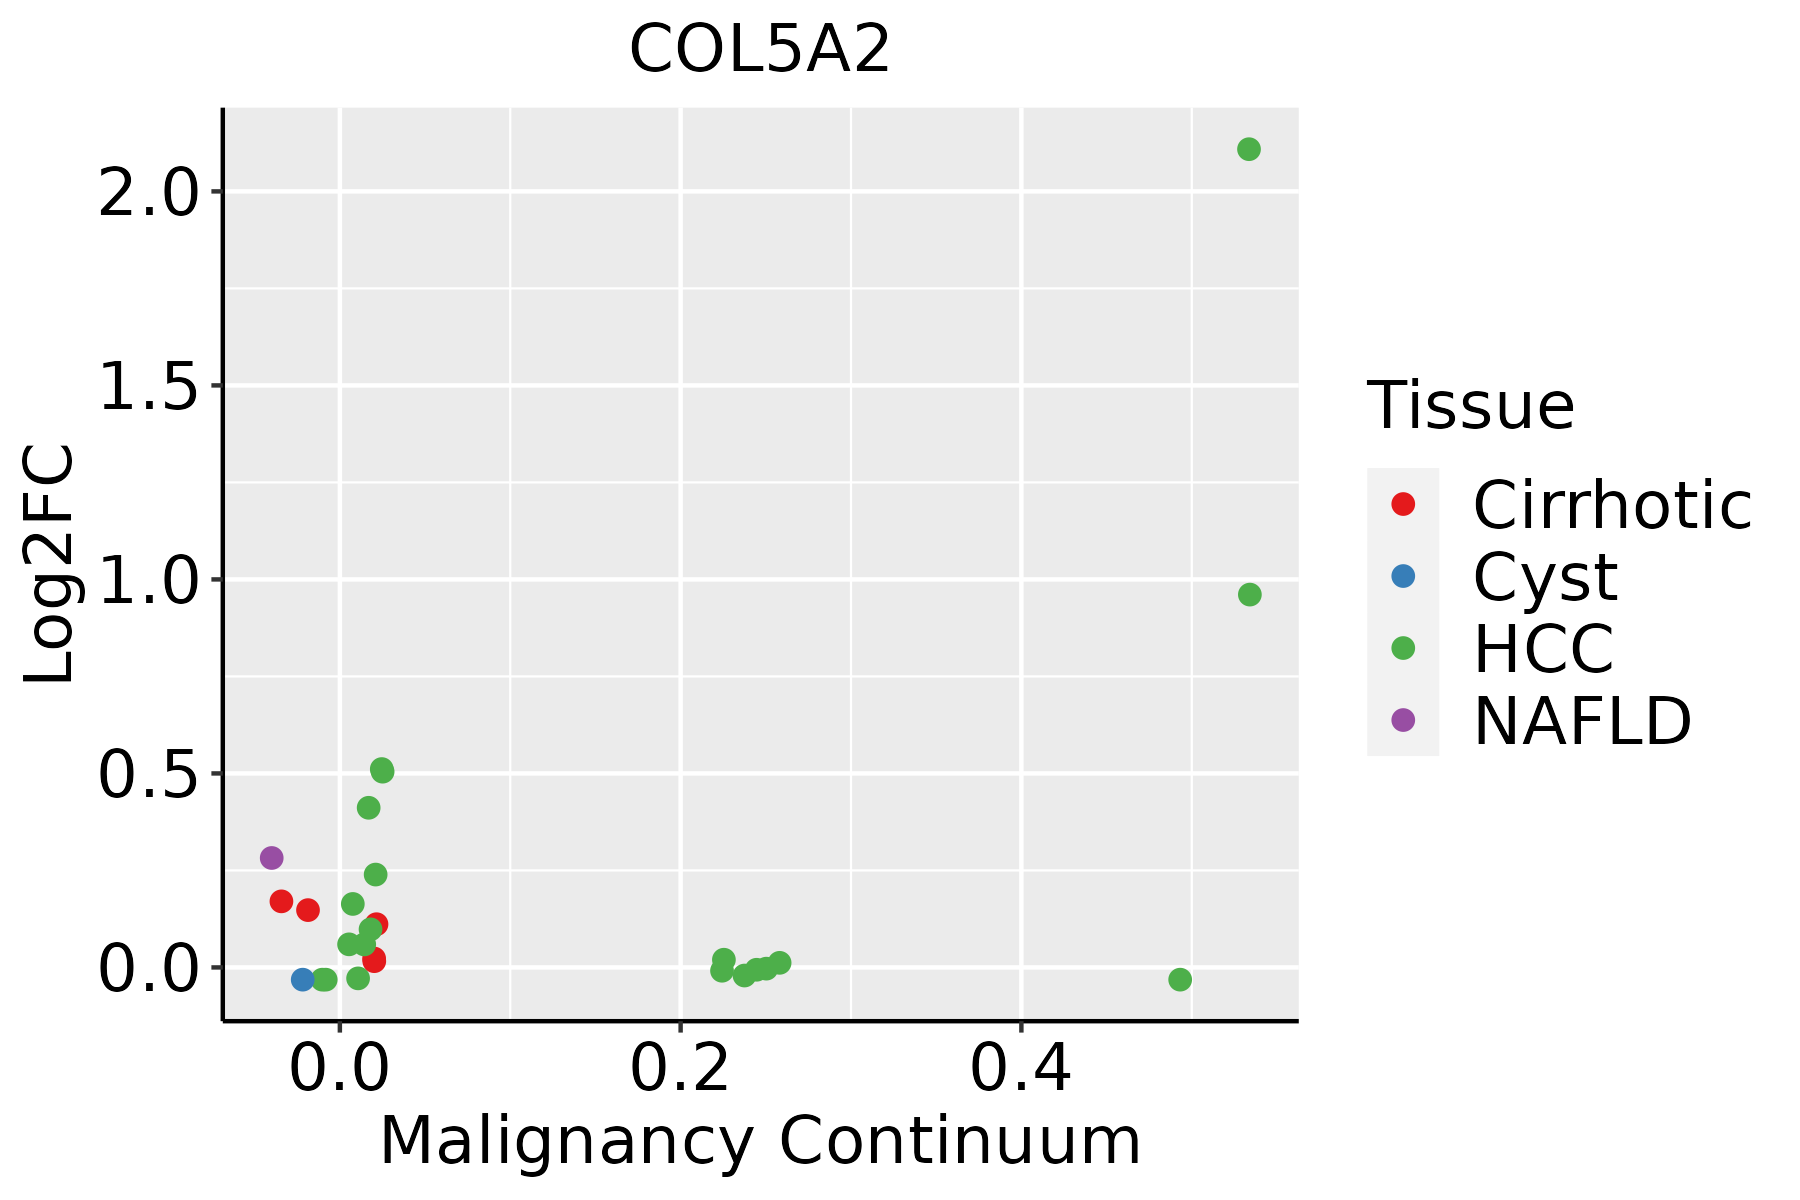 | HCC: Hepatocellular carcinoma |
| NAFLD: Non-alcoholic fatty liver disease | ||
| Oral Cavity | 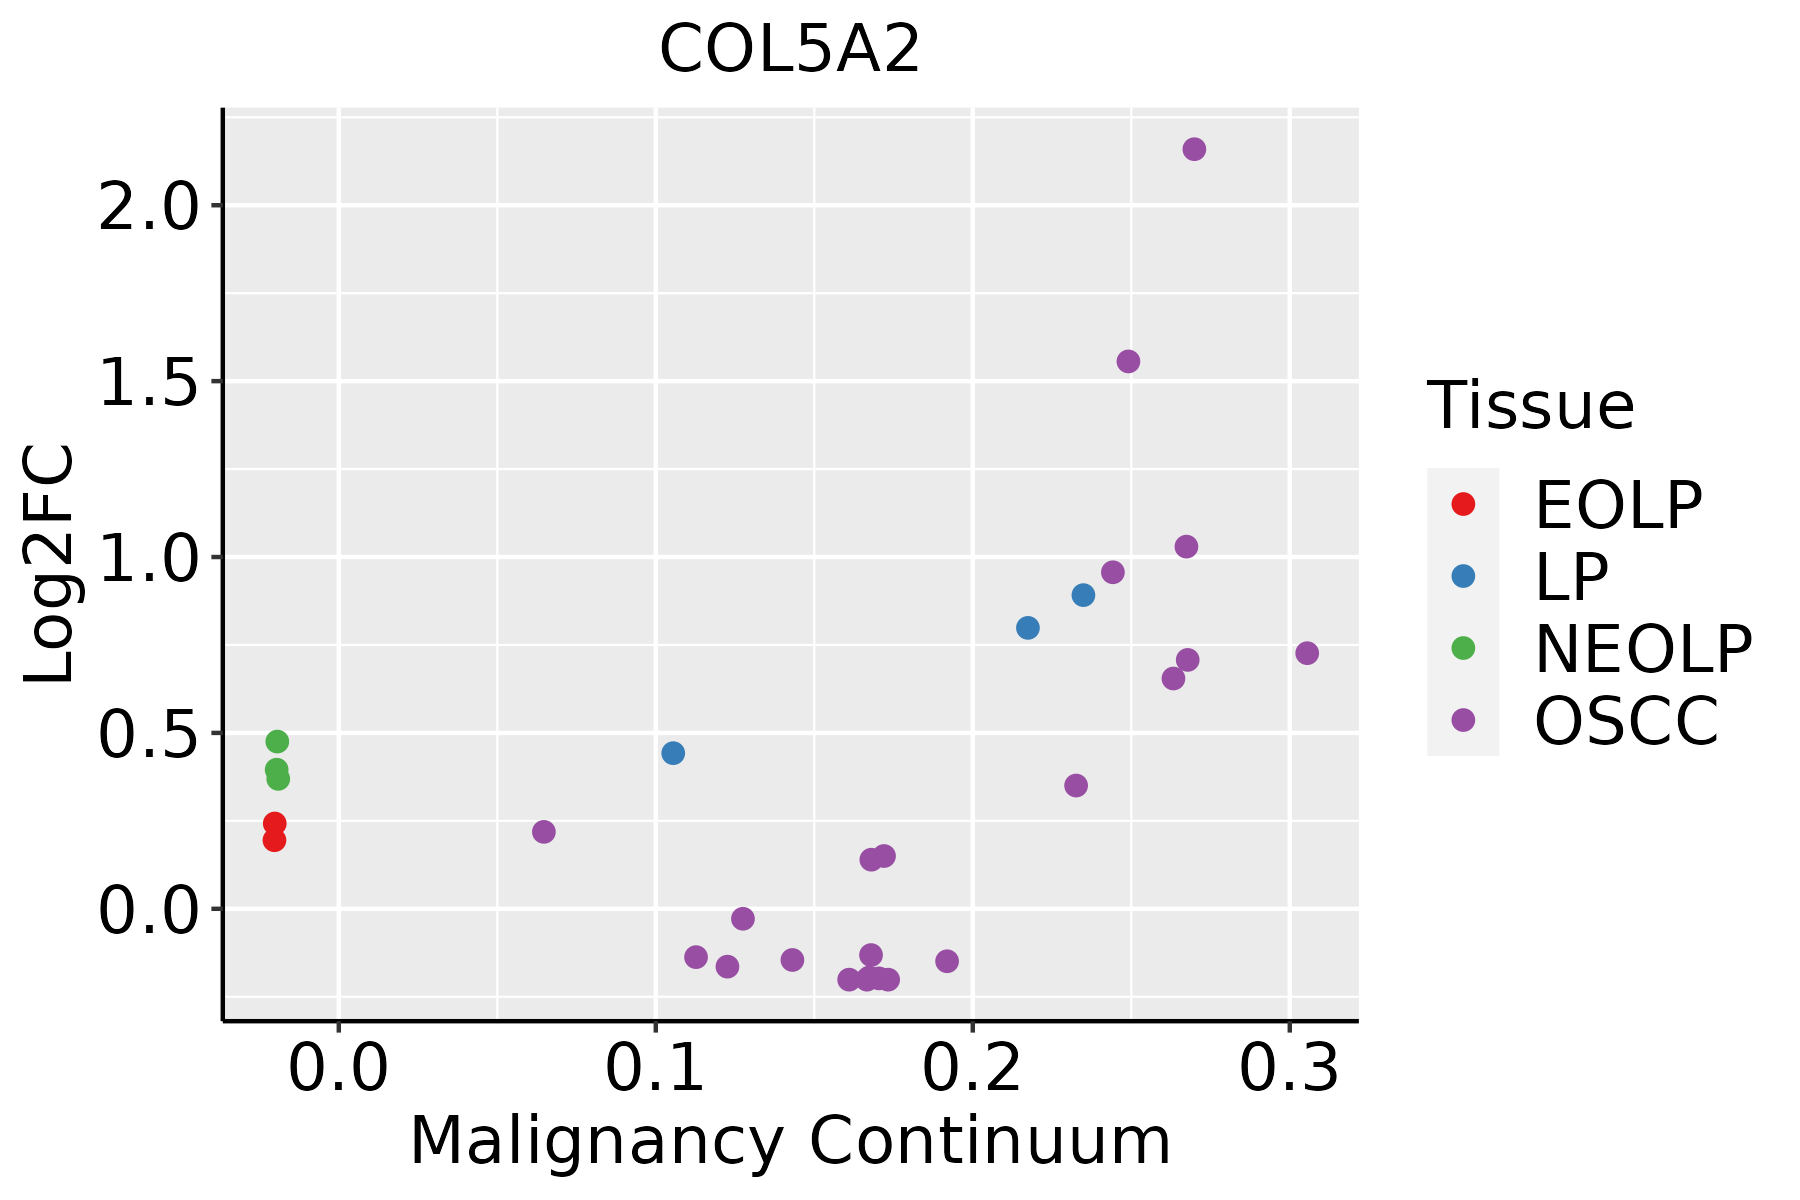 | EOLP: Erosive Oral lichen planus |
| LP: leukoplakia | ||
| NEOLP: Non-erosive oral lichen planus | ||
| OSCC: Oral squamous cell carcinoma | ||
| Skin |  | AK: Actinic keratosis |
| cSCC: Cutaneous squamous cell carcinoma | ||
| SCCIS:squamous cell carcinoma in situ | ||
| Thyroid | 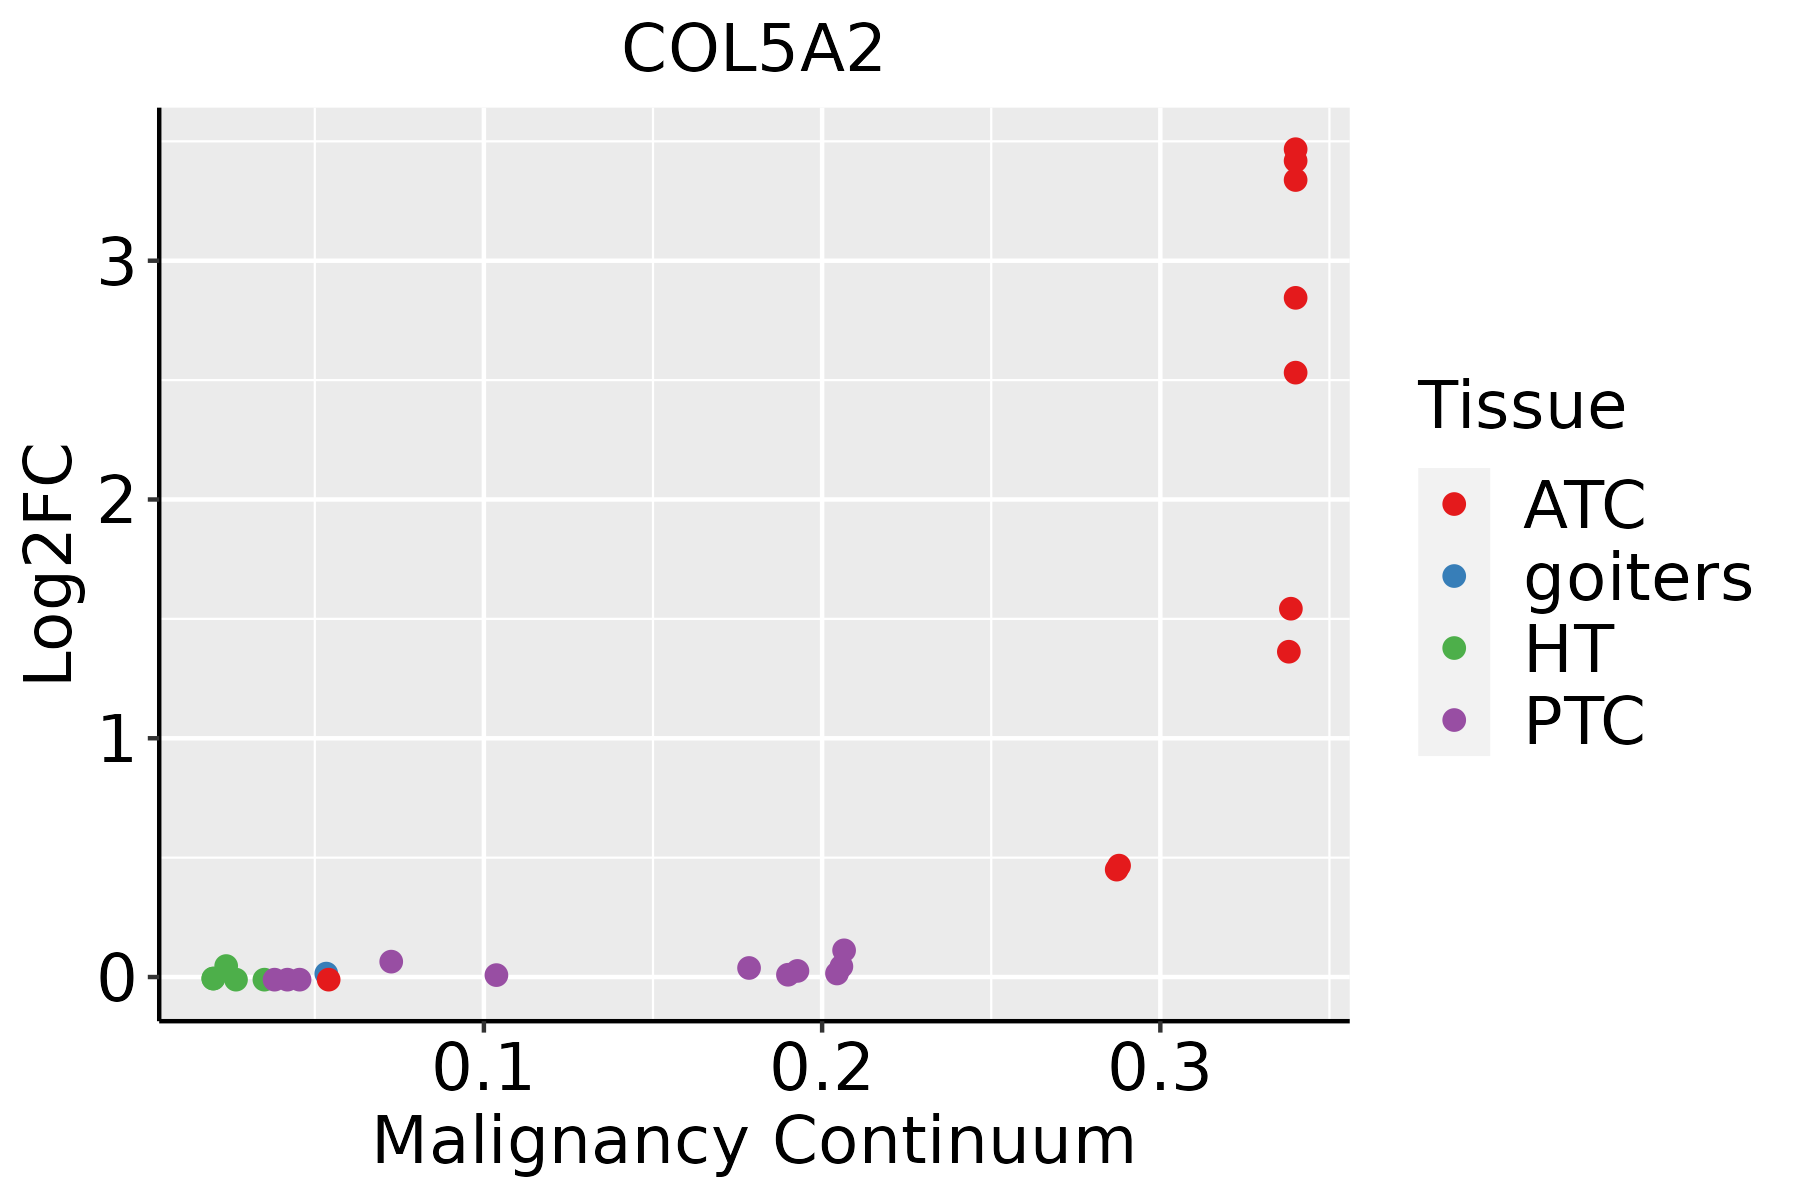 | ATC: Anaplastic thyroid cancer |
| HT: Hashimoto's thyroiditis | ||
| PTC: Papillary thyroid cancer |
| ∗log2FC in expression of this searched gene in stem-like cells from each diseased tissue sample relative to stem-like cells in normal samples in each tissue plotted against the malignancy continuum. Samples are colored based on if they are from different disease stage. |
Top |
Malignant transformation related pathway analysis |
| Find out the enriched GO biological processes and KEGG pathways involved in transition from healthy to precancer to cancer |
| Tissue | Disease Stage | Enriched GO biological Processes |
| Colorectum | AD |  |
| Colorectum | SER |  |
| Colorectum | MSS |  |
| Colorectum | MSI-H |  |
| Colorectum | FAP |  |
| ∗Top 15 enriched GO BP terms are showed in the bar plot of each disease state in each tissue. Each row represents a significant GO biological process which is colored according to the -log10(p.adjust). |
| Page: 1 2 3 4 5 6 7 8 9 |
| GO ID | Tissue | Disease Stage | Description | Gene Ratio | Bg Ratio | pvalue | p.adjust | Count |
| GO:00435888 | Esophagus | ESCC | skin development | 163/8552 | 263/18723 | 6.48e-08 | 1.14e-06 | 163 |
| GO:000150317 | Esophagus | ESCC | ossification | 232/8552 | 408/18723 | 3.00e-06 | 3.40e-05 | 232 |
| GO:00073698 | Esophagus | ESCC | gastrulation | 115/8552 | 185/18723 | 4.35e-06 | 4.64e-05 | 115 |
| GO:00074926 | Esophagus | ESCC | endoderm development | 54/8552 | 77/18723 | 1.20e-05 | 1.12e-04 | 54 |
| GO:00301984 | Esophagus | ESCC | extracellular matrix organization | 171/8552 | 301/18723 | 6.08e-05 | 4.67e-04 | 171 |
| GO:00432007 | Esophagus | ESCC | response to amino acid | 74/8552 | 116/18723 | 6.23e-05 | 4.76e-04 | 74 |
| GO:000110110 | Esophagus | ESCC | response to acid chemical | 84/8552 | 135/18723 | 7.70e-05 | 5.74e-04 | 84 |
| GO:00430624 | Esophagus | ESCC | extracellular structure organization | 171/8552 | 302/18723 | 7.73e-05 | 5.76e-04 | 171 |
| GO:00452294 | Esophagus | ESCC | external encapsulating structure organization | 172/8552 | 304/18723 | 7.80e-05 | 5.80e-04 | 172 |
| GO:00712305 | Esophagus | ESCC | cellular response to amino acid stimulus | 48/8552 | 71/18723 | 1.55e-04 | 1.03e-03 | 48 |
| GO:00017064 | Esophagus | ESCC | endoderm formation | 38/8552 | 54/18723 | 2.08e-04 | 1.31e-03 | 38 |
| GO:00017044 | Esophagus | ESCC | formation of primary germ layer | 75/8552 | 121/18723 | 2.17e-04 | 1.36e-03 | 75 |
| GO:00712296 | Esophagus | ESCC | cellular response to acid chemical | 52/8552 | 80/18723 | 3.79e-04 | 2.20e-03 | 52 |
| GO:00359873 | Esophagus | ESCC | endodermal cell differentiation | 32/8552 | 45/18723 | 4.87e-04 | 2.70e-03 | 32 |
| GO:00301993 | Esophagus | ESCC | collagen fibril organization | 40/8552 | 61/18723 | 1.35e-03 | 6.44e-03 | 40 |
| GO:000110111 | Liver | HCC | response to acid chemical | 79/7958 | 135/18723 | 1.24e-04 | 1.03e-03 | 79 |
| GO:004320011 | Liver | HCC | response to amino acid | 68/7958 | 116/18723 | 3.31e-04 | 2.33e-03 | 68 |
| GO:00712291 | Liver | HCC | cellular response to acid chemical | 45/7958 | 80/18723 | 9.02e-03 | 3.48e-02 | 45 |
| GO:00074921 | Liver | HCC | endoderm development | 43/7958 | 77/18723 | 1.24e-02 | 4.51e-02 | 43 |
| GO:00435887 | Oral cavity | OSCC | skin development | 143/7305 | 263/18723 | 2.77e-07 | 4.27e-06 | 143 |
| Page: 1 2 3 4 5 |
| Pathway ID | Tissue | Disease Stage | Description | Gene Ratio | Bg Ratio | pvalue | p.adjust | qvalue | Count |
| Page: 1 |
Top |
Cell-cell communication analysis |
| Identification of potential cell-cell interactions between two cell types and their ligand-receptor pairs for different disease states |
| Ligand | Receptor | LRpair | Pathway | Tissue | Disease Stage |
| Page: 1 |
Top |
Single-cell gene regulatory network inference analysis |
| Find out the significant the regulons (TFs) and the target genes of each regulon across cell types for different disease states |
| TF | Cell Type | Tissue | Disease Stage | Target Gene | RSS | Regulon Activity |
| ∗The dot plots of a searched regulon are shown for all cell subpopulations in each disease state of each tissue based on the regulon specific score inferred using pySCENIC and by calculating the average expression. |
| Page: 1 |
Top |
Somatic mutation of malignant transformation related genes |
| Annotation of somatic variants for genes involved in malignant transformation |
| Hugo Symbol | Variant Class | Variant Classification | dbSNP RS | HGVSc | HGVSp | HGVSp Short | SWISSPROT | BIOTYPE | SIFT | PolyPhen | Tumor Sample Barcode | Tissue | Histology | Sex | Age | Stage | Therapy Types | Drugs | Outcome |
| COL5A2 | SNV | Missense_Mutation | novel | c.3748N>C | p.Glu1250Gln | p.E1250Q | P05997 | protein_coding | tolerated(0.29) | possibly_damaging(0.616) | TCGA-A2-A0YK-01 | Breast | breast invasive carcinoma | Female | <65 | I/II | Chemotherapy | cytoxan | SD |
| COL5A2 | SNV | Missense_Mutation | c.2452N>G | p.Pro818Ala | p.P818A | P05997 | protein_coding | tolerated(0.65) | benign(0.021) | TCGA-A7-A26J-01 | Breast | breast invasive carcinoma | Female | <65 | I/II | Hormone Therapy | tamoxiphen | SD | |
| COL5A2 | SNV | Missense_Mutation | rs760569641 | c.4357N>T | p.Arg1453Trp | p.R1453W | P05997 | protein_coding | deleterious(0) | probably_damaging(0.924) | TCGA-A8-A075-01 | Breast | breast invasive carcinoma | Female | <65 | I/II | Chemotherapy | epirubicin | CR |
| COL5A2 | SNV | Missense_Mutation | c.3662N>T | p.Gly1221Val | p.G1221V | P05997 | protein_coding | deleterious(0) | probably_damaging(1) | TCGA-AN-A0FL-01 | Breast | breast invasive carcinoma | Female | <65 | I/II | Unknown | Unknown | SD | |
| COL5A2 | SNV | Missense_Mutation | novel | c.2267G>C | p.Gly756Ala | p.G756A | P05997 | protein_coding | deleterious(0.02) | probably_damaging(0.996) | TCGA-AR-A5QQ-01 | Breast | breast invasive carcinoma | Female | >=65 | III/IV | Chemotherapy | carboplatin | PD |
| COL5A2 | SNV | Missense_Mutation | c.721N>A | p.Glu241Lys | p.E241K | P05997 | protein_coding | deleterious(0.02) | possibly_damaging(0.614) | TCGA-BH-A0AW-01 | Breast | breast invasive carcinoma | Female | <65 | I/II | Chemotherapy | carboplatin | SD | |
| COL5A2 | SNV | Missense_Mutation | c.505N>A | p.Gln169Lys | p.Q169K | P05997 | protein_coding | tolerated(0.88) | benign(0.43) | TCGA-D8-A1J8-01 | Breast | breast invasive carcinoma | Female | >=65 | I/II | Hormone Therapy | nolvadex | SD | |
| COL5A2 | SNV | Missense_Mutation | c.3293N>C | p.Gly1098Ala | p.G1098A | P05997 | protein_coding | deleterious(0) | probably_damaging(0.999) | TCGA-D8-A1JA-01 | Breast | breast invasive carcinoma | Female | <65 | III/IV | Chemotherapy | adriamycin | PD | |
| COL5A2 | SNV | Missense_Mutation | c.1744N>C | p.Gly582Arg | p.G582R | P05997 | protein_coding | deleterious(0) | probably_damaging(1) | TCGA-E2-A158-01 | Breast | breast invasive carcinoma | Female | <65 | I/II | Chemotherapy | arimidex | SD | |
| COL5A2 | SNV | Missense_Mutation | novel | c.1679N>A | p.Pro560Gln | p.P560Q | P05997 | protein_coding | deleterious(0.02) | probably_damaging(0.993) | TCGA-E2-A1IE-01 | Breast | breast invasive carcinoma | Female | <65 | I/II | Chemotherapy | doxorubicin | PD |
| Page: 1 2 3 4 5 6 7 8 9 10 11 12 13 14 15 16 17 18 19 20 21 22 23 |
Top |
Related drugs of malignant transformation related genes |
| Identification of chemicals and drugs interact with genes involved in malignant transfromation |
| (DGIdb 4.0) |
| Entrez ID | Symbol | Category | Interaction Types | Drug Claim Name | Drug Name | PMIDs |
| 1290 | COL5A2 | DRUGGABLE GENOME | CHEMBL2095222 | OCRIPLASMIN | ||
| 1290 | COL5A2 | DRUGGABLE GENOME | CHEMBL2108709 | COLLAGENASE CLOSTRIDIUM HISTOLYTICUM |
| Page: 1 |

Copyright 2023-Present -The University of Texas Health Science Center at Houston |