
|
|||||
|
 | |
| |
| |
| |
| |
| |
|
Gene: COL5A1 |
Gene summary for COL5A1 |
| Gene information | Species | Human | Gene symbol | COL5A1 | Gene ID | 1289 |
| Gene name | collagen type V alpha 1 chain | |
| Gene Alias | EDSC | |
| Cytomap | 9q34.3 | |
| Gene Type | protein-coding | GO ID | GO:0001568 | UniProtAcc | A0A024R8E5 |
Top |
Malignant transformation analysis |
| Identification of the aberrant gene expression in precancerous and cancerous lesions by comparing the gene expression of stem-like cells in diseased tissues with normal stem cells |
| Entrez ID | Symbol | Replicates | Species | Organ | Tissue | Adj P-value | Log2FC | Malignancy |
| 1289 | COL5A1 | AEH-subject1 | Human | Endometrium | AEH | 1.45e-25 | -6.14e-01 | -0.3059 |
| 1289 | COL5A1 | AEH-subject2 | Human | Endometrium | AEH | 2.57e-26 | -6.10e-01 | -0.2525 |
| 1289 | COL5A1 | AEH-subject3 | Human | Endometrium | AEH | 5.19e-19 | -5.51e-01 | -0.2576 |
| 1289 | COL5A1 | AEH-subject4 | Human | Endometrium | AEH | 3.64e-03 | -2.83e-01 | -0.2657 |
| 1289 | COL5A1 | AEH-subject5 | Human | Endometrium | AEH | 9.04e-29 | -6.26e-01 | -0.2953 |
| 1289 | COL5A1 | EEC-subject1 | Human | Endometrium | EEC | 4.78e-30 | -6.36e-01 | -0.2682 |
| 1289 | COL5A1 | EEC-subject2 | Human | Endometrium | EEC | 5.49e-38 | -6.46e-01 | -0.2607 |
| 1289 | COL5A1 | EEC-subject3 | Human | Endometrium | EEC | 5.89e-32 | -6.30e-01 | -0.2525 |
| 1289 | COL5A1 | EEC-subject4 | Human | Endometrium | EEC | 8.33e-32 | -6.02e-01 | -0.2571 |
| 1289 | COL5A1 | EEC-subject5 | Human | Endometrium | EEC | 6.51e-34 | -6.43e-01 | -0.249 |
| 1289 | COL5A1 | GSM5276934 | Human | Endometrium | EEC | 1.17e-17 | -5.23e-01 | -0.0913 |
| 1289 | COL5A1 | GSM5276935 | Human | Endometrium | EEC | 1.38e-34 | -6.42e-01 | -0.123 |
| 1289 | COL5A1 | GSM5276937 | Human | Endometrium | EEC | 1.01e-07 | -4.04e-01 | -0.0897 |
| 1289 | COL5A1 | GSM6177620_NYU_UCEC1_lib1_lib1 | Human | Endometrium | EEC | 1.54e-26 | -6.40e-01 | -0.1869 |
| 1289 | COL5A1 | GSM6177620_NYU_UCEC1_lib2_lib2 | Human | Endometrium | EEC | 1.57e-26 | -6.52e-01 | -0.1875 |
| 1289 | COL5A1 | GSM6177620_NYU_UCEC1_lib3_lib3 | Human | Endometrium | EEC | 1.09e-30 | -6.52e-01 | -0.1883 |
| 1289 | COL5A1 | GSM6177621_NYU_UCEC2_lib1_lib1 | Human | Endometrium | EEC | 2.72e-32 | -6.47e-01 | -0.1934 |
| 1289 | COL5A1 | GSM6177622_NYU_UCEC3_lib1_lib1 | Human | Endometrium | EEC | 2.94e-39 | -6.52e-01 | -0.1917 |
| 1289 | COL5A1 | GSM6177622_NYU_UCEC3_lib2_lib2 | Human | Endometrium | EEC | 1.75e-36 | -6.40e-01 | -0.1916 |
| 1289 | COL5A1 | GSM6177623_NYU_UCEC3_Vis | Human | Endometrium | EEC | 4.13e-07 | -4.02e-01 | -0.1269 |
| Page: 1 2 3 4 |
| Tissue | Expression Dynamics | Abbreviation |
| Endometrium | 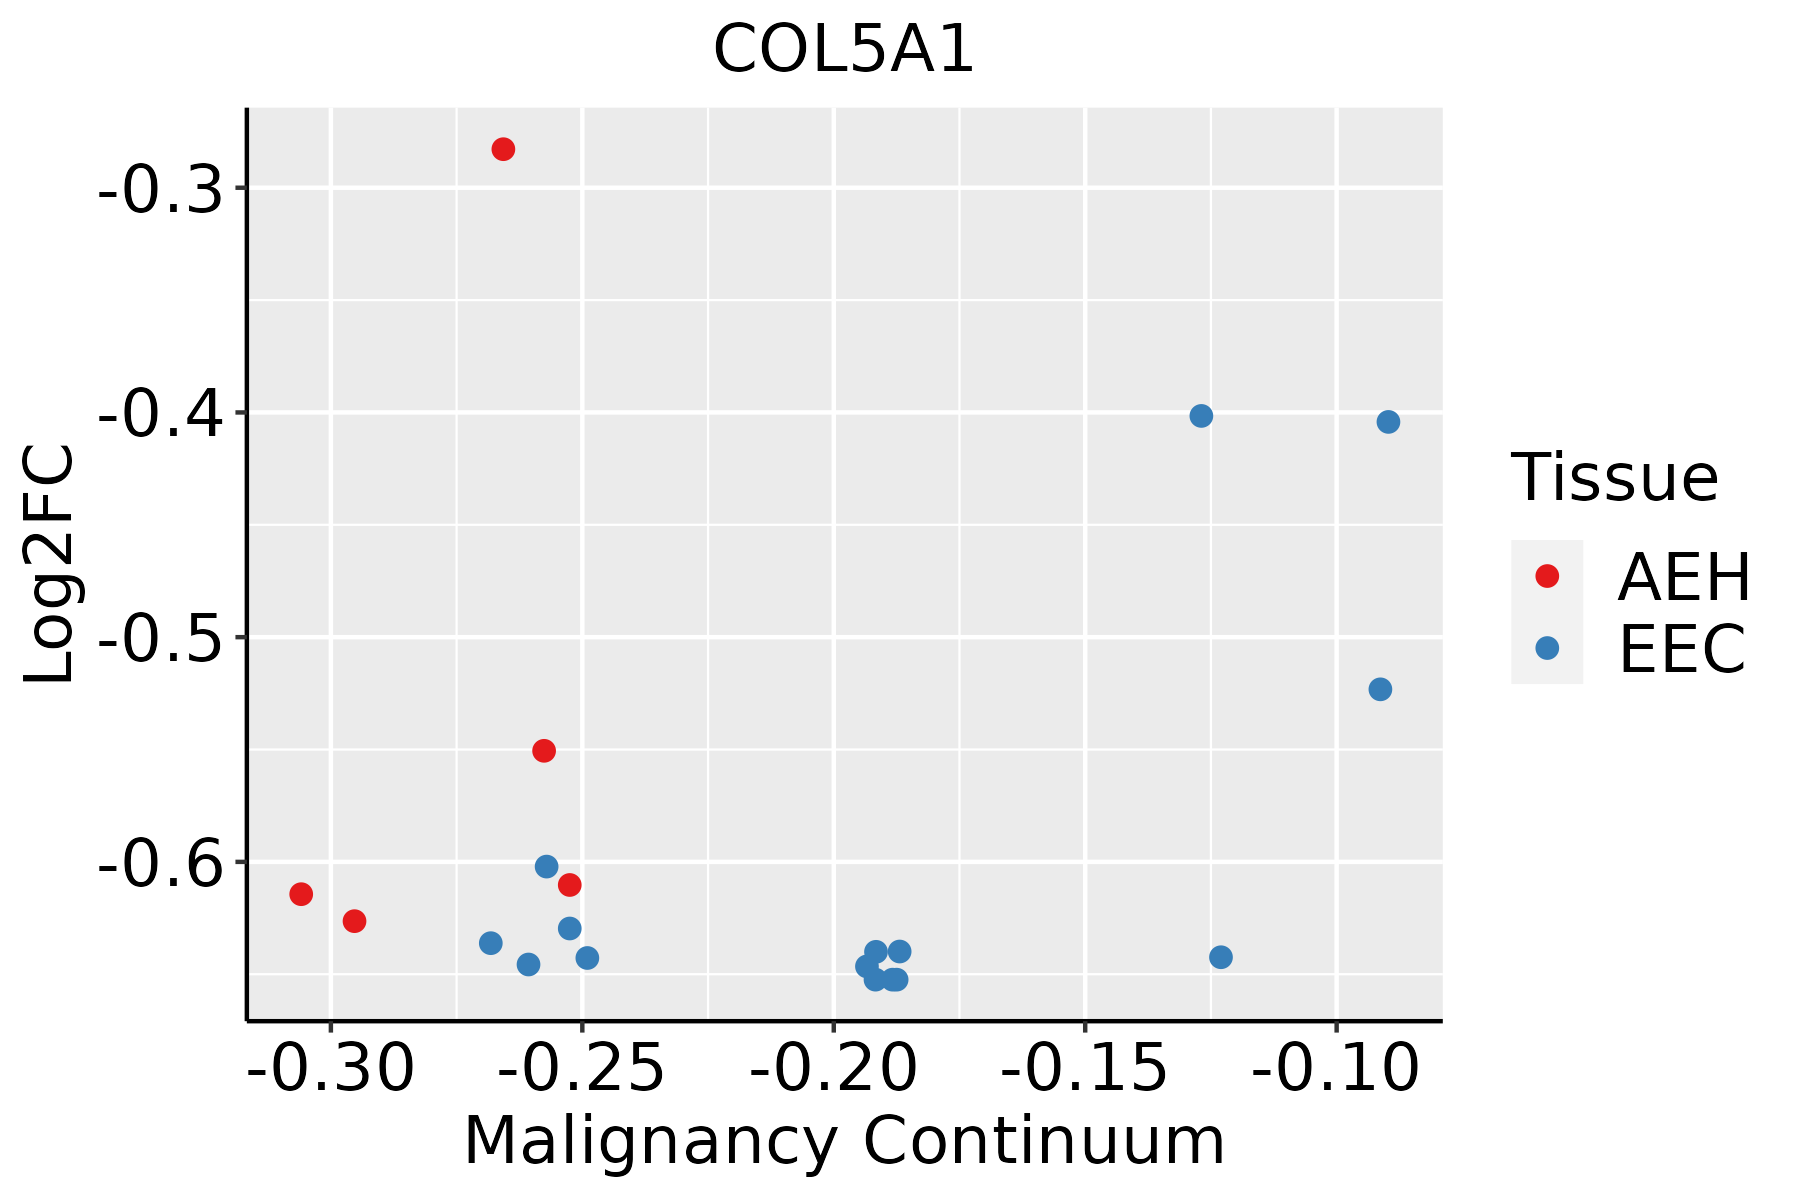 | AEH: Atypical endometrial hyperplasia |
| EEC: Endometrioid Cancer | ||
| Esophagus | 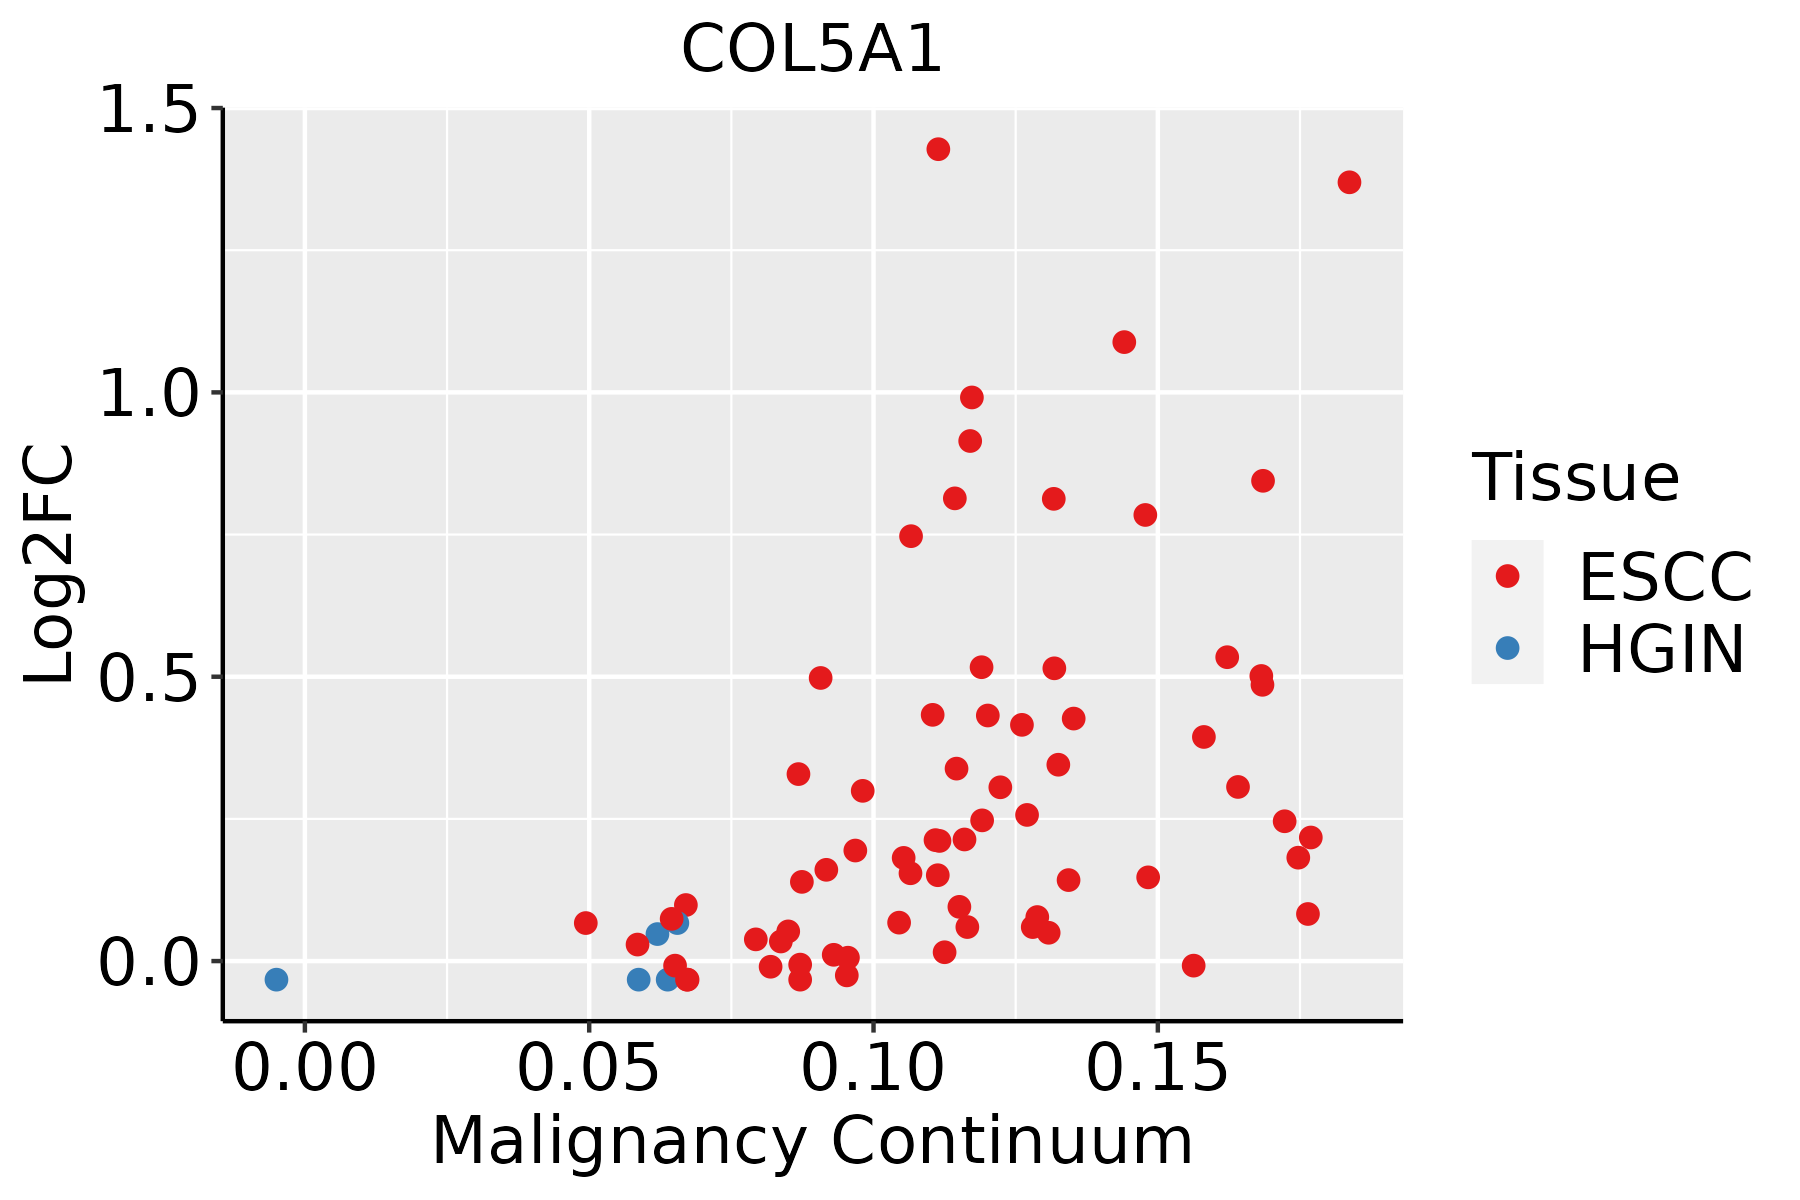 | ESCC: Esophageal squamous cell carcinoma |
| HGIN: High-grade intraepithelial neoplasias | ||
| LGIN: Low-grade intraepithelial neoplasias | ||
| Oral Cavity | 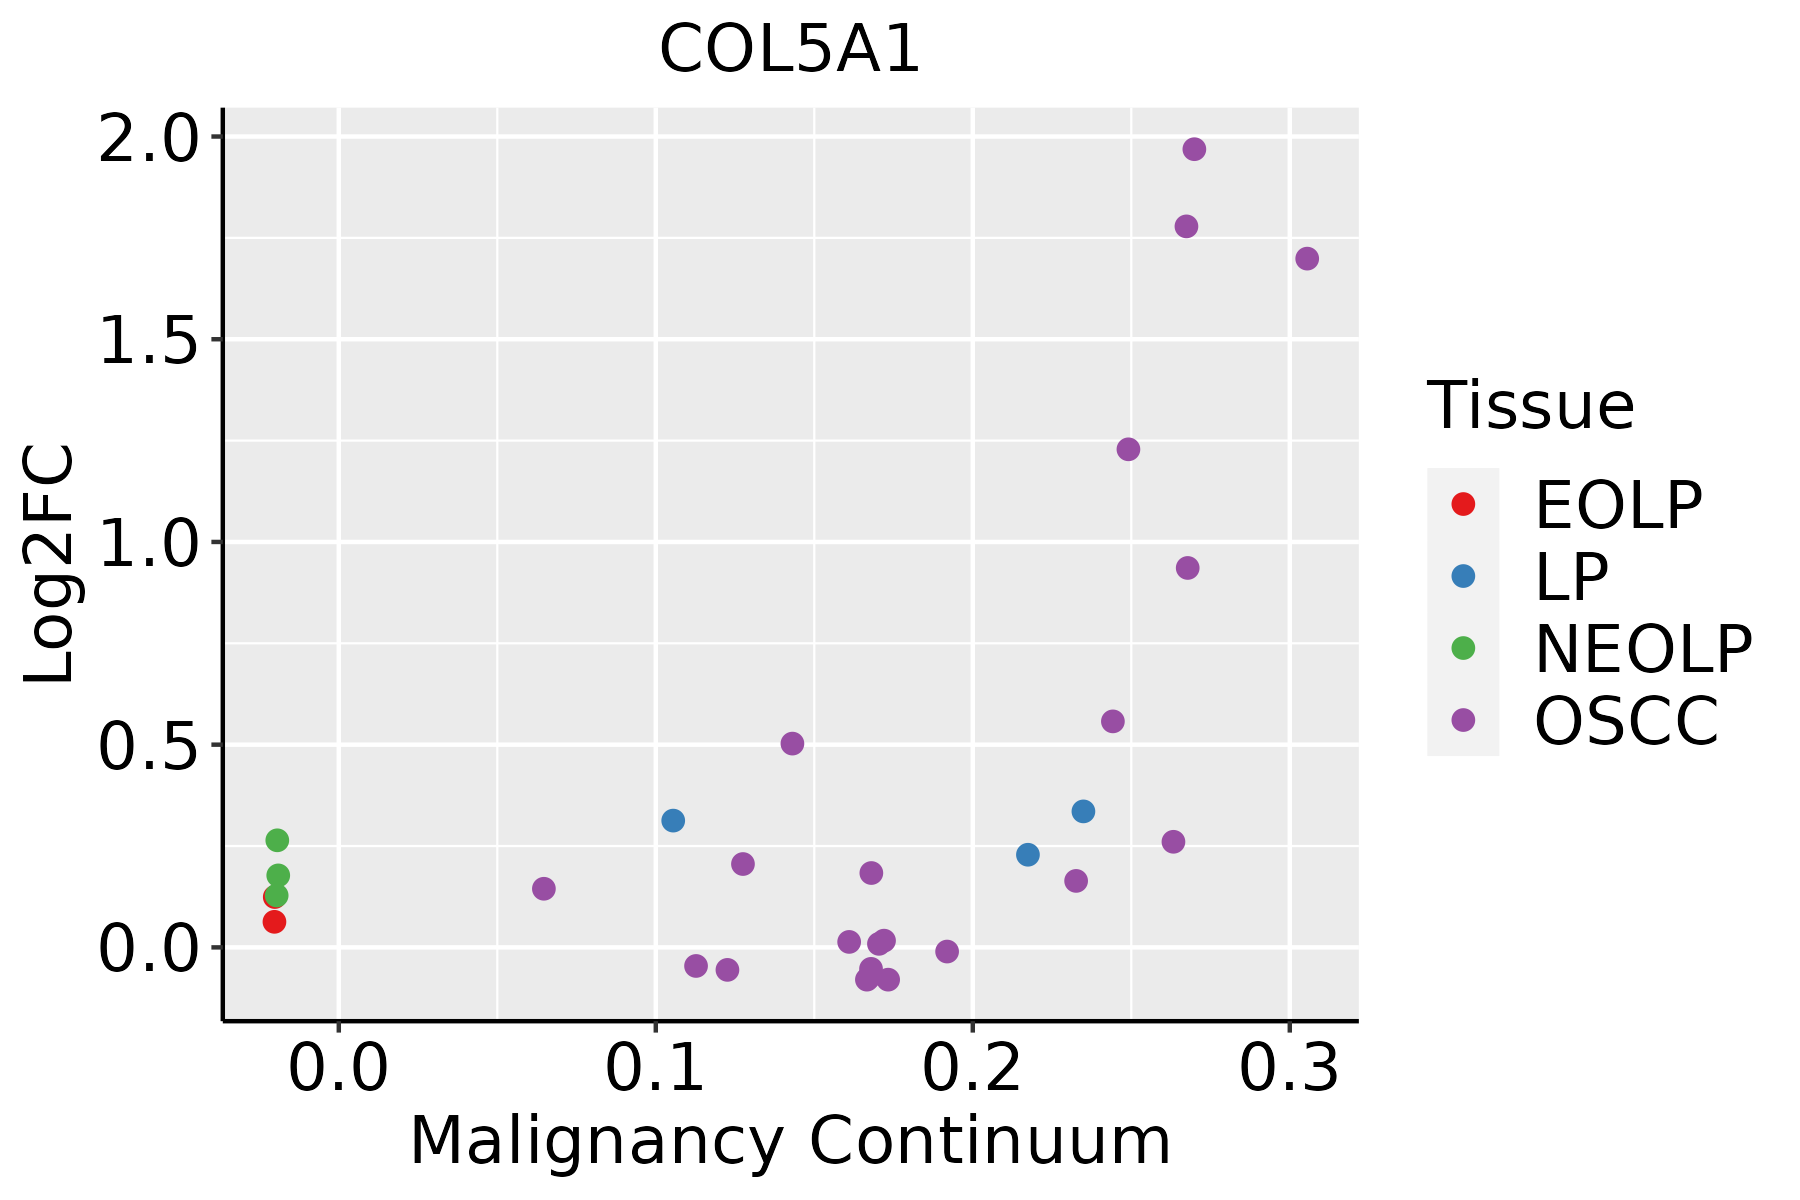 | EOLP: Erosive Oral lichen planus |
| LP: leukoplakia | ||
| NEOLP: Non-erosive oral lichen planus | ||
| OSCC: Oral squamous cell carcinoma | ||
| Thyroid | 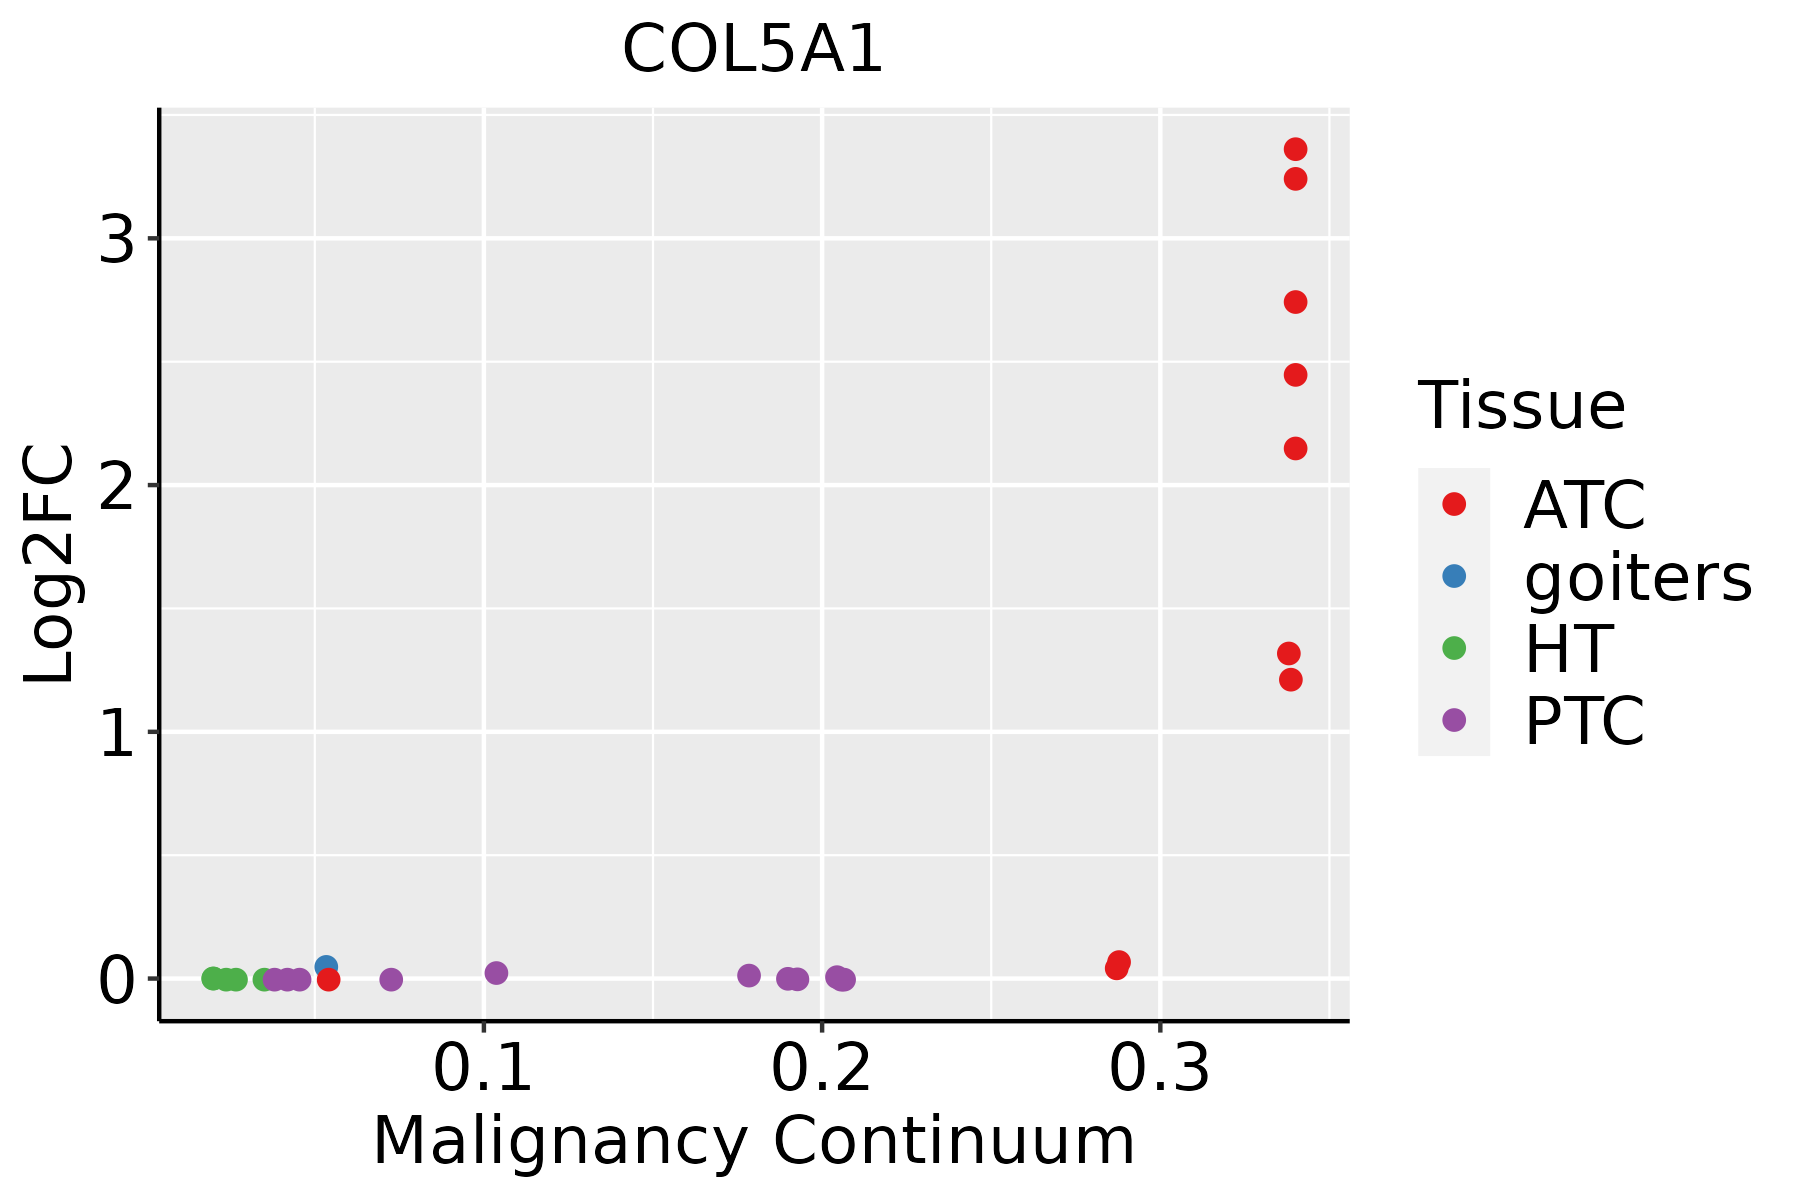 | ATC: Anaplastic thyroid cancer |
| HT: Hashimoto's thyroiditis | ||
| PTC: Papillary thyroid cancer |
| ∗log2FC in expression of this searched gene in stem-like cells from each diseased tissue sample relative to stem-like cells in normal samples in each tissue plotted against the malignancy continuum. Samples are colored based on if they are from different disease stage. |
Top |
Malignant transformation related pathway analysis |
| Find out the enriched GO biological processes and KEGG pathways involved in transition from healthy to precancer to cancer |
| Tissue | Disease Stage | Enriched GO biological Processes |
| Colorectum | AD |  |
| Colorectum | SER |  |
| Colorectum | MSS |  |
| Colorectum | MSI-H |  |
| Colorectum | FAP |  |
| ∗Top 15 enriched GO BP terms are showed in the bar plot of each disease state in each tissue. Each row represents a significant GO biological process which is colored according to the -log10(p.adjust). |
| Page: 1 2 3 4 5 6 7 8 9 |
| GO ID | Tissue | Disease Stage | Description | Gene Ratio | Bg Ratio | pvalue | p.adjust | Count |
| GO:004206016 | Endometrium | AEH | wound healing | 91/2100 | 422/18723 | 4.85e-10 | 4.61e-08 | 91 |
| GO:00030072 | Endometrium | AEH | heart morphogenesis | 45/2100 | 246/18723 | 6.41e-04 | 6.23e-03 | 45 |
| GO:00443194 | Endometrium | AEH | wound healing, spreading of cells | 11/2100 | 34/18723 | 8.45e-04 | 7.82e-03 | 11 |
| GO:00905054 | Endometrium | AEH | epiboly involved in wound healing | 11/2100 | 34/18723 | 8.45e-04 | 7.82e-03 | 11 |
| GO:00905044 | Endometrium | AEH | epiboly | 11/2100 | 35/18723 | 1.11e-03 | 9.71e-03 | 11 |
| GO:0061448 | Endometrium | AEH | connective tissue development | 44/2100 | 252/18723 | 1.92e-03 | 1.51e-02 | 44 |
| GO:00435885 | Endometrium | AEH | skin development | 45/2100 | 263/18723 | 2.58e-03 | 1.90e-02 | 45 |
| GO:00020112 | Endometrium | AEH | morphogenesis of an epithelial sheet | 14/2100 | 57/18723 | 3.48e-03 | 2.39e-02 | 14 |
| GO:0030199 | Endometrium | AEH | collagen fibril organization | 14/2100 | 61/18723 | 6.65e-03 | 3.91e-02 | 14 |
| GO:004206017 | Endometrium | EEC | wound healing | 92/2168 | 422/18723 | 1.12e-09 | 9.58e-08 | 92 |
| GO:004431911 | Endometrium | EEC | wound healing, spreading of cells | 11/2168 | 34/18723 | 1.10e-03 | 9.48e-03 | 11 |
| GO:009050511 | Endometrium | EEC | epiboly involved in wound healing | 11/2168 | 34/18723 | 1.10e-03 | 9.48e-03 | 11 |
| GO:00030071 | Endometrium | EEC | heart morphogenesis | 45/2168 | 246/18723 | 1.24e-03 | 1.03e-02 | 45 |
| GO:009050411 | Endometrium | EEC | epiboly | 11/2168 | 35/18723 | 1.44e-03 | 1.17e-02 | 11 |
| GO:00614481 | Endometrium | EEC | connective tissue development | 44/2168 | 252/18723 | 3.51e-03 | 2.36e-02 | 44 |
| GO:000201111 | Endometrium | EEC | morphogenesis of an epithelial sheet | 14/2168 | 57/18723 | 4.65e-03 | 2.97e-02 | 14 |
| GO:004358814 | Endometrium | EEC | skin development | 45/2168 | 263/18723 | 4.69e-03 | 2.99e-02 | 45 |
| GO:00301991 | Endometrium | EEC | collagen fibril organization | 14/2168 | 61/18723 | 8.76e-03 | 4.74e-02 | 14 |
| GO:00435888 | Esophagus | ESCC | skin development | 163/8552 | 263/18723 | 6.48e-08 | 1.14e-06 | 163 |
| GO:004206027 | Esophagus | ESCC | wound healing | 243/8552 | 422/18723 | 4.62e-07 | 6.25e-06 | 243 |
| Page: 1 2 3 4 5 |
| Pathway ID | Tissue | Disease Stage | Description | Gene Ratio | Bg Ratio | pvalue | p.adjust | qvalue | Count |
| Page: 1 |
Top |
Cell-cell communication analysis |
| Identification of potential cell-cell interactions between two cell types and their ligand-receptor pairs for different disease states |
| Ligand | Receptor | LRpair | Pathway | Tissue | Disease Stage |
| Page: 1 |
Top |
Single-cell gene regulatory network inference analysis |
| Find out the significant the regulons (TFs) and the target genes of each regulon across cell types for different disease states |
| TF | Cell Type | Tissue | Disease Stage | Target Gene | RSS | Regulon Activity |
| ∗The dot plots of a searched regulon are shown for all cell subpopulations in each disease state of each tissue based on the regulon specific score inferred using pySCENIC and by calculating the average expression. |
| Page: 1 |
Top |
Somatic mutation of malignant transformation related genes |
| Annotation of somatic variants for genes involved in malignant transformation |
| Hugo Symbol | Variant Class | Variant Classification | dbSNP RS | HGVSc | HGVSp | HGVSp Short | SWISSPROT | BIOTYPE | SIFT | PolyPhen | Tumor Sample Barcode | Tissue | Histology | Sex | Age | Stage | Therapy Types | Drugs | Outcome |
| COL5A1 | SNV | Missense_Mutation | rs796151769 | c.4252N>T | p.Pro1418Ser | p.P1418S | P20908 | protein_coding | deleterious(0.02) | benign(0.253) | TCGA-A2-A3XV-01 | Breast | breast invasive carcinoma | Female | <65 | I/II | Chemotherapy | carboplatin | CR |
| COL5A1 | SNV | Missense_Mutation | c.1346N>T | p.Arg449Leu | p.R449L | P20908 | protein_coding | tolerated(0.3) | benign(0.006) | TCGA-A7-A0DB-01 | Breast | breast invasive carcinoma | Female | <65 | I/II | Hormone Therapy | arimidex | SD | |
| COL5A1 | SNV | Missense_Mutation | c.2839N>A | p.Glu947Lys | p.E947K | P20908 | protein_coding | deleterious(0.01) | probably_damaging(0.931) | TCGA-AC-A23H-01 | Breast | breast invasive carcinoma | Female | >=65 | I/II | Unknown | Unknown | PD | |
| COL5A1 | SNV | Missense_Mutation | novel | c.4450N>A | p.His1484Asn | p.H1484N | P20908 | protein_coding | deleterious(0) | probably_damaging(0.988) | TCGA-AN-A046-01 | Breast | breast invasive carcinoma | Female | >=65 | I/II | Unknown | Unknown | SD |
| COL5A1 | SNV | Missense_Mutation | rs775853003 | c.691C>T | p.Arg231Trp | p.R231W | P20908 | protein_coding | deleterious(0) | possibly_damaging(0.908) | TCGA-AN-A0AK-01 | Breast | breast invasive carcinoma | Female | >=65 | I/II | Unknown | Unknown | SD |
| COL5A1 | SNV | Missense_Mutation | c.448G>A | p.Glu150Lys | p.E150K | P20908 | protein_coding | tolerated(0.07) | probably_damaging(0.995) | TCGA-AO-A128-01 | Breast | breast invasive carcinoma | Female | <65 | I/II | Chemotherapy | doxorubicin | SD | |
| COL5A1 | SNV | Missense_Mutation | c.958A>G | p.Met320Val | p.M320V | P20908 | protein_coding | tolerated(0.72) | benign(0) | TCGA-AO-A128-01 | Breast | breast invasive carcinoma | Female | <65 | I/II | Chemotherapy | doxorubicin | SD | |
| COL5A1 | SNV | Missense_Mutation | novel | c.931N>T | p.Thr311Ser | p.T311S | P20908 | protein_coding | tolerated(0.73) | benign(0.009) | TCGA-AR-A2LO-01 | Breast | breast invasive carcinoma | Female | <65 | I/II | Chemotherapy | adriamycin | SD |
| COL5A1 | SNV | Missense_Mutation | c.3484N>A | p.Gly1162Arg | p.G1162R | P20908 | protein_coding | deleterious(0) | probably_damaging(0.999) | TCGA-BH-A18G-01 | Breast | breast invasive carcinoma | Female | >=65 | I/II | Unknown | Unknown | SD | |
| COL5A1 | SNV | Missense_Mutation | rs763650548 | c.1430C>T | p.Ala477Val | p.A477V | P20908 | protein_coding | tolerated(0.11) | probably_damaging(0.984) | TCGA-C8-A12Y-01 | Breast | breast invasive carcinoma | Female | <65 | I/II | Unknown | Unknown | SD |
| Page: 1 2 3 4 5 6 7 8 9 10 11 12 13 14 15 16 17 18 19 20 21 22 23 24 25 26 27 28 29 30 31 32 |
Top |
Related drugs of malignant transformation related genes |
| Identification of chemicals and drugs interact with genes involved in malignant transfromation |
| (DGIdb 4.0) |
| Entrez ID | Symbol | Category | Interaction Types | Drug Claim Name | Drug Name | PMIDs |
| 1289 | COL5A1 | DRUGGABLE GENOME | CHEMBL2095222 | OCRIPLASMIN | ||
| 1289 | COL5A1 | DRUGGABLE GENOME | CHEMBL2108709 | COLLAGENASE CLOSTRIDIUM HISTOLYTICUM |
| Page: 1 |

Copyright 2023-Present -The University of Texas Health Science Center at Houston |