| Tissue | Expression Dynamics | Abbreviation |
| Esophagus | 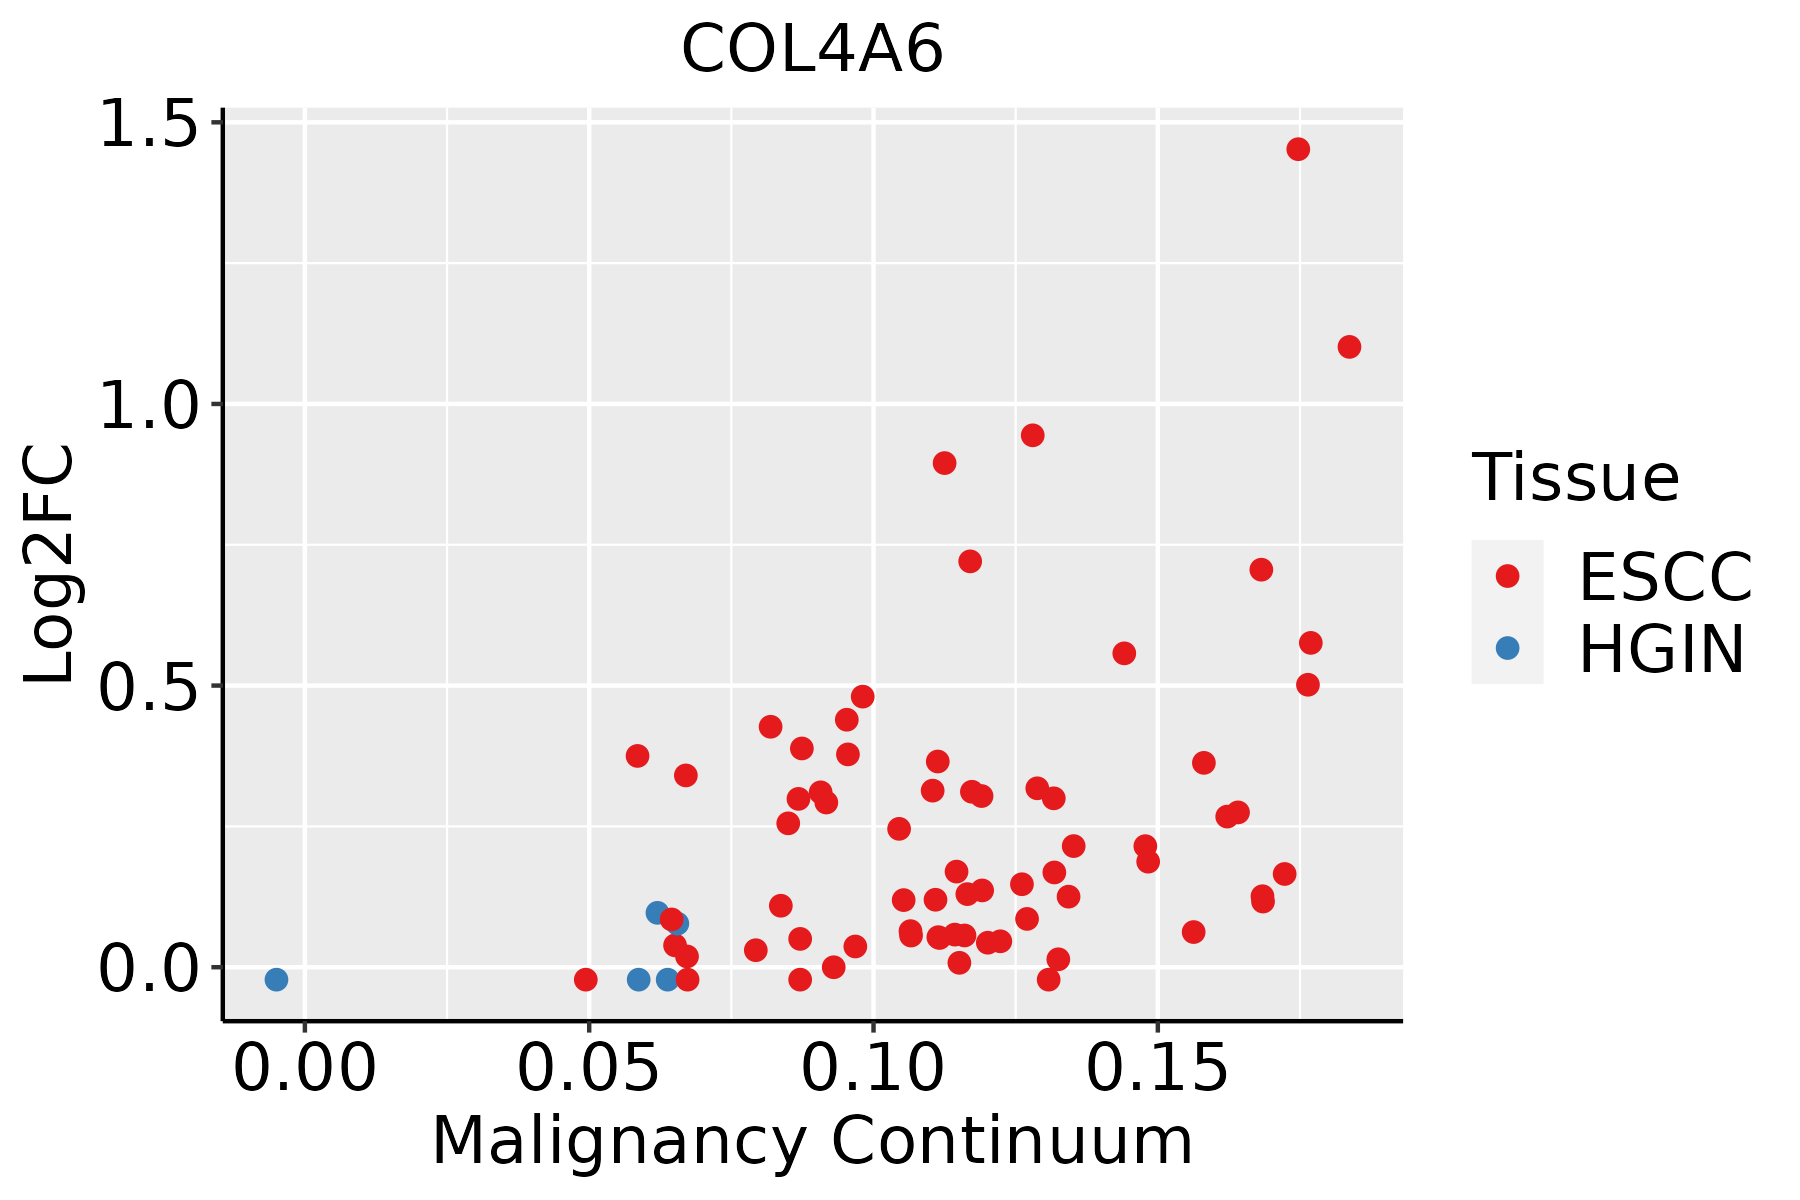 | ESCC: Esophageal squamous cell carcinoma |
| HGIN: High-grade intraepithelial neoplasias |
| LGIN: Low-grade intraepithelial neoplasias |
| Oral Cavity |  | EOLP: Erosive Oral lichen planus |
| LP: leukoplakia |
| NEOLP: Non-erosive oral lichen planus |
| OSCC: Oral squamous cell carcinoma |
| Prostate |  | BPH: Benign Prostatic Hyperplasia |
| Skin | 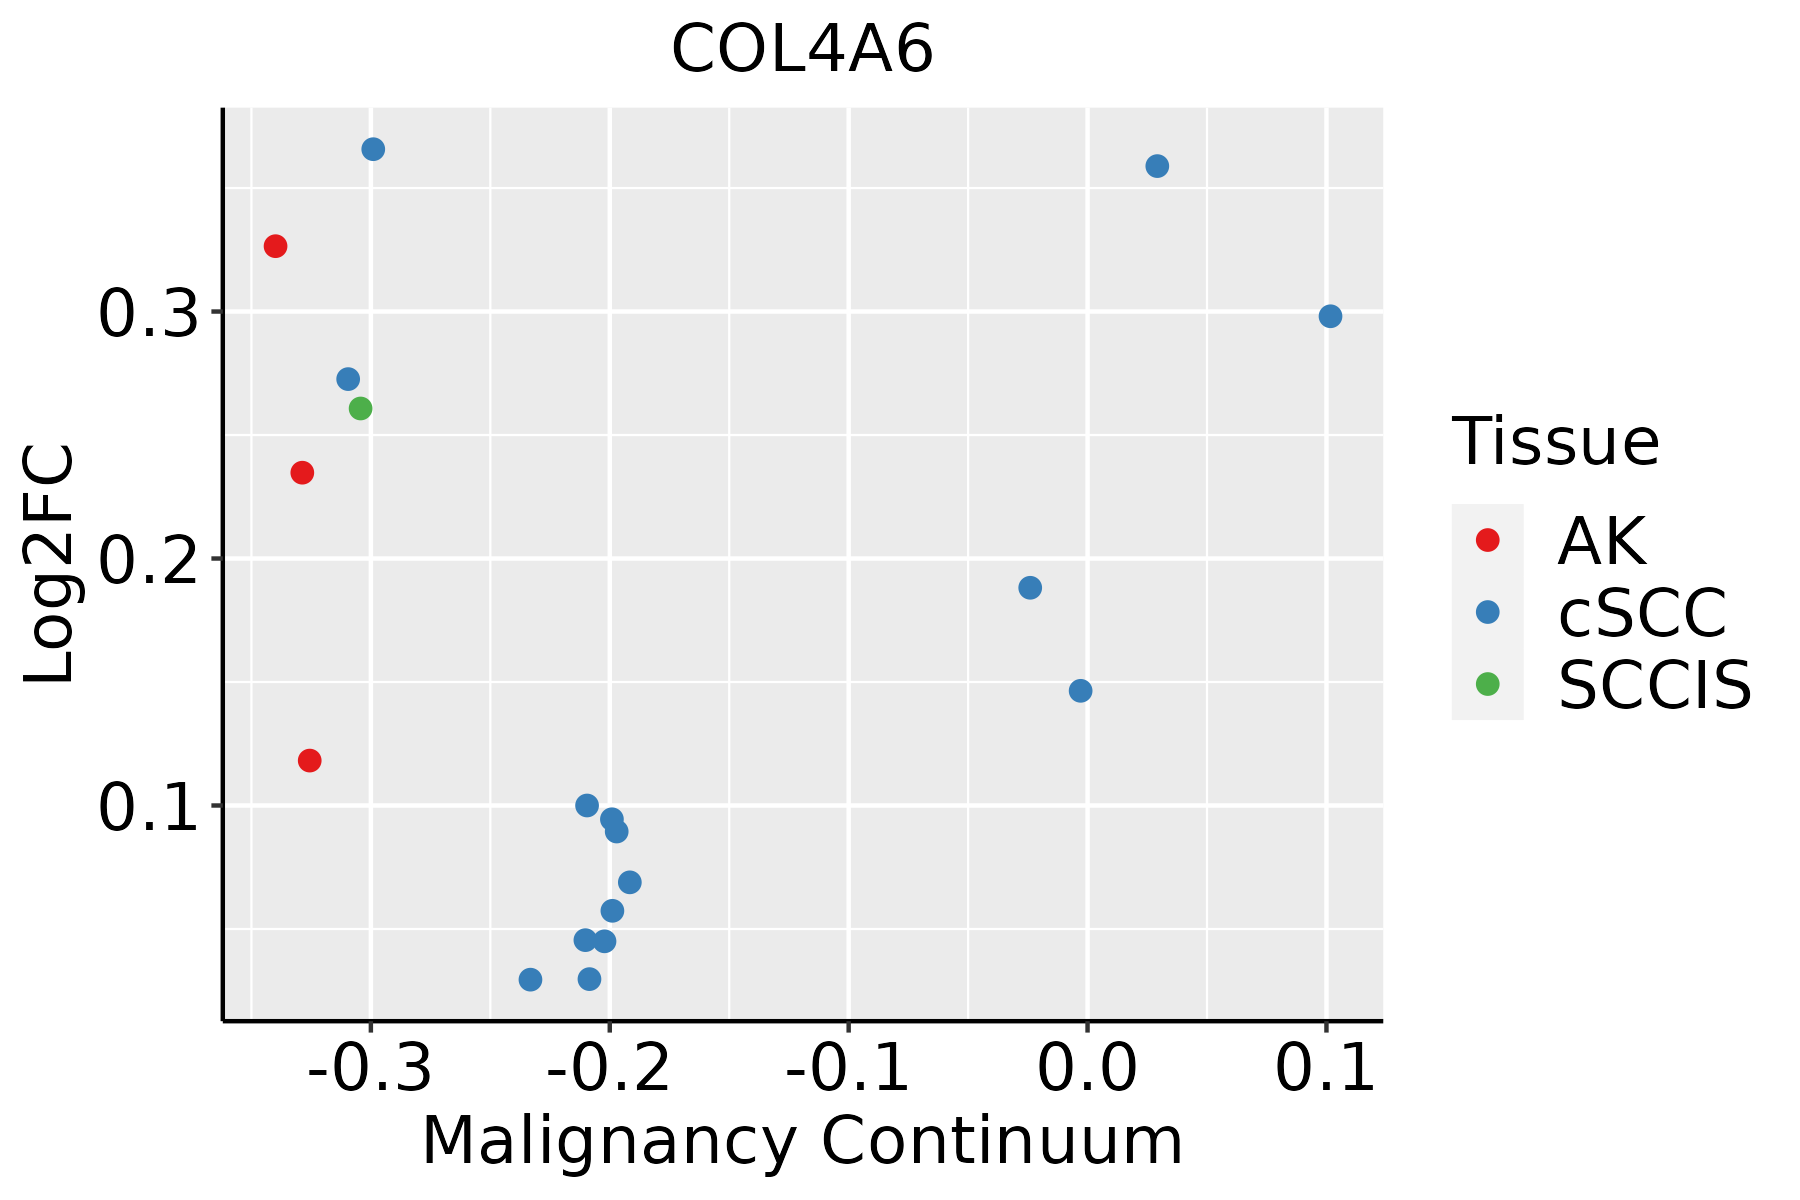 | AK: Actinic keratosis |
| cSCC: Cutaneous squamous cell carcinoma |
| SCCIS:squamous cell carcinoma in situ |
| GO ID | Tissue | Disease Stage | Description | Gene Ratio | Bg Ratio | pvalue | p.adjust | Count |
| GO:00301984 | Esophagus | ESCC | extracellular matrix organization | 171/8552 | 301/18723 | 6.08e-05 | 4.67e-04 | 171 |
| GO:00432007 | Esophagus | ESCC | response to amino acid | 74/8552 | 116/18723 | 6.23e-05 | 4.76e-04 | 74 |
| GO:000110110 | Esophagus | ESCC | response to acid chemical | 84/8552 | 135/18723 | 7.70e-05 | 5.74e-04 | 84 |
| GO:00430624 | Esophagus | ESCC | extracellular structure organization | 171/8552 | 302/18723 | 7.73e-05 | 5.76e-04 | 171 |
| GO:00452294 | Esophagus | ESCC | external encapsulating structure organization | 172/8552 | 304/18723 | 7.80e-05 | 5.80e-04 | 172 |
| GO:00712305 | Esophagus | ESCC | cellular response to amino acid stimulus | 48/8552 | 71/18723 | 1.55e-04 | 1.03e-03 | 48 |
| GO:00712296 | Esophagus | ESCC | cellular response to acid chemical | 52/8552 | 80/18723 | 3.79e-04 | 2.20e-03 | 52 |
| GO:00011019 | Oral cavity | OSCC | response to acid chemical | 74/7305 | 135/18723 | 1.38e-04 | 9.76e-04 | 74 |
| GO:00432006 | Oral cavity | OSCC | response to amino acid | 64/7305 | 116/18723 | 2.96e-04 | 1.86e-03 | 64 |
| GO:00712304 | Oral cavity | OSCC | cellular response to amino acid stimulus | 42/7305 | 71/18723 | 4.59e-04 | 2.76e-03 | 42 |
| GO:00301983 | Oral cavity | OSCC | extracellular matrix organization | 146/7305 | 301/18723 | 4.67e-04 | 2.77e-03 | 146 |
| GO:00452293 | Oral cavity | OSCC | external encapsulating structure organization | 147/7305 | 304/18723 | 5.30e-04 | 3.08e-03 | 147 |
| GO:00430623 | Oral cavity | OSCC | extracellular structure organization | 146/7305 | 302/18723 | 5.59e-04 | 3.23e-03 | 146 |
| GO:00712295 | Oral cavity | OSCC | cellular response to acid chemical | 46/7305 | 80/18723 | 6.08e-04 | 3.44e-03 | 46 |
| GO:00011018 | Prostate | BPH | response to acid chemical | 37/3107 | 135/18723 | 1.03e-03 | 6.46e-03 | 37 |
| GO:00712294 | Prostate | BPH | cellular response to acid chemical | 23/3107 | 80/18723 | 4.53e-03 | 2.19e-02 | 23 |
| GO:00430621 | Prostate | BPH | extracellular structure organization | 67/3107 | 302/18723 | 6.67e-03 | 3.00e-02 | 67 |
| GO:0038063 | Prostate | BPH | collagen-activated tyrosine kinase receptor signaling pathway | 6/3107 | 12/18723 | 7.73e-03 | 3.39e-02 | 6 |
| GO:00301981 | Prostate | BPH | extracellular matrix organization | 66/3107 | 301/18723 | 9.20e-03 | 3.92e-02 | 66 |
| GO:00712303 | Prostate | BPH | cellular response to amino acid stimulus | 20/3107 | 71/18723 | 9.89e-03 | 4.16e-02 | 20 |
| Pathway ID | Tissue | Disease Stage | Description | Gene Ratio | Bg Ratio | pvalue | p.adjust | qvalue | Count |
| hsa0516510 | Esophagus | ESCC | Human papillomavirus infection | 215/4205 | 331/8465 | 7.86e-09 | 7.12e-08 | 3.65e-08 | 215 |
| hsa052229 | Esophagus | ESCC | Small cell lung cancer | 69/4205 | 92/8465 | 5.40e-07 | 3.85e-06 | 1.97e-06 | 69 |
| hsa0493310 | Esophagus | ESCC | AGE-RAGE signaling pathway in diabetic complications | 72/4205 | 100/8465 | 4.15e-06 | 2.28e-05 | 1.17e-05 | 72 |
| hsa0451020 | Esophagus | ESCC | Focal adhesion | 127/4205 | 203/8465 | 1.25e-04 | 4.99e-04 | 2.56e-04 | 127 |
| hsa049268 | Esophagus | ESCC | Relaxin signaling pathway | 81/4205 | 129/8465 | 1.72e-03 | 5.09e-03 | 2.61e-03 | 81 |
| hsa041517 | Esophagus | ESCC | PI3K-Akt signaling pathway | 197/4205 | 354/8465 | 1.24e-02 | 2.83e-02 | 1.45e-02 | 197 |
| hsa0516515 | Esophagus | ESCC | Human papillomavirus infection | 215/4205 | 331/8465 | 7.86e-09 | 7.12e-08 | 3.65e-08 | 215 |
| hsa0522216 | Esophagus | ESCC | Small cell lung cancer | 69/4205 | 92/8465 | 5.40e-07 | 3.85e-06 | 1.97e-06 | 69 |
| hsa0493317 | Esophagus | ESCC | AGE-RAGE signaling pathway in diabetic complications | 72/4205 | 100/8465 | 4.15e-06 | 2.28e-05 | 1.17e-05 | 72 |
| hsa04510111 | Esophagus | ESCC | Focal adhesion | 127/4205 | 203/8465 | 1.25e-04 | 4.99e-04 | 2.56e-04 | 127 |
| hsa0492616 | Esophagus | ESCC | Relaxin signaling pathway | 81/4205 | 129/8465 | 1.72e-03 | 5.09e-03 | 2.61e-03 | 81 |
| hsa0415114 | Esophagus | ESCC | PI3K-Akt signaling pathway | 197/4205 | 354/8465 | 1.24e-02 | 2.83e-02 | 1.45e-02 | 197 |
| hsa051659 | Oral cavity | OSCC | Human papillomavirus infection | 200/3704 | 331/8465 | 3.83e-10 | 4.93e-09 | 2.51e-09 | 200 |
| hsa0451019 | Oral cavity | OSCC | Focal adhesion | 128/3704 | 203/8465 | 1.71e-08 | 1.63e-07 | 8.31e-08 | 128 |
| hsa052228 | Oral cavity | OSCC | Small cell lung cancer | 66/3704 | 92/8465 | 4.43e-08 | 3.38e-07 | 1.72e-07 | 66 |
| hsa049339 | Oral cavity | OSCC | AGE-RAGE signaling pathway in diabetic complications | 69/3704 | 100/8465 | 2.61e-07 | 1.65e-06 | 8.41e-07 | 69 |
| hsa041516 | Oral cavity | OSCC | PI3K-Akt signaling pathway | 185/3704 | 354/8465 | 6.26e-04 | 1.86e-03 | 9.49e-04 | 185 |
| hsa049267 | Oral cavity | OSCC | Relaxin signaling pathway | 74/3704 | 129/8465 | 1.20e-03 | 3.37e-03 | 1.72e-03 | 74 |
| hsa051468 | Oral cavity | OSCC | Amoebiasis | 59/3704 | 102/8465 | 2.78e-03 | 7.17e-03 | 3.65e-03 | 59 |
| hsa0516514 | Oral cavity | OSCC | Human papillomavirus infection | 200/3704 | 331/8465 | 3.83e-10 | 4.93e-09 | 2.51e-09 | 200 |
| Hugo Symbol | Variant Class | Variant Classification | dbSNP RS | HGVSc | HGVSp | HGVSp Short | SWISSPROT | BIOTYPE | SIFT | PolyPhen | Tumor Sample Barcode | Tissue | Histology | Sex | Age | Stage | Therapy Types | Drugs | Outcome |
| COL4A6 | SNV | Missense_Mutation | novel | c.2647N>C | p.Gly883Arg | p.G883R | | protein_coding | deleterious(0) | probably_damaging(1) | TCGA-A2-A3Y0-01 | Breast | breast invasive carcinoma | Female | <65 | I/II | Chemotherapy | adriamycin | CR |
| COL4A6 | SNV | Missense_Mutation | novel | c.3239N>C | p.Leu1080Pro | p.L1080P | | protein_coding | tolerated(0.35) | benign(0.332) | TCGA-A7-A6VX-01 | Breast | breast invasive carcinoma | Female | >=65 | I/II | Chemotherapy | docetaxel | CR |
| COL4A6 | SNV | Missense_Mutation | | c.1876N>A | p.Pro626Thr | p.P626T | | protein_coding | tolerated(0.19) | benign(0.033) | TCGA-A8-A08H-01 | Breast | breast invasive carcinoma | Female | >=65 | I/II | Unknown | Unknown | SD |
| COL4A6 | SNV | Missense_Mutation | | c.1076N>G | p.Asn359Ser | p.N359S | | protein_coding | tolerated(0.41) | benign(0.001) | TCGA-A8-A09G-01 | Breast | breast invasive carcinoma | Female | >=65 | III/IV | Unknown | Unknown | SD |
| COL4A6 | SNV | Missense_Mutation | novel | c.4554G>T | p.Glu1518Asp | p.E1518D | | protein_coding | deleterious(0.02) | probably_damaging(0.998) | TCGA-AN-A046-01 | Breast | breast invasive carcinoma | Female | >=65 | I/II | Unknown | Unknown | SD |
| COL4A6 | SNV | Missense_Mutation | | c.1099N>T | p.Gly367Cys | p.G367C | | protein_coding | deleterious(0) | probably_damaging(0.986) | TCGA-BH-A1F2-01 | Breast | breast invasive carcinoma | Female | <65 | III/IV | Unknown | Unknown | SD |
| COL4A6 | SNV | Missense_Mutation | | c.3721N>G | p.Arg1241Gly | p.R1241G | | protein_coding | deleterious(0.03) | possibly_damaging(0.852) | TCGA-C8-A1HN-01 | Breast | breast invasive carcinoma | Female | <65 | I/II | Unknown | Unknown | SD |
| COL4A6 | SNV | Missense_Mutation | | c.4832G>T | p.Arg1611Leu | p.R1611L | | protein_coding | deleterious(0) | probably_damaging(0.96) | TCGA-D8-A27K-01 | Breast | breast invasive carcinoma | Female | <65 | I/II | Chemotherapy | adriamycin+cyclophosphamid | SD |
| COL4A6 | SNV | Missense_Mutation | | c.4261N>G | p.Leu1421Val | p.L1421V | | protein_coding | tolerated(0.25) | possibly_damaging(0.852) | TCGA-E2-A1LH-01 | Breast | breast invasive carcinoma | Female | <65 | I/II | Chemotherapy | adriamycin | SD |
| COL4A6 | SNV | Missense_Mutation | rs768504005 | c.4440N>A | p.Met1480Ile | p.M1480I | | protein_coding | tolerated(0.14) | benign(0.039) | TCGA-E2-A2P6-01 | Breast | breast invasive carcinoma | Female | >=65 | I/II | Hormone Therapy | anastrozole | SD |


