| Tissue | Expression Dynamics | Abbreviation |
| Esophagus | 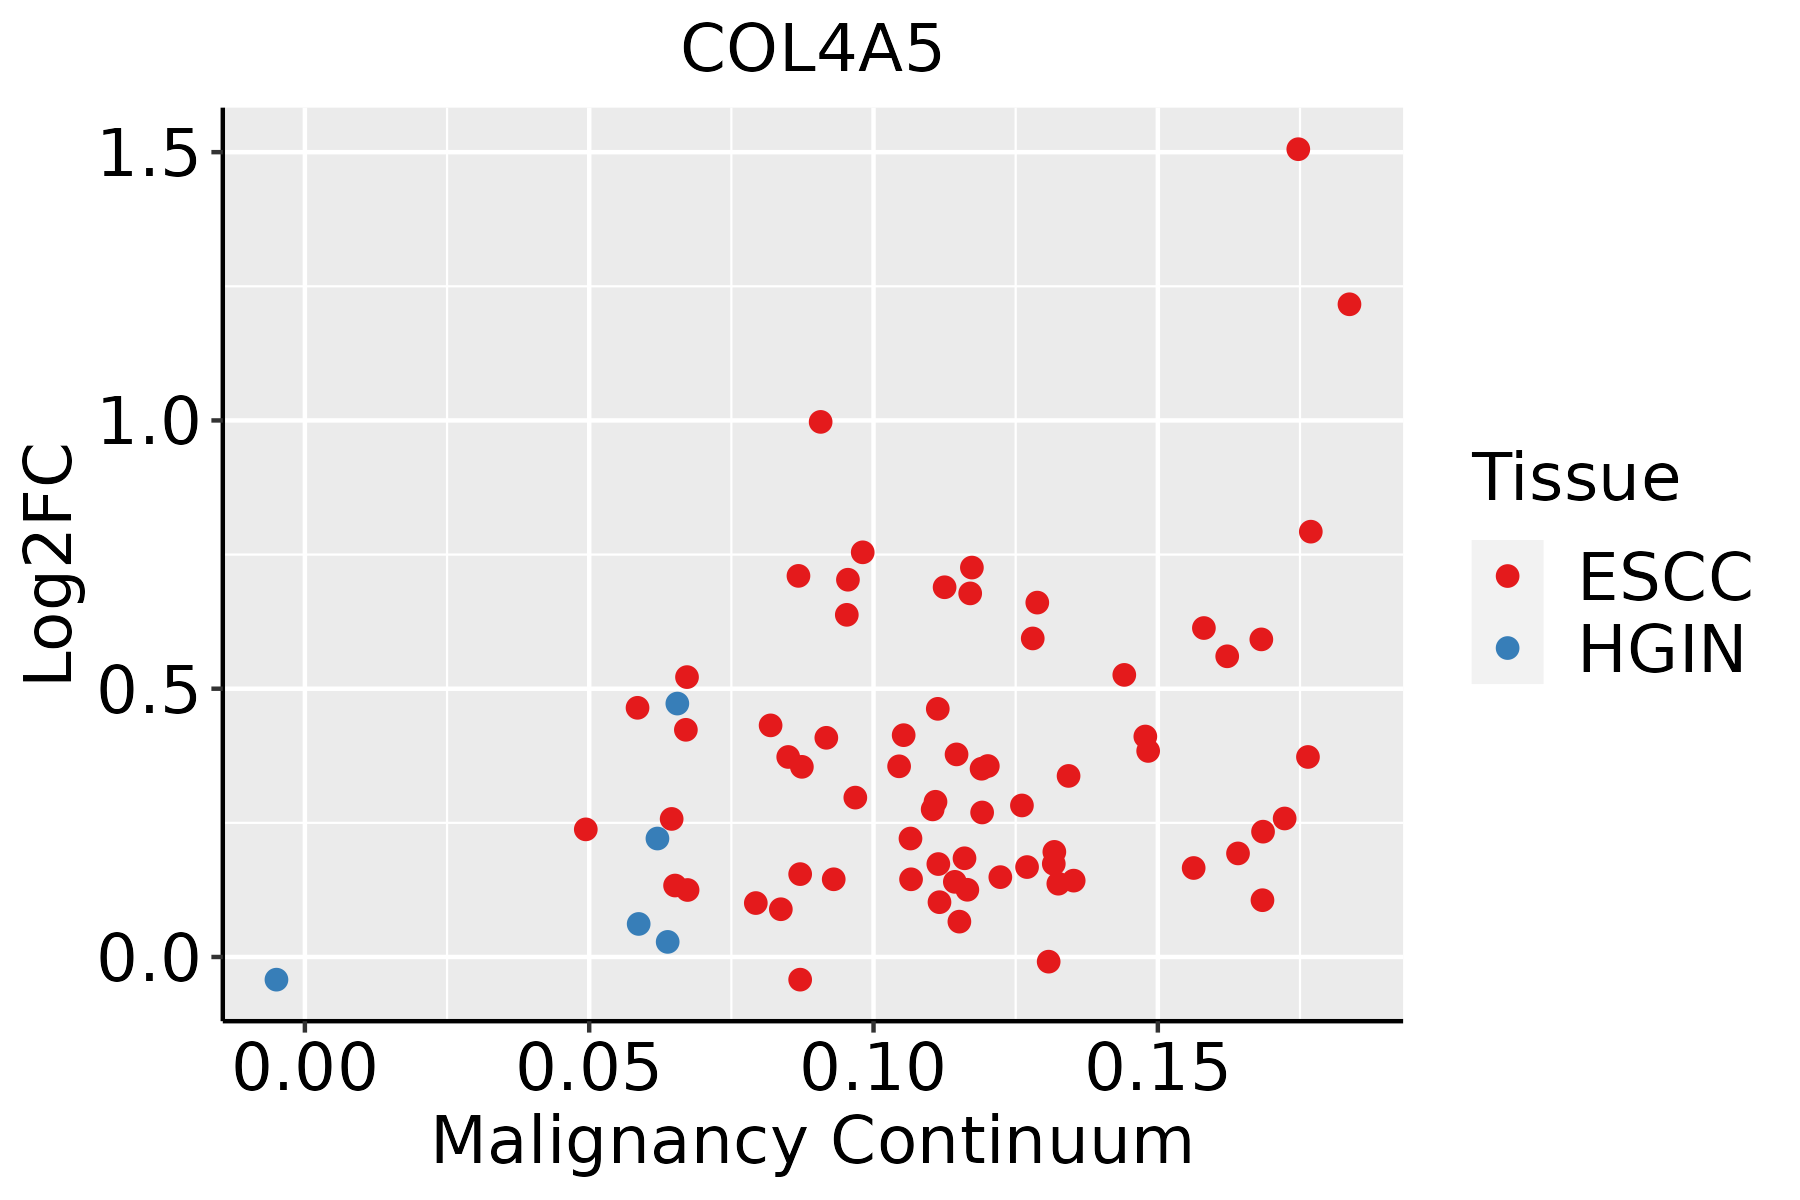 | ESCC: Esophageal squamous cell carcinoma |
| HGIN: High-grade intraepithelial neoplasias |
| LGIN: Low-grade intraepithelial neoplasias |
| Lung | 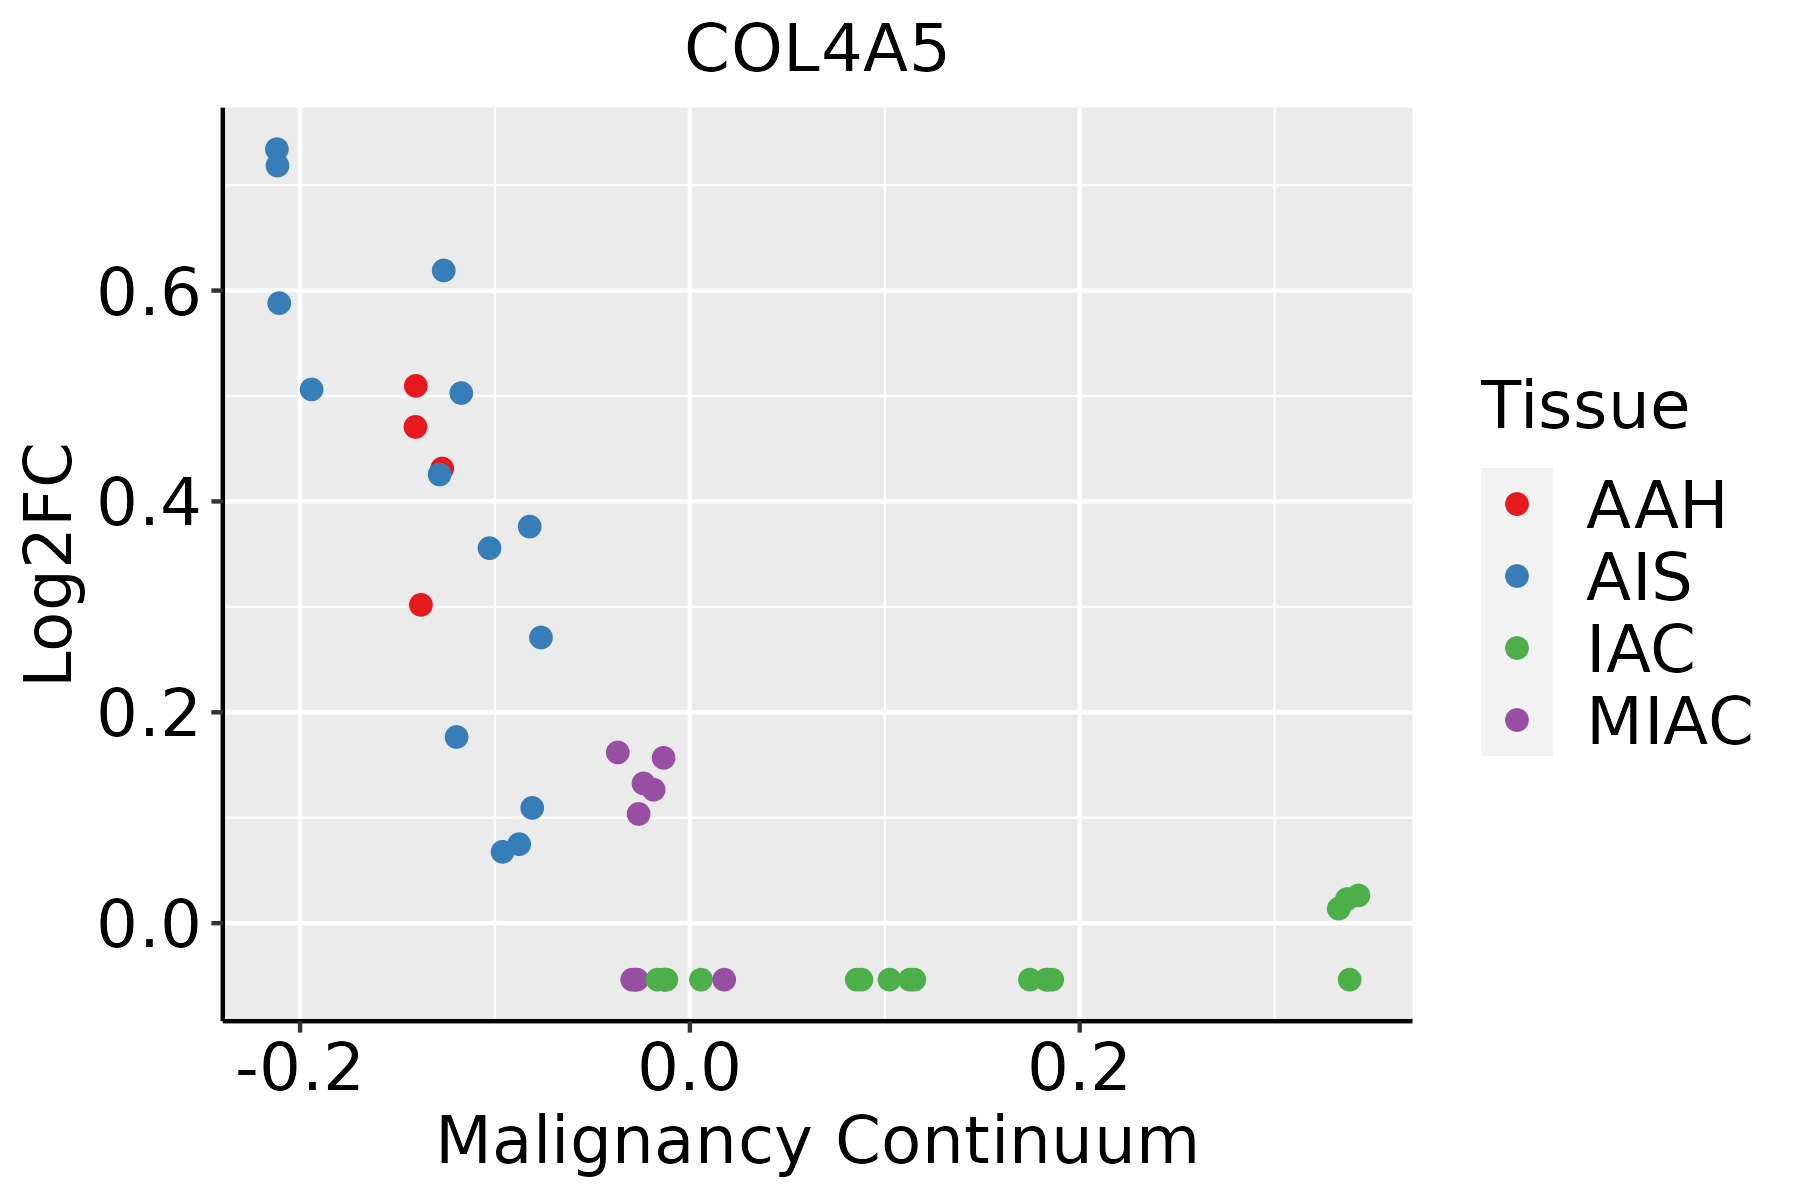 | AAH: Atypical adenomatous hyperplasia |
| AIS: Adenocarcinoma in situ |
| IAC: Invasive lung adenocarcinoma |
| MIA: Minimally invasive adenocarcinoma |
| Oral Cavity | 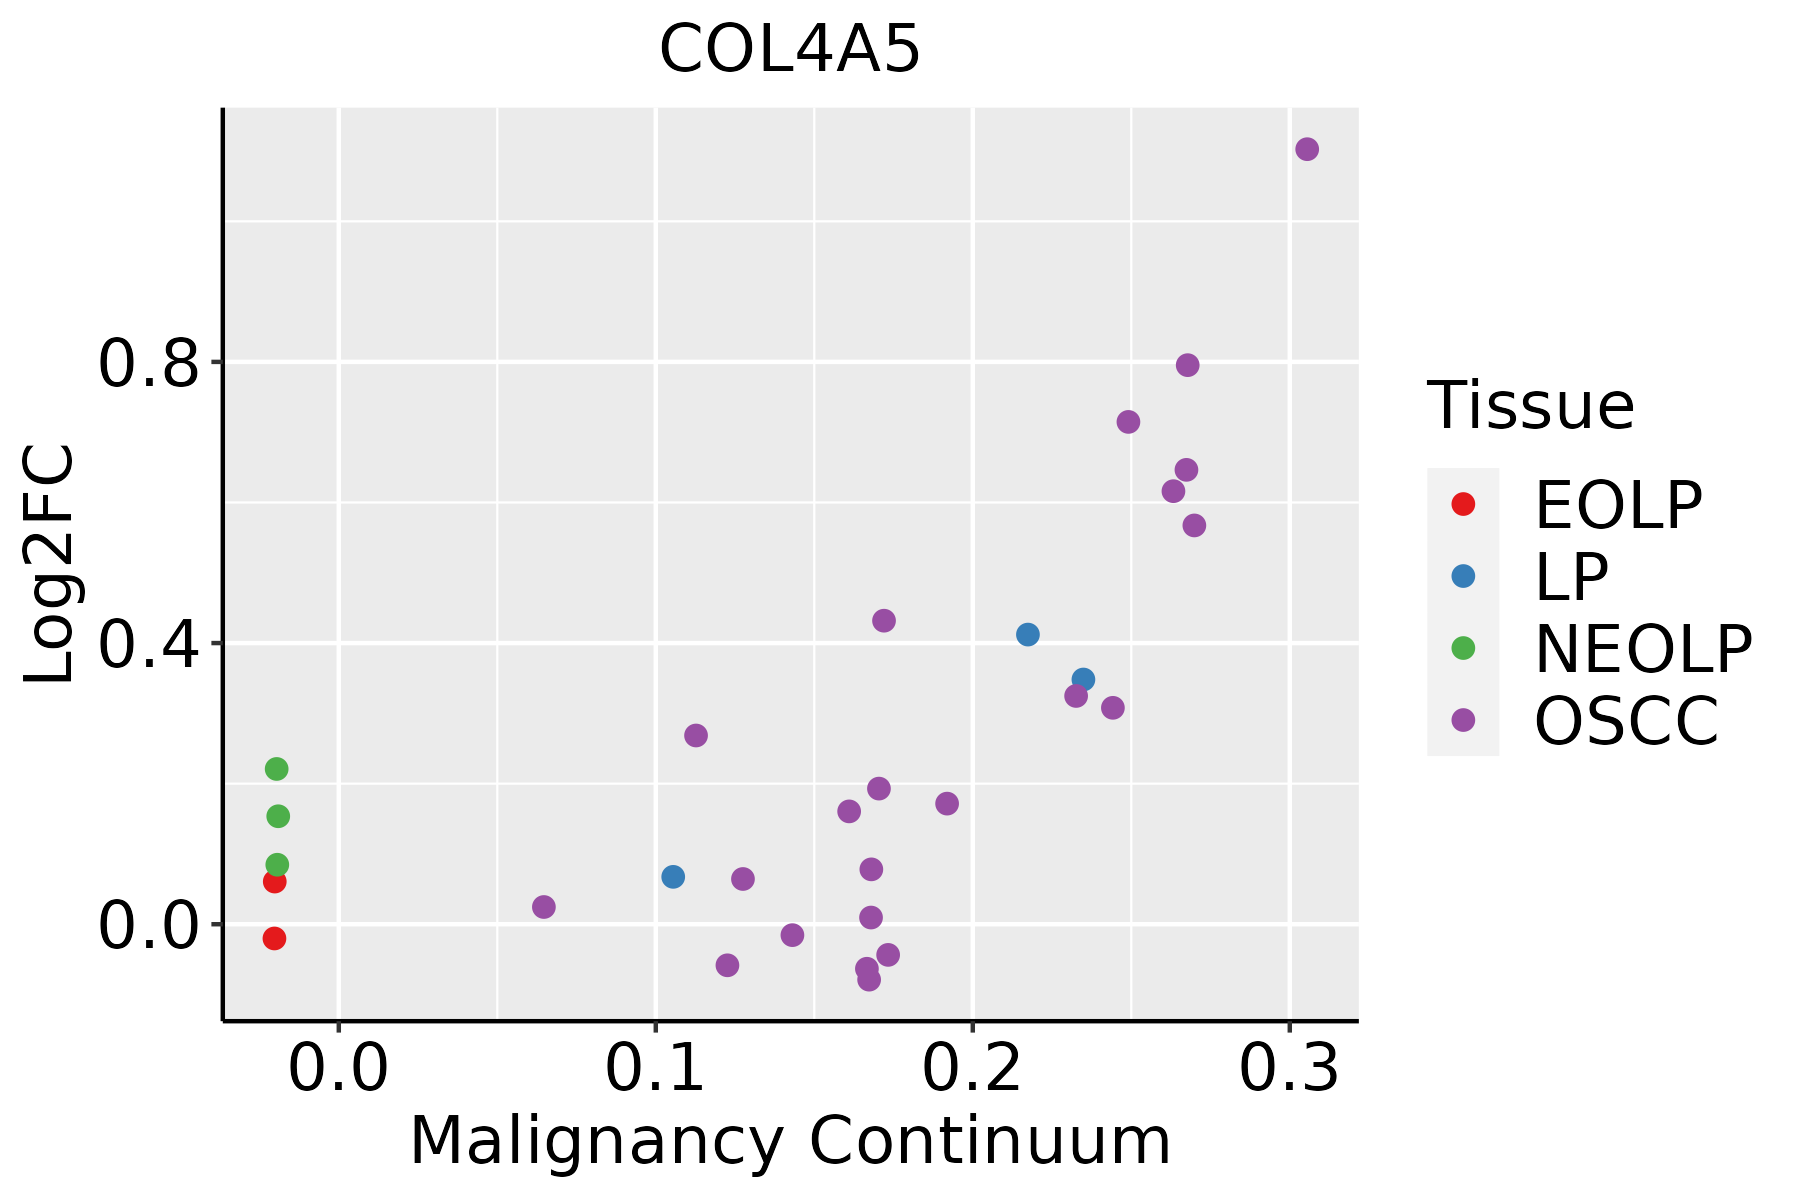 | EOLP: Erosive Oral lichen planus |
| LP: leukoplakia |
| NEOLP: Non-erosive oral lichen planus |
| OSCC: Oral squamous cell carcinoma |
| Prostate | 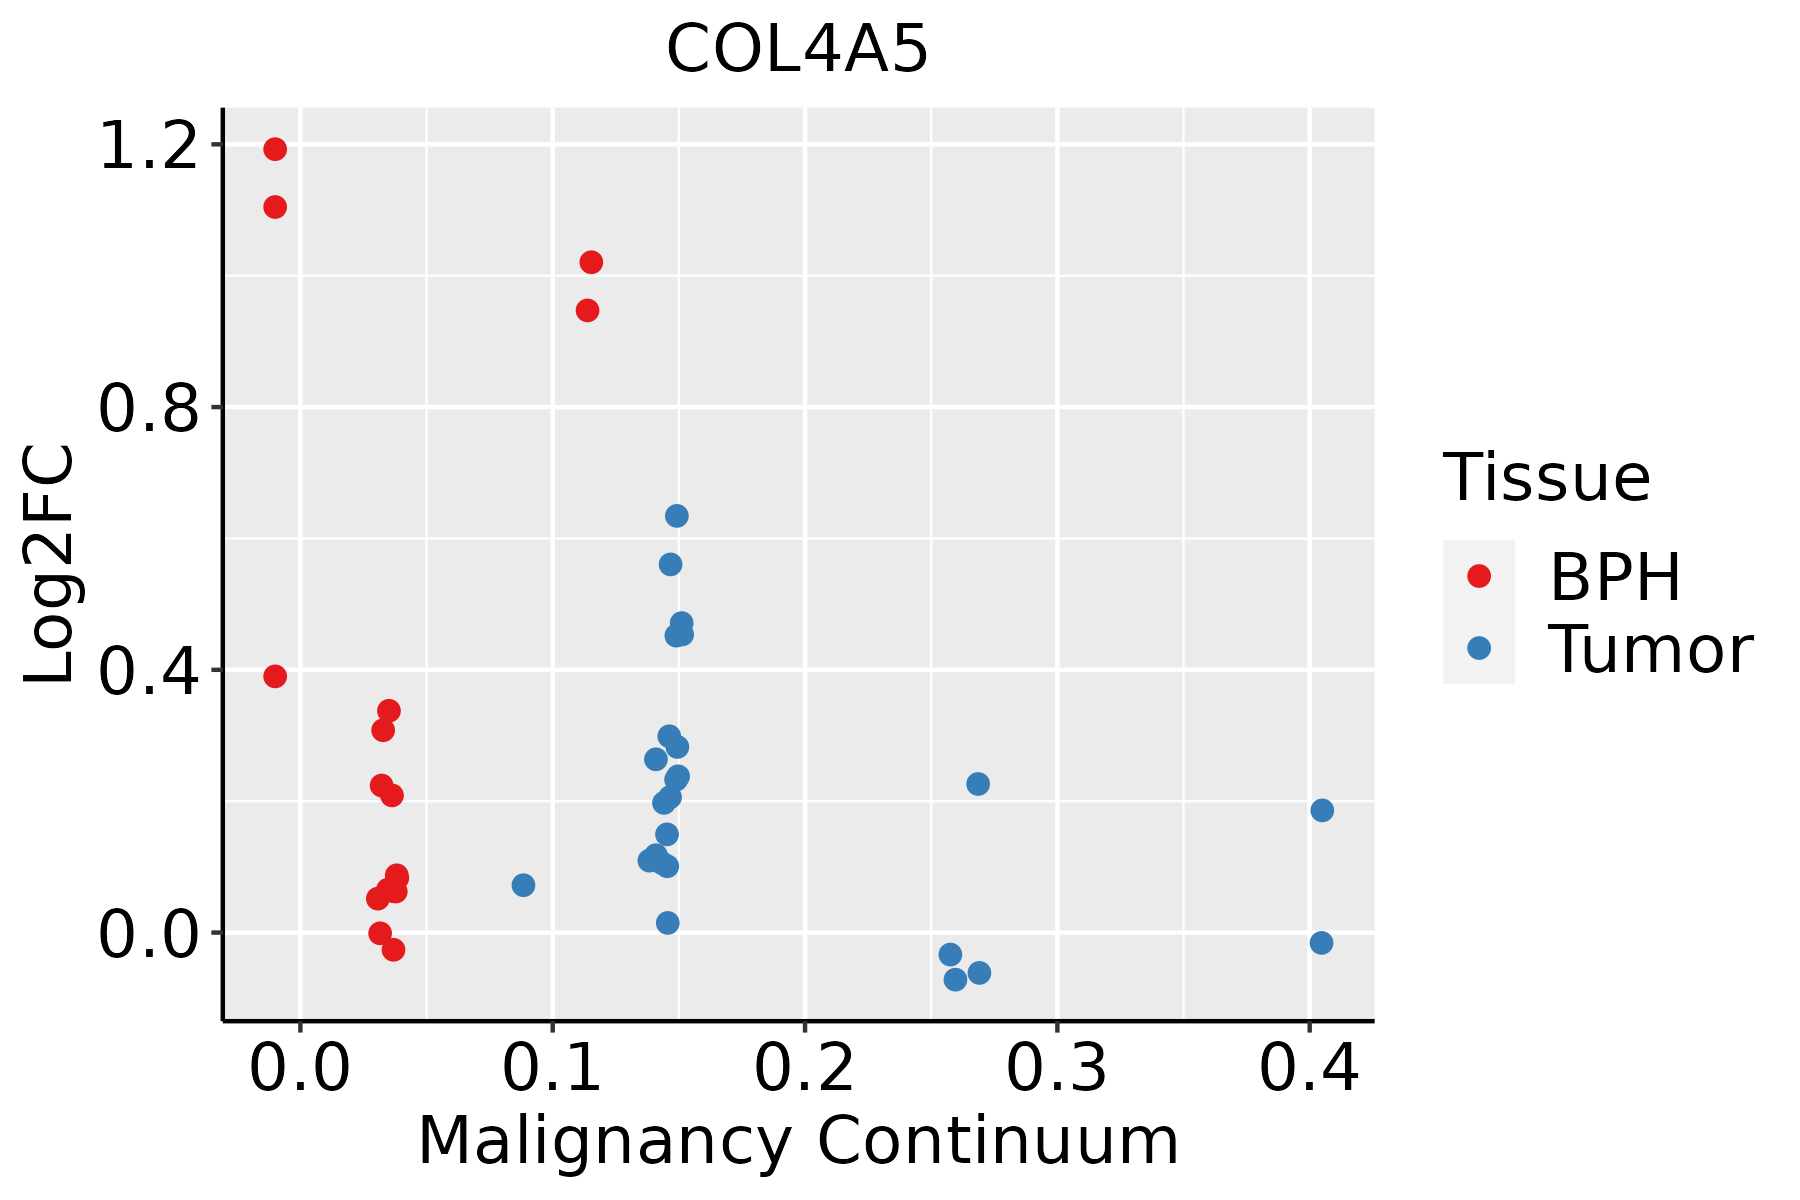 | BPH: Benign Prostatic Hyperplasia |
| Skin |  | AK: Actinic keratosis |
| cSCC: Cutaneous squamous cell carcinoma |
| SCCIS:squamous cell carcinoma in situ |
| GO ID | Tissue | Disease Stage | Description | Gene Ratio | Bg Ratio | pvalue | p.adjust | Count |
| GO:00301984 | Esophagus | ESCC | extracellular matrix organization | 171/8552 | 301/18723 | 6.08e-05 | 4.67e-04 | 171 |
| GO:00430624 | Esophagus | ESCC | extracellular structure organization | 171/8552 | 302/18723 | 7.73e-05 | 5.76e-04 | 171 |
| GO:00452294 | Esophagus | ESCC | external encapsulating structure organization | 172/8552 | 304/18723 | 7.80e-05 | 5.80e-04 | 172 |
| GO:005080811 | Lung | AIS | synapse organization | 63/1849 | 426/18723 | 7.39e-04 | 1.07e-02 | 63 |
| GO:00301983 | Oral cavity | OSCC | extracellular matrix organization | 146/7305 | 301/18723 | 4.67e-04 | 2.77e-03 | 146 |
| GO:00452293 | Oral cavity | OSCC | external encapsulating structure organization | 147/7305 | 304/18723 | 5.30e-04 | 3.08e-03 | 147 |
| GO:00430623 | Oral cavity | OSCC | extracellular structure organization | 146/7305 | 302/18723 | 5.59e-04 | 3.23e-03 | 146 |
| GO:00301982 | Oral cavity | NEOLP | extracellular matrix organization | 64/2005 | 301/18723 | 5.66e-08 | 2.24e-06 | 64 |
| GO:00430622 | Oral cavity | NEOLP | extracellular structure organization | 64/2005 | 302/18723 | 6.44e-08 | 2.50e-06 | 64 |
| GO:00452292 | Oral cavity | NEOLP | external encapsulating structure organization | 64/2005 | 304/18723 | 8.33e-08 | 3.17e-06 | 64 |
| GO:00508087 | Prostate | BPH | synapse organization | 103/3107 | 426/18723 | 3.19e-05 | 3.61e-04 | 103 |
| GO:00430621 | Prostate | BPH | extracellular structure organization | 67/3107 | 302/18723 | 6.67e-03 | 3.00e-02 | 67 |
| GO:0038063 | Prostate | BPH | collagen-activated tyrosine kinase receptor signaling pathway | 6/3107 | 12/18723 | 7.73e-03 | 3.39e-02 | 6 |
| GO:00301981 | Prostate | BPH | extracellular matrix organization | 66/3107 | 301/18723 | 9.20e-03 | 3.92e-02 | 66 |
| GO:00452291 | Prostate | BPH | external encapsulating structure organization | 66/3107 | 304/18723 | 1.15e-02 | 4.66e-02 | 66 |
| GO:005080813 | Prostate | Tumor | synapse organization | 105/3246 | 426/18723 | 7.20e-05 | 7.62e-04 | 105 |
| GO:00508088 | Skin | AK | synapse organization | 71/1910 | 426/18723 | 2.21e-05 | 4.07e-04 | 71 |
| GO:005080814 | Skin | SCCIS | synapse organization | 42/919 | 426/18723 | 1.43e-05 | 4.70e-04 | 42 |
| GO:00301985 | Skin | SCCIS | extracellular matrix organization | 32/919 | 301/18723 | 3.46e-05 | 9.17e-04 | 32 |
| GO:00430625 | Skin | SCCIS | extracellular structure organization | 32/919 | 302/18723 | 3.69e-05 | 9.65e-04 | 32 |
| Pathway ID | Tissue | Disease Stage | Description | Gene Ratio | Bg Ratio | pvalue | p.adjust | qvalue | Count |
| hsa0516510 | Esophagus | ESCC | Human papillomavirus infection | 215/4205 | 331/8465 | 7.86e-09 | 7.12e-08 | 3.65e-08 | 215 |
| hsa052229 | Esophagus | ESCC | Small cell lung cancer | 69/4205 | 92/8465 | 5.40e-07 | 3.85e-06 | 1.97e-06 | 69 |
| hsa0493310 | Esophagus | ESCC | AGE-RAGE signaling pathway in diabetic complications | 72/4205 | 100/8465 | 4.15e-06 | 2.28e-05 | 1.17e-05 | 72 |
| hsa0451020 | Esophagus | ESCC | Focal adhesion | 127/4205 | 203/8465 | 1.25e-04 | 4.99e-04 | 2.56e-04 | 127 |
| hsa049268 | Esophagus | ESCC | Relaxin signaling pathway | 81/4205 | 129/8465 | 1.72e-03 | 5.09e-03 | 2.61e-03 | 81 |
| hsa041517 | Esophagus | ESCC | PI3K-Akt signaling pathway | 197/4205 | 354/8465 | 1.24e-02 | 2.83e-02 | 1.45e-02 | 197 |
| hsa0516515 | Esophagus | ESCC | Human papillomavirus infection | 215/4205 | 331/8465 | 7.86e-09 | 7.12e-08 | 3.65e-08 | 215 |
| hsa0522216 | Esophagus | ESCC | Small cell lung cancer | 69/4205 | 92/8465 | 5.40e-07 | 3.85e-06 | 1.97e-06 | 69 |
| hsa0493317 | Esophagus | ESCC | AGE-RAGE signaling pathway in diabetic complications | 72/4205 | 100/8465 | 4.15e-06 | 2.28e-05 | 1.17e-05 | 72 |
| hsa04510111 | Esophagus | ESCC | Focal adhesion | 127/4205 | 203/8465 | 1.25e-04 | 4.99e-04 | 2.56e-04 | 127 |
| hsa0492616 | Esophagus | ESCC | Relaxin signaling pathway | 81/4205 | 129/8465 | 1.72e-03 | 5.09e-03 | 2.61e-03 | 81 |
| hsa0415114 | Esophagus | ESCC | PI3K-Akt signaling pathway | 197/4205 | 354/8465 | 1.24e-02 | 2.83e-02 | 1.45e-02 | 197 |
| hsa0451022 | Lung | AIS | Focal adhesion | 57/961 | 203/8465 | 3.17e-11 | 3.43e-09 | 2.19e-09 | 57 |
| hsa0516521 | Lung | AIS | Human papillomavirus infection | 64/961 | 331/8465 | 1.03e-05 | 3.04e-04 | 1.95e-04 | 64 |
| hsa0522221 | Lung | AIS | Small cell lung cancer | 21/961 | 92/8465 | 1.23e-03 | 9.02e-03 | 5.77e-03 | 21 |
| hsa045122 | Lung | AIS | ECM-receptor interaction | 20/961 | 89/8465 | 1.95e-03 | 1.26e-02 | 8.09e-03 | 20 |
| hsa0415121 | Lung | AIS | PI3K-Akt signaling pathway | 57/961 | 354/8465 | 3.72e-03 | 2.00e-02 | 1.28e-02 | 57 |
| hsa0492621 | Lung | AIS | Relaxin signaling pathway | 25/961 | 129/8465 | 4.95e-03 | 2.47e-02 | 1.58e-02 | 25 |
| hsa0514621 | Lung | AIS | Amoebiasis | 20/961 | 102/8465 | 9.86e-03 | 4.20e-02 | 2.69e-02 | 20 |
| hsa0451032 | Lung | AIS | Focal adhesion | 57/961 | 203/8465 | 3.17e-11 | 3.43e-09 | 2.19e-09 | 57 |
| Hugo Symbol | Variant Class | Variant Classification | dbSNP RS | HGVSc | HGVSp | HGVSp Short | SWISSPROT | BIOTYPE | SIFT | PolyPhen | Tumor Sample Barcode | Tissue | Histology | Sex | Age | Stage | Therapy Types | Drugs | Outcome |
| COL4A5 | SNV | Missense_Mutation | | c.1843N>A | p.Gly615Arg | p.G615R | P29400 | protein_coding | deleterious(0) | probably_damaging(1) | TCGA-A8-A0A1-01 | Breast | breast invasive carcinoma | Female | >=65 | I/II | Hormone Therapy | tamoxiphen | SD |
| COL4A5 | SNV | Missense_Mutation | rs757706609 | c.3932N>T | p.Pro1311Leu | p.P1311L | P29400 | protein_coding | deleterious(0.02) | possibly_damaging(0.463) | TCGA-AC-A23H-01 | Breast | breast invasive carcinoma | Female | >=65 | I/II | Unknown | Unknown | PD |
| COL4A5 | SNV | Missense_Mutation | rs750941179 | c.4847N>T | p.Ser1616Leu | p.S1616L | P29400 | protein_coding | deleterious(0) | probably_damaging(0.996) | TCGA-AC-A23H-01 | Breast | breast invasive carcinoma | Female | >=65 | I/II | Unknown | Unknown | PD |
| COL4A5 | SNV | Missense_Mutation | novel | c.2129N>A | p.Gly710Glu | p.G710E | P29400 | protein_coding | deleterious(0) | probably_damaging(1) | TCGA-AC-A8OP-01 | Breast | breast invasive carcinoma | Female | >=65 | I/II | Unknown | Unknown | SD |
| COL4A5 | SNV | Missense_Mutation | rs866974052 | c.746G>A | p.Arg249Lys | p.R249K | P29400 | protein_coding | tolerated(0.93) | benign(0.085) | TCGA-AN-A046-01 | Breast | breast invasive carcinoma | Female | >=65 | I/II | Unknown | Unknown | SD |
| COL4A5 | SNV | Missense_Mutation | novel | c.4237G>A | p.Asp1413Asn | p.D1413N | P29400 | protein_coding | tolerated(0.46) | benign(0.189) | TCGA-AN-A046-01 | Breast | breast invasive carcinoma | Female | >=65 | I/II | Unknown | Unknown | SD |
| COL4A5 | SNV | Missense_Mutation | novel | c.4575N>A | p.Met1525Ile | p.M1525I | P29400 | protein_coding | deleterious(0.03) | probably_damaging(0.91) | TCGA-AN-A04D-01 | Breast | breast invasive carcinoma | Female | <65 | I/II | Unknown | Unknown | SD |
| COL4A5 | SNV | Missense_Mutation | | c.4093N>T | p.Pro1365Ser | p.P1365S | P29400 | protein_coding | tolerated(0.06) | probably_damaging(0.998) | TCGA-AN-A0XN-01 | Breast | breast invasive carcinoma | Female | >=65 | III/IV | Unknown | Unknown | SD |
| COL4A5 | SNV | Missense_Mutation | | c.4052G>T | p.Gly1351Val | p.G1351V | P29400 | protein_coding | deleterious(0) | probably_damaging(1) | TCGA-BH-A0DK-01 | Breast | breast invasive carcinoma | Female | <65 | I/II | Hormone Therapy | tamoxiphen | SD |
| COL4A5 | SNV | Missense_Mutation | novel | c.4219C>T | p.Pro1407Ser | p.P1407S | P29400 | protein_coding | tolerated(0.33) | benign(0.005) | TCGA-BH-A0HF-01 | Breast | breast invasive carcinoma | Female | >=65 | I/II | Hormone Therapy | arimidex | SD |


