
|
|||||
|
 | |
| |
| |
| |
| |
| |
|
Gene: COL4A4 |
Gene summary for COL4A4 |
| Gene information | Species | Human | Gene symbol | COL4A4 | Gene ID | 1286 |
| Gene name | collagen type IV alpha 4 chain | |
| Gene Alias | ATS2 | |
| Cytomap | 2q36.3 | |
| Gene Type | protein-coding | GO ID | GO:0001655 | UniProtAcc | P53420 |
Top |
Malignant transformation analysis |
| Identification of the aberrant gene expression in precancerous and cancerous lesions by comparing the gene expression of stem-like cells in diseased tissues with normal stem cells |
| Entrez ID | Symbol | Replicates | Species | Organ | Tissue | Adj P-value | Log2FC | Malignancy |
| 1286 | COL4A4 | RNA-P10T2-P10T2-3 | Human | Lung | AAH | 5.45e-03 | 6.60e-01 | -0.1408 |
| 1286 | COL4A4 | RNA-P25T1-P25T1-1 | Human | Lung | AIS | 4.10e-22 | 8.62e-01 | -0.2116 |
| 1286 | COL4A4 | RNA-P25T1-P25T1-2 | Human | Lung | AIS | 1.14e-07 | 7.07e-01 | -0.1941 |
| 1286 | COL4A4 | RNA-P25T1-P25T1-3 | Human | Lung | AIS | 6.00e-07 | 7.31e-01 | -0.2107 |
| 1286 | COL4A4 | RNA-P25T1-P25T1-4 | Human | Lung | AIS | 1.36e-16 | 7.34e-01 | -0.2119 |
| 1286 | COL4A4 | RNA-P6T1-P6T1-1 | Human | Lung | MIAC | 5.46e-03 | 7.34e-01 | -0.0238 |
| 1286 | COL4A4 | RNA-P6T2-P6T2-1 | Human | Lung | IAC | 5.66e-20 | 6.53e-01 | -0.0166 |
| 1286 | COL4A4 | RNA-P6T2-P6T2-2 | Human | Lung | IAC | 6.41e-21 | 5.96e-01 | -0.0132 |
| 1286 | COL4A4 | RNA-P6T2-P6T2-3 | Human | Lung | IAC | 1.70e-24 | 6.34e-01 | -0.013 |
| 1286 | COL4A4 | RNA-P6T2-P6T2-4 | Human | Lung | IAC | 7.77e-20 | 6.21e-01 | -0.0121 |
| 1286 | COL4A4 | RNA-P7T1-P7T1-1 | Human | Lung | AIS | 6.05e-09 | 7.13e-01 | -0.0961 |
| 1286 | COL4A4 | RNA-P7T1-P7T1-2 | Human | Lung | AIS | 9.99e-03 | 4.89e-01 | -0.0876 |
| 1286 | COL4A4 | RNA-P7T1-P7T1-3 | Human | Lung | AIS | 1.75e-05 | 7.03e-01 | -0.0822 |
| 1286 | COL4A4 | RNA-P7T1-P7T1-4 | Human | Lung | AIS | 1.77e-03 | 4.66e-01 | -0.0809 |
| 1286 | COL4A4 | male-WTA | Human | Thyroid | PTC | 1.20e-06 | 9.99e-02 | 0.1037 |
| 1286 | COL4A4 | PTC01 | Human | Thyroid | PTC | 1.01e-09 | 6.55e-02 | 0.1899 |
| 1286 | COL4A4 | PTC03 | Human | Thyroid | PTC | 1.16e-02 | 2.46e-01 | 0.1784 |
| 1286 | COL4A4 | PTC04 | Human | Thyroid | PTC | 1.67e-23 | 4.16e-01 | 0.1927 |
| 1286 | COL4A4 | PTC05 | Human | Thyroid | PTC | 2.28e-09 | 5.50e-01 | 0.2065 |
| 1286 | COL4A4 | PTC06 | Human | Thyroid | PTC | 7.64e-27 | 5.79e-01 | 0.2057 |
| Page: 1 2 |
| Tissue | Expression Dynamics | Abbreviation |
| Lung | 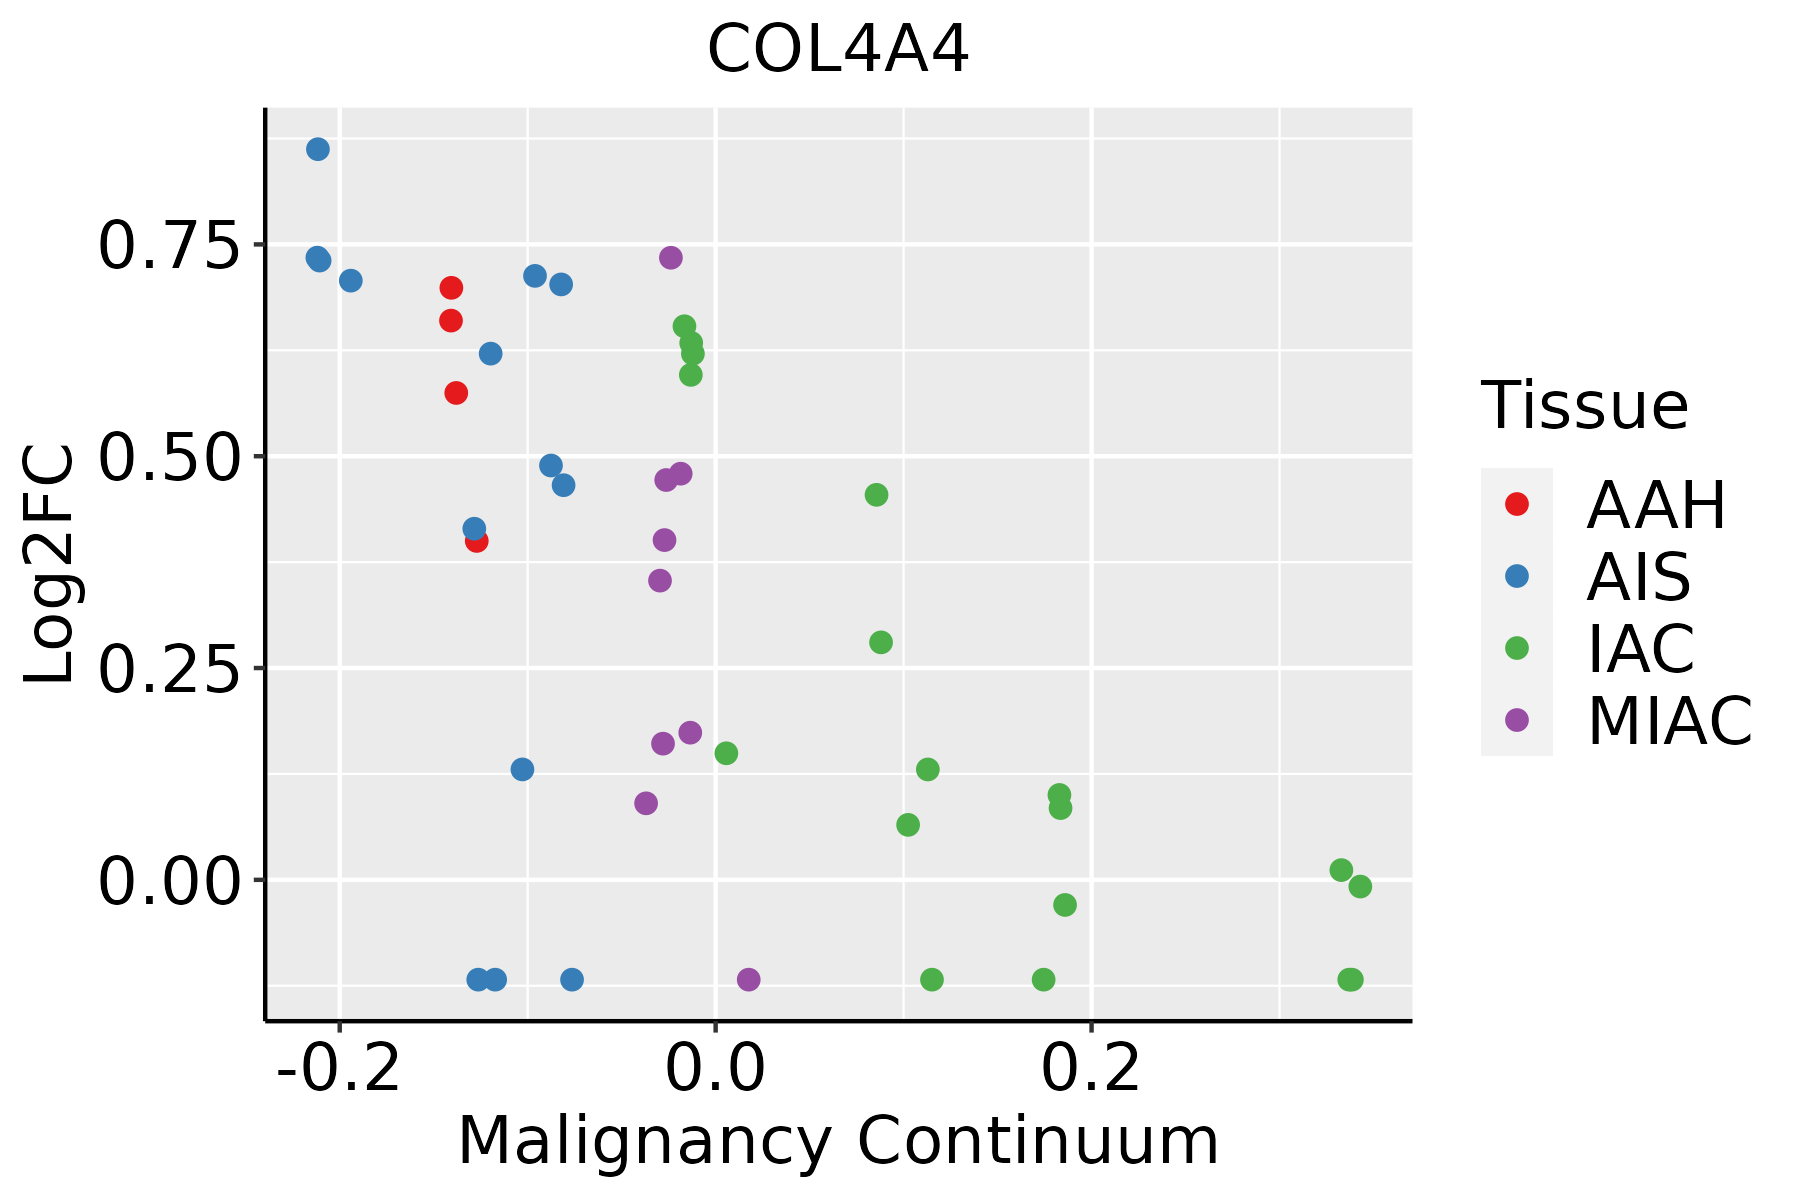 | AAH: Atypical adenomatous hyperplasia |
| AIS: Adenocarcinoma in situ | ||
| IAC: Invasive lung adenocarcinoma | ||
| MIA: Minimally invasive adenocarcinoma | ||
| Thyroid | 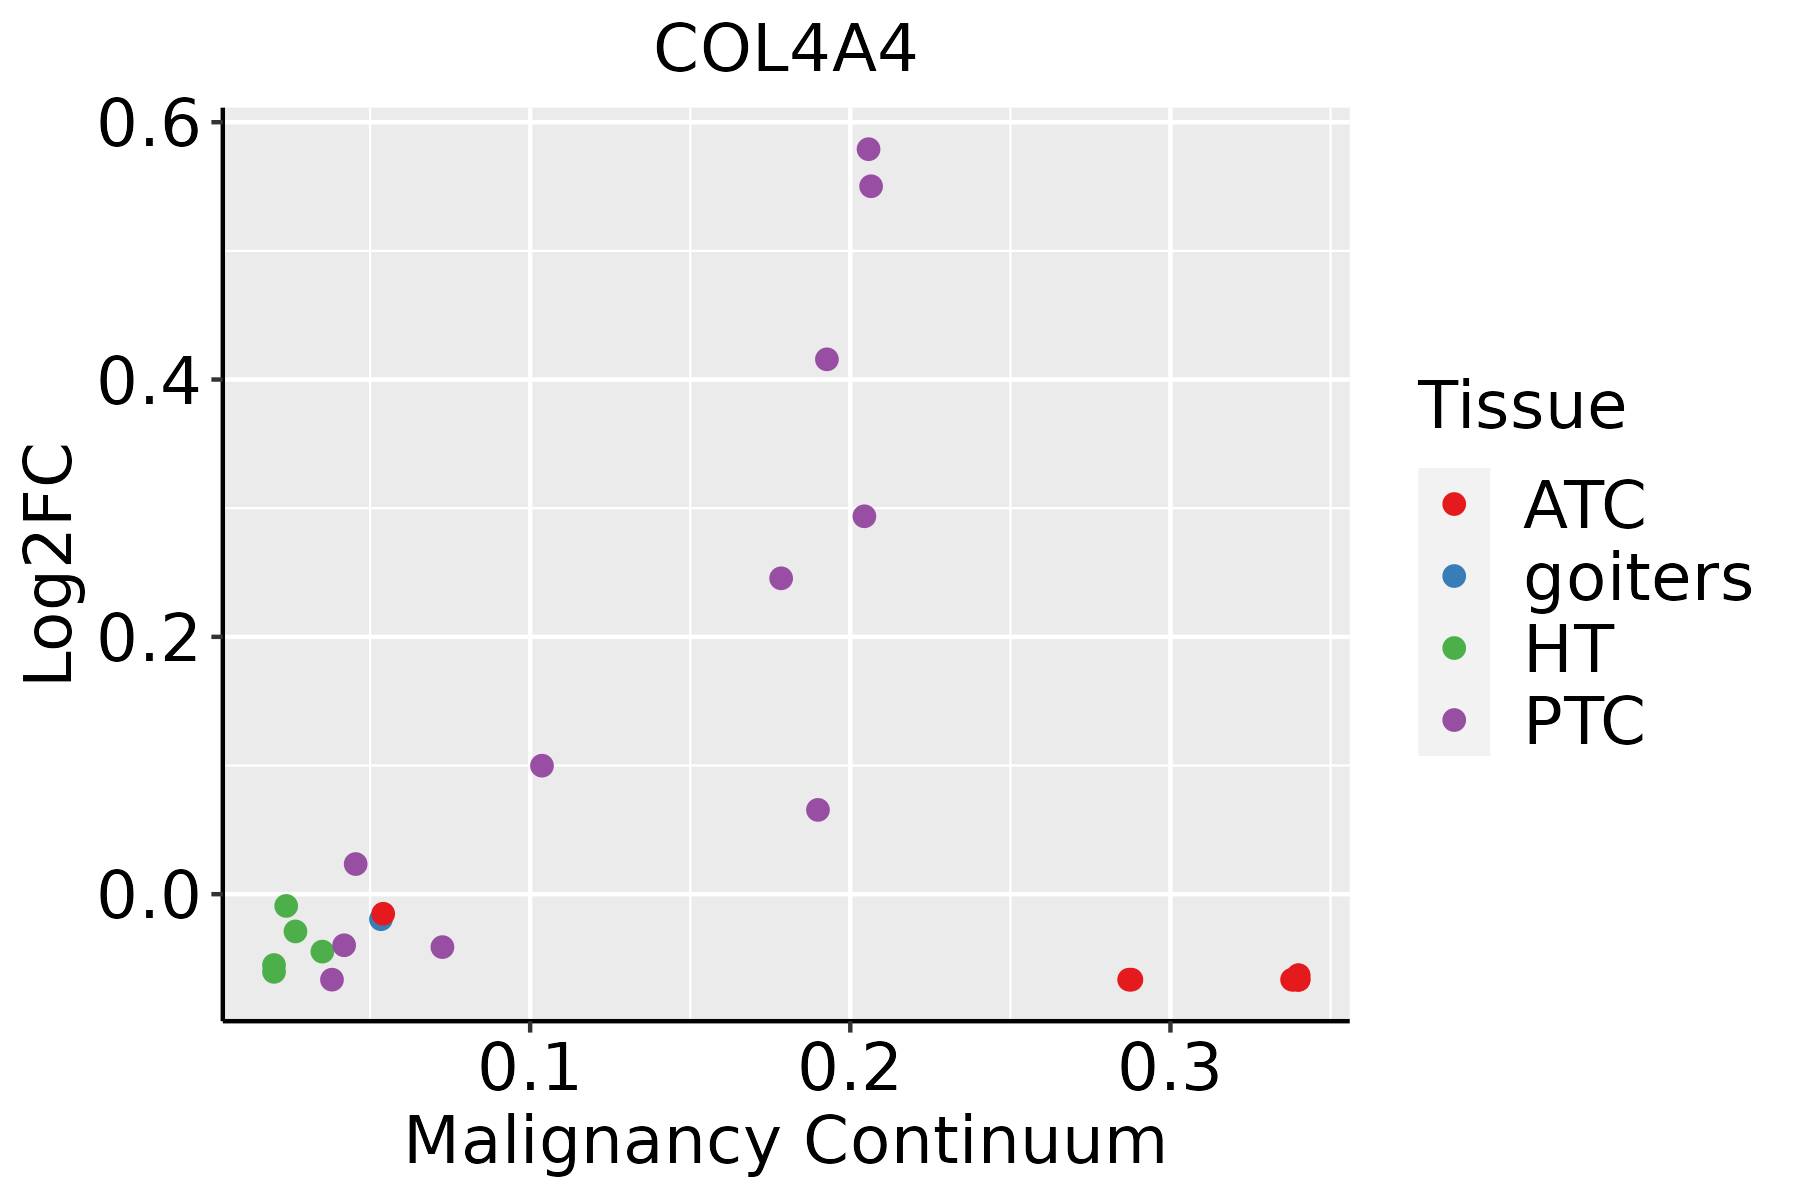 | ATC: Anaplastic thyroid cancer |
| HT: Hashimoto's thyroiditis | ||
| PTC: Papillary thyroid cancer |
| ∗log2FC in expression of this searched gene in stem-like cells from each diseased tissue sample relative to stem-like cells in normal samples in each tissue plotted against the malignancy continuum. Samples are colored based on if they are from different disease stage. |
Top |
Malignant transformation related pathway analysis |
| Find out the enriched GO biological processes and KEGG pathways involved in transition from healthy to precancer to cancer |
| Tissue | Disease Stage | Enriched GO biological Processes |
| Colorectum | AD |  |
| Colorectum | SER |  |
| Colorectum | MSS |  |
| Colorectum | MSI-H |  |
| Colorectum | FAP |  |
| ∗Top 15 enriched GO BP terms are showed in the bar plot of each disease state in each tissue. Each row represents a significant GO biological process which is colored according to the -log10(p.adjust). |
| Page: 1 2 3 4 5 6 7 8 9 |
| GO ID | Tissue | Disease Stage | Description | Gene Ratio | Bg Ratio | pvalue | p.adjust | Count |
| GO:00016554 | Lung | IAC | urogenital system development | 59/2061 | 338/18723 | 2.27e-04 | 3.93e-03 | 59 |
| GO:00720014 | Lung | IAC | renal system development | 50/2061 | 302/18723 | 2.13e-03 | 2.11e-02 | 50 |
| GO:00018223 | Lung | IAC | kidney development | 48/2061 | 293/18723 | 3.19e-03 | 2.77e-02 | 48 |
| GO:0032836 | Lung | IAC | glomerular basement membrane development | 5/2061 | 11/18723 | 4.20e-03 | 3.36e-02 | 5 |
| GO:00720063 | Lung | IAC | nephron development | 26/2061 | 142/18723 | 6.32e-03 | 4.51e-02 | 26 |
| GO:00328354 | Lung | IAC | glomerulus development | 14/2061 | 62/18723 | 6.56e-03 | 4.60e-02 | 14 |
| GO:000165511 | Lung | AIS | urogenital system development | 63/1849 | 338/18723 | 5.46e-07 | 4.08e-05 | 63 |
| GO:000182211 | Lung | AIS | kidney development | 53/1849 | 293/18723 | 1.04e-05 | 4.25e-04 | 53 |
| GO:007200111 | Lung | AIS | renal system development | 54/1849 | 302/18723 | 1.21e-05 | 4.71e-04 | 54 |
| GO:007200611 | Lung | AIS | nephron development | 27/1849 | 142/18723 | 6.53e-04 | 9.85e-03 | 27 |
| GO:003283511 | Lung | AIS | glomerulus development | 15/1849 | 62/18723 | 8.26e-04 | 1.15e-02 | 15 |
| GO:00328361 | Lung | AIS | glomerular basement membrane development | 5/1849 | 11/18723 | 2.59e-03 | 2.64e-02 | 5 |
| GO:00328362 | Lung | AAH | glomerular basement membrane development | 4/613 | 11/18723 | 3.12e-04 | 1.48e-02 | 4 |
| GO:00328352 | Lung | AAH | glomerulus development | 8/613 | 62/18723 | 8.98e-04 | 2.88e-02 | 8 |
| GO:007200121 | Lung | AAH | renal system development | 20/613 | 302/18723 | 2.36e-03 | 4.97e-02 | 20 |
| GO:00720062 | Lung | MIAC | nephron development | 21/967 | 142/18723 | 1.29e-05 | 9.85e-04 | 21 |
| GO:00328353 | Lung | MIAC | glomerulus development | 13/967 | 62/18723 | 1.35e-05 | 9.86e-04 | 13 |
| GO:00720013 | Lung | MIAC | renal system development | 32/967 | 302/18723 | 9.64e-05 | 4.19e-03 | 32 |
| GO:000182221 | Lung | MIAC | kidney development | 31/967 | 293/18723 | 1.27e-04 | 5.13e-03 | 31 |
| GO:000165521 | Lung | MIAC | urogenital system development | 34/967 | 338/18723 | 1.63e-04 | 6.25e-03 | 34 |
| Page: 1 2 |
| Pathway ID | Tissue | Disease Stage | Description | Gene Ratio | Bg Ratio | pvalue | p.adjust | qvalue | Count |
| hsa045108 | Lung | IAC | Focal adhesion | 59/1053 | 203/8465 | 1.31e-10 | 1.06e-08 | 7.06e-09 | 59 |
| hsa051656 | Lung | IAC | Human papillomavirus infection | 71/1053 | 331/8465 | 1.88e-06 | 7.63e-05 | 5.06e-05 | 71 |
| hsa052225 | Lung | IAC | Small cell lung cancer | 22/1053 | 92/8465 | 1.66e-03 | 9.66e-03 | 6.41e-03 | 22 |
| hsa04512 | Lung | IAC | ECM-receptor interaction | 20/1053 | 89/8465 | 5.65e-03 | 2.45e-02 | 1.63e-02 | 20 |
| hsa041514 | Lung | IAC | PI3K-Akt signaling pathway | 60/1053 | 354/8465 | 7.03e-03 | 2.86e-02 | 1.90e-02 | 60 |
| hsa0451012 | Lung | IAC | Focal adhesion | 59/1053 | 203/8465 | 1.31e-10 | 1.06e-08 | 7.06e-09 | 59 |
| hsa0516511 | Lung | IAC | Human papillomavirus infection | 71/1053 | 331/8465 | 1.88e-06 | 7.63e-05 | 5.06e-05 | 71 |
| hsa0522212 | Lung | IAC | Small cell lung cancer | 22/1053 | 92/8465 | 1.66e-03 | 9.66e-03 | 6.41e-03 | 22 |
| hsa045121 | Lung | IAC | ECM-receptor interaction | 20/1053 | 89/8465 | 5.65e-03 | 2.45e-02 | 1.63e-02 | 20 |
| hsa0415111 | Lung | IAC | PI3K-Akt signaling pathway | 60/1053 | 354/8465 | 7.03e-03 | 2.86e-02 | 1.90e-02 | 60 |
| hsa0451022 | Lung | AIS | Focal adhesion | 57/961 | 203/8465 | 3.17e-11 | 3.43e-09 | 2.19e-09 | 57 |
| hsa0516521 | Lung | AIS | Human papillomavirus infection | 64/961 | 331/8465 | 1.03e-05 | 3.04e-04 | 1.95e-04 | 64 |
| hsa0522221 | Lung | AIS | Small cell lung cancer | 21/961 | 92/8465 | 1.23e-03 | 9.02e-03 | 5.77e-03 | 21 |
| hsa045122 | Lung | AIS | ECM-receptor interaction | 20/961 | 89/8465 | 1.95e-03 | 1.26e-02 | 8.09e-03 | 20 |
| hsa0415121 | Lung | AIS | PI3K-Akt signaling pathway | 57/961 | 354/8465 | 3.72e-03 | 2.00e-02 | 1.28e-02 | 57 |
| hsa0492621 | Lung | AIS | Relaxin signaling pathway | 25/961 | 129/8465 | 4.95e-03 | 2.47e-02 | 1.58e-02 | 25 |
| hsa0514621 | Lung | AIS | Amoebiasis | 20/961 | 102/8465 | 9.86e-03 | 4.20e-02 | 2.69e-02 | 20 |
| hsa0451032 | Lung | AIS | Focal adhesion | 57/961 | 203/8465 | 3.17e-11 | 3.43e-09 | 2.19e-09 | 57 |
| hsa0516531 | Lung | AIS | Human papillomavirus infection | 64/961 | 331/8465 | 1.03e-05 | 3.04e-04 | 1.95e-04 | 64 |
| hsa0522231 | Lung | AIS | Small cell lung cancer | 21/961 | 92/8465 | 1.23e-03 | 9.02e-03 | 5.77e-03 | 21 |
| Page: 1 2 |
Top |
Cell-cell communication analysis |
| Identification of potential cell-cell interactions between two cell types and their ligand-receptor pairs for different disease states |
| Ligand | Receptor | LRpair | Pathway | Tissue | Disease Stage |
| COL4A4 | ITGA1_ITGB1 | COL4A4_ITGA1_ITGB1 | COLLAGEN | CRC | AD |
| COL4A4 | ITGA2_ITGB1 | COL4A4_ITGA2_ITGB1 | COLLAGEN | CRC | AD |
| COL4A4 | ITGA3_ITGB1 | COL4A4_ITGA3_ITGB1 | COLLAGEN | CRC | AD |
| COL4A4 | ITGA11_ITGB1 | COL4A4_ITGA11_ITGB1 | COLLAGEN | CRC | AD |
| COL4A4 | CD44 | COL4A4_CD44 | COLLAGEN | CRC | AD |
| COL4A4 | SDC1 | COL4A4_SDC1 | COLLAGEN | CRC | AD |
| COL4A4 | SDC4 | COL4A4_SDC4 | COLLAGEN | CRC | AD |
| COL4A4 | ITGA1_ITGB1 | COL4A4_ITGA1_ITGB1 | COLLAGEN | CRC | MSI-H |
| COL4A4 | ITGA2_ITGB1 | COL4A4_ITGA2_ITGB1 | COLLAGEN | CRC | MSI-H |
| COL4A4 | ITGA3_ITGB1 | COL4A4_ITGA3_ITGB1 | COLLAGEN | CRC | MSI-H |
| COL4A4 | ITGA9_ITGB1 | COL4A4_ITGA9_ITGB1 | COLLAGEN | CRC | MSI-H |
| COL4A4 | SDC1 | COL4A4_SDC1 | COLLAGEN | CRC | MSI-H |
| COL4A4 | SDC4 | COL4A4_SDC4 | COLLAGEN | CRC | MSI-H |
| COL4A4 | ITGA2_ITGB1 | COL4A4_ITGA2_ITGB1 | COLLAGEN | CRC | SER |
| COL4A4 | CD44 | COL4A4_CD44 | COLLAGEN | CRC | SER |
| COL4A4 | SDC1 | COL4A4_SDC1 | COLLAGEN | CRC | SER |
| COL4A4 | SDC4 | COL4A4_SDC4 | COLLAGEN | CRC | SER |
| COL4A4 | ITGA1_ITGB1 | COL4A4_ITGA1_ITGB1 | COLLAGEN | HNSCC | Precancer |
| COL4A4 | ITGA2_ITGB1 | COL4A4_ITGA2_ITGB1 | COLLAGEN | HNSCC | Precancer |
| COL4A4 | ITGA3_ITGB1 | COL4A4_ITGA3_ITGB1 | COLLAGEN | HNSCC | Precancer |
| Page: 1 2 3 4 5 |
Top |
Single-cell gene regulatory network inference analysis |
| Find out the significant the regulons (TFs) and the target genes of each regulon across cell types for different disease states |
| TF | Cell Type | Tissue | Disease Stage | Target Gene | RSS | Regulon Activity |
| ∗The dot plots of a searched regulon are shown for all cell subpopulations in each disease state of each tissue based on the regulon specific score inferred using pySCENIC and by calculating the average expression. |
| Page: 1 |
Top |
Somatic mutation of malignant transformation related genes |
| Annotation of somatic variants for genes involved in malignant transformation |
| Hugo Symbol | Variant Class | Variant Classification | dbSNP RS | HGVSc | HGVSp | HGVSp Short | SWISSPROT | BIOTYPE | SIFT | PolyPhen | Tumor Sample Barcode | Tissue | Histology | Sex | Age | Stage | Therapy Types | Drugs | Outcome |
| COL4A4 | SNV | Missense_Mutation | c.4127N>G | p.Pro1376Arg | p.P1376R | P53420 | protein_coding | deleterious(0.01) | possibly_damaging(0.831) | TCGA-A2-A0T0-01 | Breast | breast invasive carcinoma | Female | <65 | I/II | Chemotherapy | taxotere | SD | |
| COL4A4 | SNV | Missense_Mutation | c.2327N>T | p.Ser776Leu | p.S776L | P53420 | protein_coding | deleterious(0.03) | benign(0.001) | TCGA-A8-A08H-01 | Breast | breast invasive carcinoma | Female | >=65 | I/II | Unknown | Unknown | SD | |
| COL4A4 | SNV | Missense_Mutation | c.493N>T | p.His165Tyr | p.H165Y | P53420 | protein_coding | tolerated(0.82) | benign(0) | TCGA-AR-A24Z-01 | Breast | breast invasive carcinoma | Female | <65 | I/II | Chemotherapy | doxorubicin | SD | |
| COL4A4 | SNV | Missense_Mutation | rs778889239 | c.1762C>T | p.Arg588Trp | p.R588W | P53420 | protein_coding | deleterious(0.04) | benign(0) | TCGA-C8-A3M8-01 | Breast | breast invasive carcinoma | Female | >=65 | I/II | Hormone Therapy | tamoxiphen | CR |
| COL4A4 | SNV | Missense_Mutation | c.4561N>T | p.Pro1521Ser | p.P1521S | P53420 | protein_coding | deleterious(0) | probably_damaging(1) | TCGA-D8-A1J8-01 | Breast | breast invasive carcinoma | Female | >=65 | I/II | Hormone Therapy | nolvadex | SD | |
| COL4A4 | SNV | Missense_Mutation | rs762139460 | c.2242G>A | p.Gly748Ser | p.G748S | P53420 | protein_coding | deleterious(0.02) | benign(0.172) | TCGA-D8-A1JJ-01 | Breast | breast invasive carcinoma | Female | <65 | I/II | Chemotherapy | doxorubicine | SD |
| COL4A4 | SNV | Missense_Mutation | novel | c.4783C>A | p.Leu1595Ile | p.L1595I | P53420 | protein_coding | deleterious(0) | probably_damaging(0.98) | TCGA-D8-A27G-01 | Breast | breast invasive carcinoma | Female | >=65 | I/II | Unknown | Unknown | SD |
| COL4A4 | SNV | Missense_Mutation | c.3763C>T | p.Pro1255Ser | p.P1255S | P53420 | protein_coding | tolerated(0.07) | benign(0.093) | TCGA-E9-A1NI-01 | Breast | breast invasive carcinoma | Female | <65 | I/II | Chemotherapy | doxorubicin | CR | |
| COL4A4 | SNV | Missense_Mutation | c.1792N>A | p.Pro598Thr | p.P598T | P53420 | protein_coding | deleterious(0.03) | benign(0.044) | TCGA-LL-A9Q3-01 | Breast | breast invasive carcinoma | Female | >=65 | III/IV | Immunotherapy | herceptin | CR | |
| COL4A4 | SNV | Missense_Mutation | novel | c.4705T>A | p.Cys1569Ser | p.C1569S | P53420 | protein_coding | deleterious(0) | probably_damaging(0.999) | TCGA-UU-A93S-01 | Breast | breast invasive carcinoma | Female | <65 | III/IV | Unknown | Unknown | PD |
| Page: 1 2 3 4 5 6 7 8 9 10 11 12 13 14 15 16 17 18 19 20 21 22 |
Top |
Related drugs of malignant transformation related genes |
| Identification of chemicals and drugs interact with genes involved in malignant transfromation |
| (DGIdb 4.0) |
| Entrez ID | Symbol | Category | Interaction Types | Drug Claim Name | Drug Name | PMIDs |
| 1286 | COL4A4 | DRUGGABLE GENOME | CHEMBL2095222 | OCRIPLASMIN | ||
| 1286 | COL4A4 | DRUGGABLE GENOME | CHEMBL2108709 | COLLAGENASE CLOSTRIDIUM HISTOLYTICUM |
| Page: 1 |

Copyright 2023-Present -The University of Texas Health Science Center at Houston |