| Tissue | Expression Dynamics | Abbreviation |
| Esophagus | 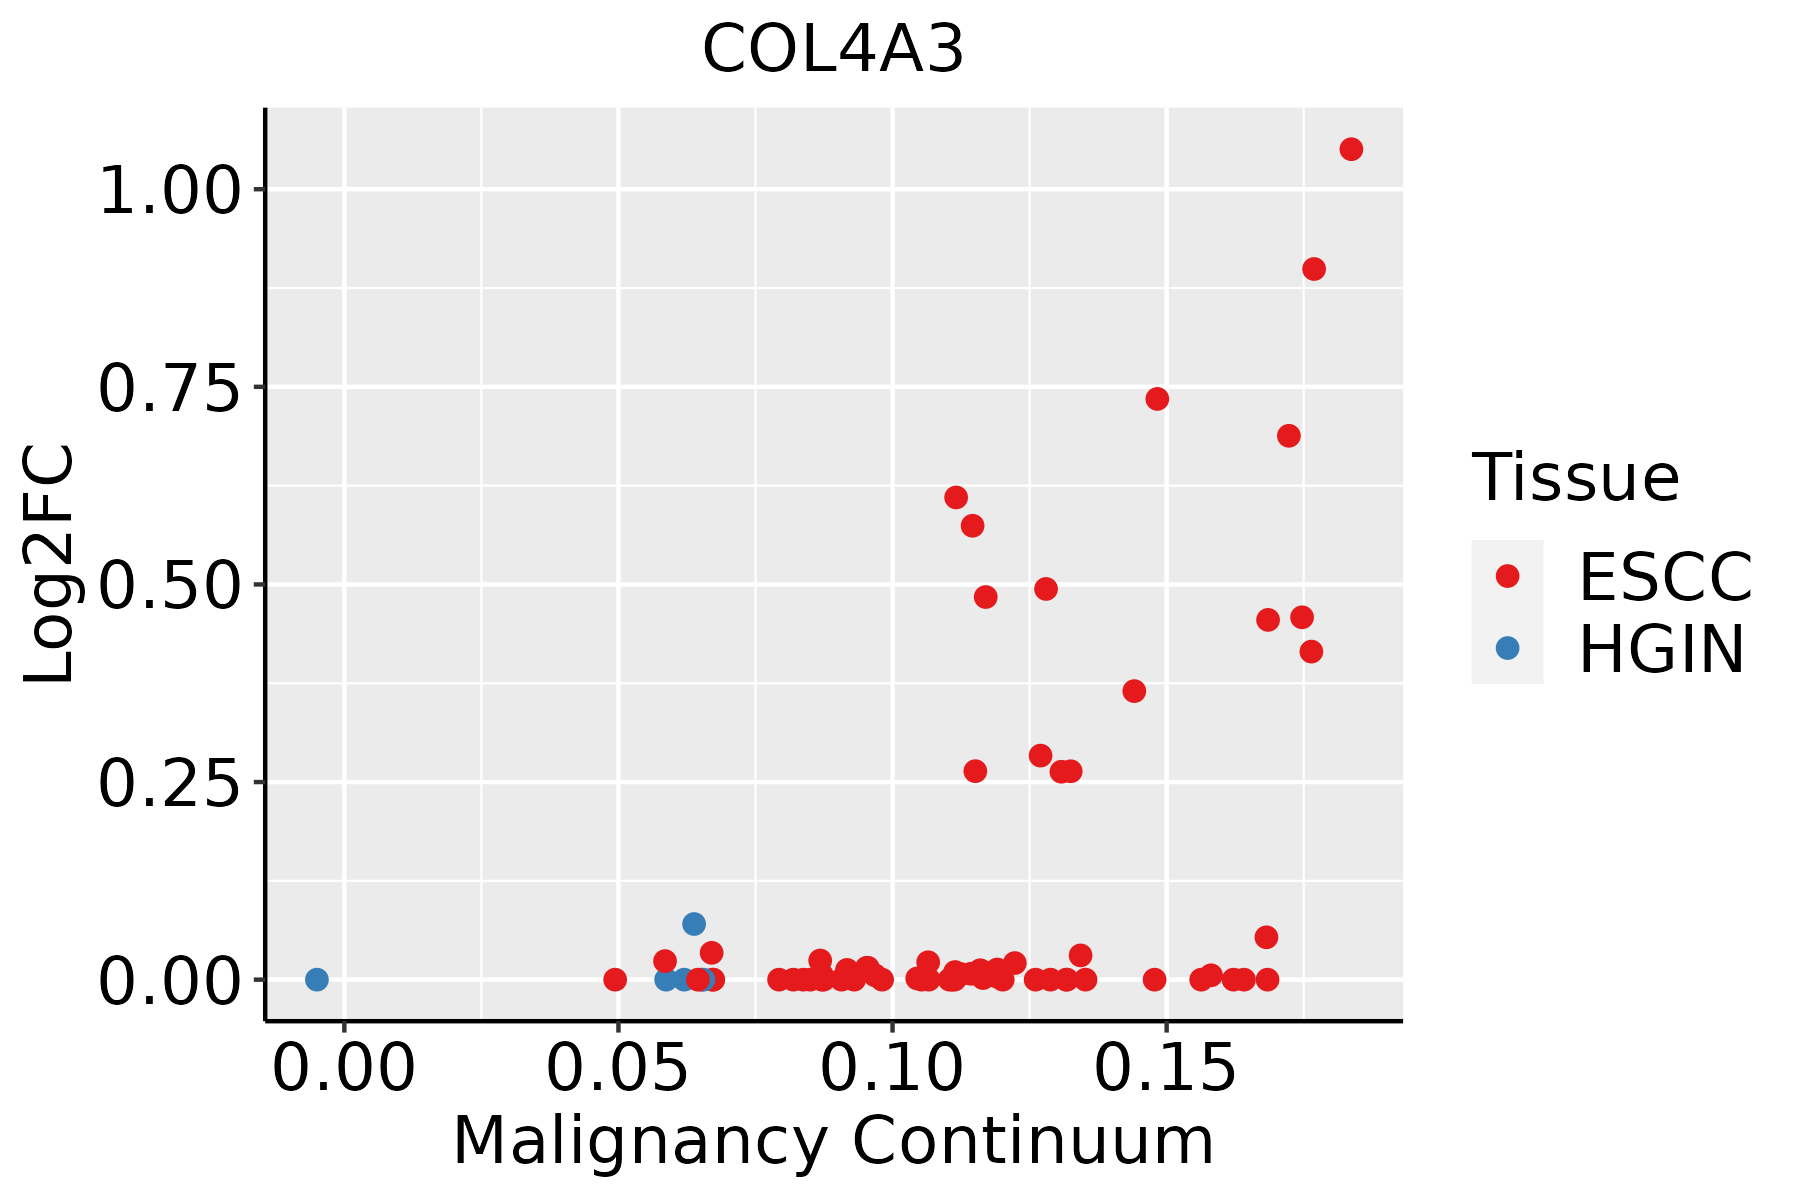 | ESCC: Esophageal squamous cell carcinoma |
| HGIN: High-grade intraepithelial neoplasias |
| LGIN: Low-grade intraepithelial neoplasias |
| Lung |  | AAH: Atypical adenomatous hyperplasia |
| AIS: Adenocarcinoma in situ |
| IAC: Invasive lung adenocarcinoma |
| MIA: Minimally invasive adenocarcinoma |
| Thyroid | 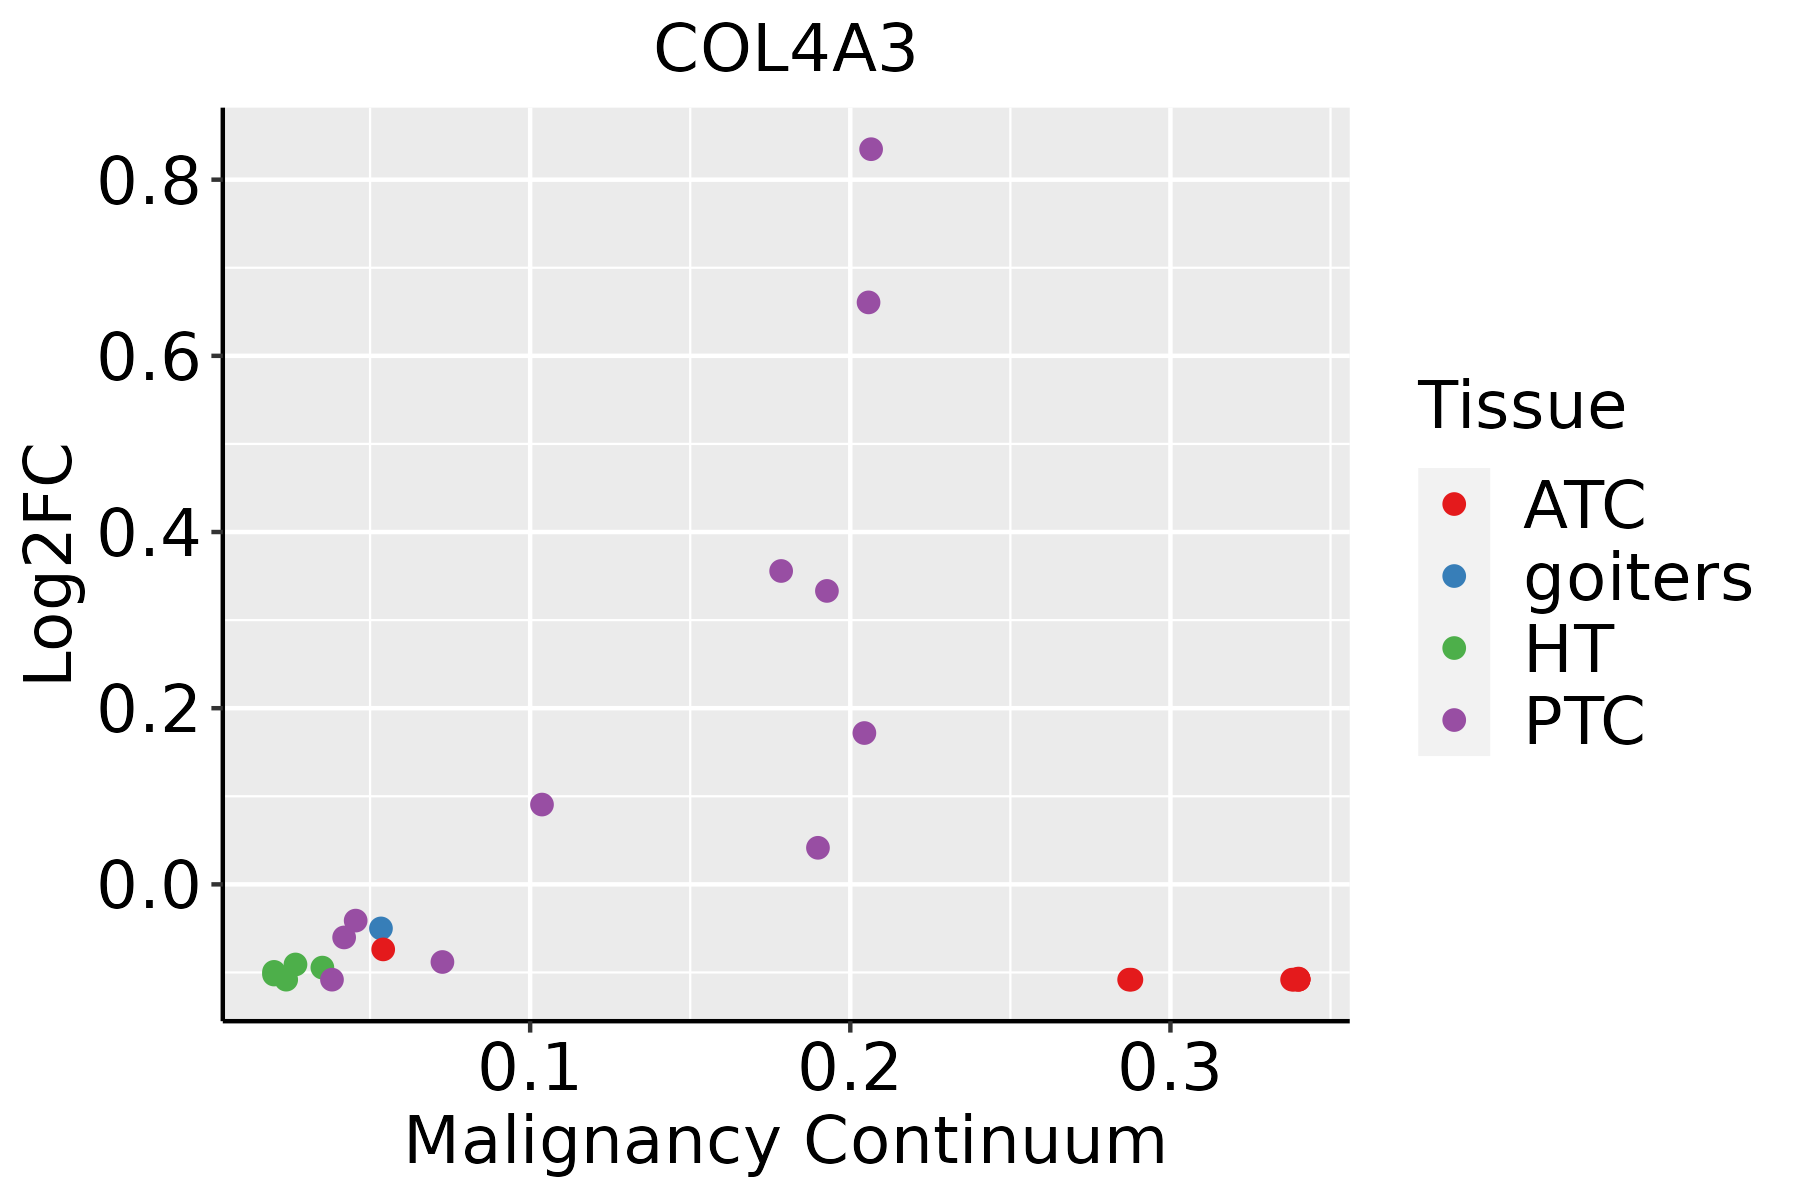 | ATC: Anaplastic thyroid cancer |
| HT: Hashimoto's thyroiditis |
| PTC: Papillary thyroid cancer |
| GO ID | Tissue | Disease Stage | Description | Gene Ratio | Bg Ratio | pvalue | p.adjust | Count |
| GO:0045862111 | Esophagus | ESCC | positive regulation of proteolysis | 256/8552 | 372/18723 | 7.88e-20 | 9.43e-18 | 256 |
| GO:2000116111 | Esophagus | ESCC | regulation of cysteine-type endopeptidase activity | 158/8552 | 235/18723 | 1.67e-11 | 5.90e-10 | 158 |
| GO:0043281111 | Esophagus | ESCC | regulation of cysteine-type endopeptidase activity involved in apoptotic process | 143/8552 | 209/18723 | 2.12e-11 | 7.31e-10 | 143 |
| GO:0010952111 | Esophagus | ESCC | positive regulation of peptidase activity | 133/8552 | 197/18723 | 4.31e-10 | 1.14e-08 | 133 |
| GO:0052547111 | Esophagus | ESCC | regulation of peptidase activity | 275/8552 | 461/18723 | 7.54e-10 | 1.88e-08 | 275 |
| GO:0052548111 | Esophagus | ESCC | regulation of endopeptidase activity | 253/8552 | 432/18723 | 3.68e-08 | 6.78e-07 | 253 |
| GO:0010950111 | Esophagus | ESCC | positive regulation of endopeptidase activity | 116/8552 | 179/18723 | 1.77e-07 | 2.79e-06 | 116 |
| GO:0043280110 | Esophagus | ESCC | positive regulation of cysteine-type endopeptidase activity involved in apoptotic process | 84/8552 | 129/18723 | 6.38e-06 | 6.55e-05 | 84 |
| GO:2001056110 | Esophagus | ESCC | positive regulation of cysteine-type endopeptidase activity | 94/8552 | 148/18723 | 8.87e-06 | 8.59e-05 | 94 |
| GO:000691915 | Esophagus | ESCC | activation of cysteine-type endopeptidase activity involved in apoptotic process | 54/8552 | 78/18723 | 2.17e-05 | 1.87e-04 | 54 |
| GO:00301984 | Esophagus | ESCC | extracellular matrix organization | 171/8552 | 301/18723 | 6.08e-05 | 4.67e-04 | 171 |
| GO:00430624 | Esophagus | ESCC | extracellular structure organization | 171/8552 | 302/18723 | 7.73e-05 | 5.76e-04 | 171 |
| GO:00452294 | Esophagus | ESCC | external encapsulating structure organization | 172/8552 | 304/18723 | 7.80e-05 | 5.80e-04 | 172 |
| GO:0045861111 | Esophagus | ESCC | negative regulation of proteolysis | 195/8552 | 351/18723 | 1.13e-04 | 7.85e-04 | 195 |
| GO:005067318 | Esophagus | ESCC | epithelial cell proliferation | 238/8552 | 437/18723 | 1.19e-04 | 8.20e-04 | 238 |
| GO:0051346110 | Esophagus | ESCC | negative regulation of hydrolase activity | 208/8552 | 379/18723 | 1.76e-04 | 1.14e-03 | 208 |
| GO:005067817 | Esophagus | ESCC | regulation of epithelial cell proliferation | 206/8552 | 381/18723 | 5.51e-04 | 3.02e-03 | 206 |
| GO:001046620 | Esophagus | ESCC | negative regulation of peptidase activity | 140/8552 | 262/18723 | 6.73e-03 | 2.46e-02 | 140 |
| GO:001095119 | Esophagus | ESCC | negative regulation of endopeptidase activity | 135/8552 | 252/18723 | 6.86e-03 | 2.51e-02 | 135 |
| GO:00016559 | Esophagus | ESCC | urogenital system development | 177/8552 | 338/18723 | 7.51e-03 | 2.69e-02 | 177 |
| Pathway ID | Tissue | Disease Stage | Description | Gene Ratio | Bg Ratio | pvalue | p.adjust | qvalue | Count |
| hsa0516510 | Esophagus | ESCC | Human papillomavirus infection | 215/4205 | 331/8465 | 7.86e-09 | 7.12e-08 | 3.65e-08 | 215 |
| hsa0451020 | Esophagus | ESCC | Focal adhesion | 127/4205 | 203/8465 | 1.25e-04 | 4.99e-04 | 2.56e-04 | 127 |
| hsa049268 | Esophagus | ESCC | Relaxin signaling pathway | 81/4205 | 129/8465 | 1.72e-03 | 5.09e-03 | 2.61e-03 | 81 |
| hsa041517 | Esophagus | ESCC | PI3K-Akt signaling pathway | 197/4205 | 354/8465 | 1.24e-02 | 2.83e-02 | 1.45e-02 | 197 |
| hsa0516515 | Esophagus | ESCC | Human papillomavirus infection | 215/4205 | 331/8465 | 7.86e-09 | 7.12e-08 | 3.65e-08 | 215 |
| hsa04510111 | Esophagus | ESCC | Focal adhesion | 127/4205 | 203/8465 | 1.25e-04 | 4.99e-04 | 2.56e-04 | 127 |
| hsa0492616 | Esophagus | ESCC | Relaxin signaling pathway | 81/4205 | 129/8465 | 1.72e-03 | 5.09e-03 | 2.61e-03 | 81 |
| hsa0415114 | Esophagus | ESCC | PI3K-Akt signaling pathway | 197/4205 | 354/8465 | 1.24e-02 | 2.83e-02 | 1.45e-02 | 197 |
| hsa045108 | Lung | IAC | Focal adhesion | 59/1053 | 203/8465 | 1.31e-10 | 1.06e-08 | 7.06e-09 | 59 |
| hsa051656 | Lung | IAC | Human papillomavirus infection | 71/1053 | 331/8465 | 1.88e-06 | 7.63e-05 | 5.06e-05 | 71 |
| hsa049264 | Lung | IAC | Relaxin signaling pathway | 29/1053 | 129/8465 | 9.70e-04 | 7.32e-03 | 4.86e-03 | 29 |
| hsa051464 | Lung | IAC | Amoebiasis | 23/1053 | 102/8465 | 2.99e-03 | 1.53e-02 | 1.02e-02 | 23 |
| hsa04512 | Lung | IAC | ECM-receptor interaction | 20/1053 | 89/8465 | 5.65e-03 | 2.45e-02 | 1.63e-02 | 20 |
| hsa041514 | Lung | IAC | PI3K-Akt signaling pathway | 60/1053 | 354/8465 | 7.03e-03 | 2.86e-02 | 1.90e-02 | 60 |
| hsa0451012 | Lung | IAC | Focal adhesion | 59/1053 | 203/8465 | 1.31e-10 | 1.06e-08 | 7.06e-09 | 59 |
| hsa0516511 | Lung | IAC | Human papillomavirus infection | 71/1053 | 331/8465 | 1.88e-06 | 7.63e-05 | 5.06e-05 | 71 |
| hsa0492612 | Lung | IAC | Relaxin signaling pathway | 29/1053 | 129/8465 | 9.70e-04 | 7.32e-03 | 4.86e-03 | 29 |
| hsa0514611 | Lung | IAC | Amoebiasis | 23/1053 | 102/8465 | 2.99e-03 | 1.53e-02 | 1.02e-02 | 23 |
| hsa045121 | Lung | IAC | ECM-receptor interaction | 20/1053 | 89/8465 | 5.65e-03 | 2.45e-02 | 1.63e-02 | 20 |
| hsa0415111 | Lung | IAC | PI3K-Akt signaling pathway | 60/1053 | 354/8465 | 7.03e-03 | 2.86e-02 | 1.90e-02 | 60 |
| Hugo Symbol | Variant Class | Variant Classification | dbSNP RS | HGVSc | HGVSp | HGVSp Short | SWISSPROT | BIOTYPE | SIFT | PolyPhen | Tumor Sample Barcode | Tissue | Histology | Sex | Age | Stage | Therapy Types | Drugs | Outcome |
| COL4A3 | SNV | Missense_Mutation | | c.1865G>T | p.Gly622Val | p.G622V | Q01955 | protein_coding | deleterious(0) | probably_damaging(0.988) | TCGA-3C-AALI-01 | Breast | breast invasive carcinoma | Female | <65 | I/II | Unspecific | Poly E | Complete Response |
| COL4A3 | SNV | Missense_Mutation | novel | c.3466G>A | p.Asp1156Asn | p.D1156N | Q01955 | protein_coding | tolerated(1) | benign(0.003) | TCGA-5L-AAT1-01 | Breast | breast invasive carcinoma | Female | <65 | III/IV | Hormone Therapy | letrozol | SD |
| COL4A3 | SNV | Missense_Mutation | | c.2528T>A | p.Ile843Asn | p.I843N | Q01955 | protein_coding | tolerated(0.14) | probably_damaging(0.977) | TCGA-A1-A0SO-01 | Breast | breast invasive carcinoma | Female | >=65 | I/II | Chemotherapy | | SD |
| COL4A3 | SNV | Missense_Mutation | | c.475C>G | p.Pro159Ala | p.P159A | Q01955 | protein_coding | tolerated(0.13) | probably_damaging(0.998) | TCGA-A7-A26G-01 | Breast | breast invasive carcinoma | Female | <65 | I/II | Chemotherapy | taxotere | SD |
| COL4A3 | SNV | Missense_Mutation | | c.964N>A | p.Leu322Ile | p.L322I | Q01955 | protein_coding | tolerated(0.12) | possibly_damaging(0.67) | TCGA-A8-A09Q-01 | Breast | breast invasive carcinoma | Female | >=65 | III/IV | Hormone Therapy | anastrozole | SD |
| COL4A3 | SNV | Missense_Mutation | rs773914532 | c.1330N>T | p.Arg444Cys | p.R444C | Q01955 | protein_coding | tolerated(0.11) | probably_damaging(0.987) | TCGA-AN-A046-01 | Breast | breast invasive carcinoma | Female | >=65 | I/II | Unknown | Unknown | SD |
| COL4A3 | SNV | Missense_Mutation | novel | c.3679N>T | p.Pro1227Ser | p.P1227S | Q01955 | protein_coding | tolerated(0.09) | possibly_damaging(0.557) | TCGA-AN-A046-01 | Breast | breast invasive carcinoma | Female | >=65 | I/II | Unknown | Unknown | SD |
| COL4A3 | SNV | Missense_Mutation | | c.835N>G | p.Pro279Ala | p.P279A | Q01955 | protein_coding | tolerated(0.15) | probably_damaging(0.994) | TCGA-AN-A0AK-01 | Breast | breast invasive carcinoma | Female | >=65 | I/II | Unknown | Unknown | SD |
| COL4A3 | SNV | Missense_Mutation | rs148686474 | c.1310N>T | p.Pro437Leu | p.P437L | Q01955 | protein_coding | tolerated(0.61) | probably_damaging(0.979) | TCGA-AN-A0AK-01 | Breast | breast invasive carcinoma | Female | >=65 | I/II | Unknown | Unknown | SD |
| COL4A3 | SNV | Missense_Mutation | | c.3965N>T | p.Gly1322Val | p.G1322V | Q01955 | protein_coding | deleterious(0) | probably_damaging(0.999) | TCGA-AN-A0FN-01 | Breast | breast invasive carcinoma | Female | <65 | I/II | Unknown | Unknown | SD |


