| Tissue | Expression Dynamics | Abbreviation |
| Esophagus | 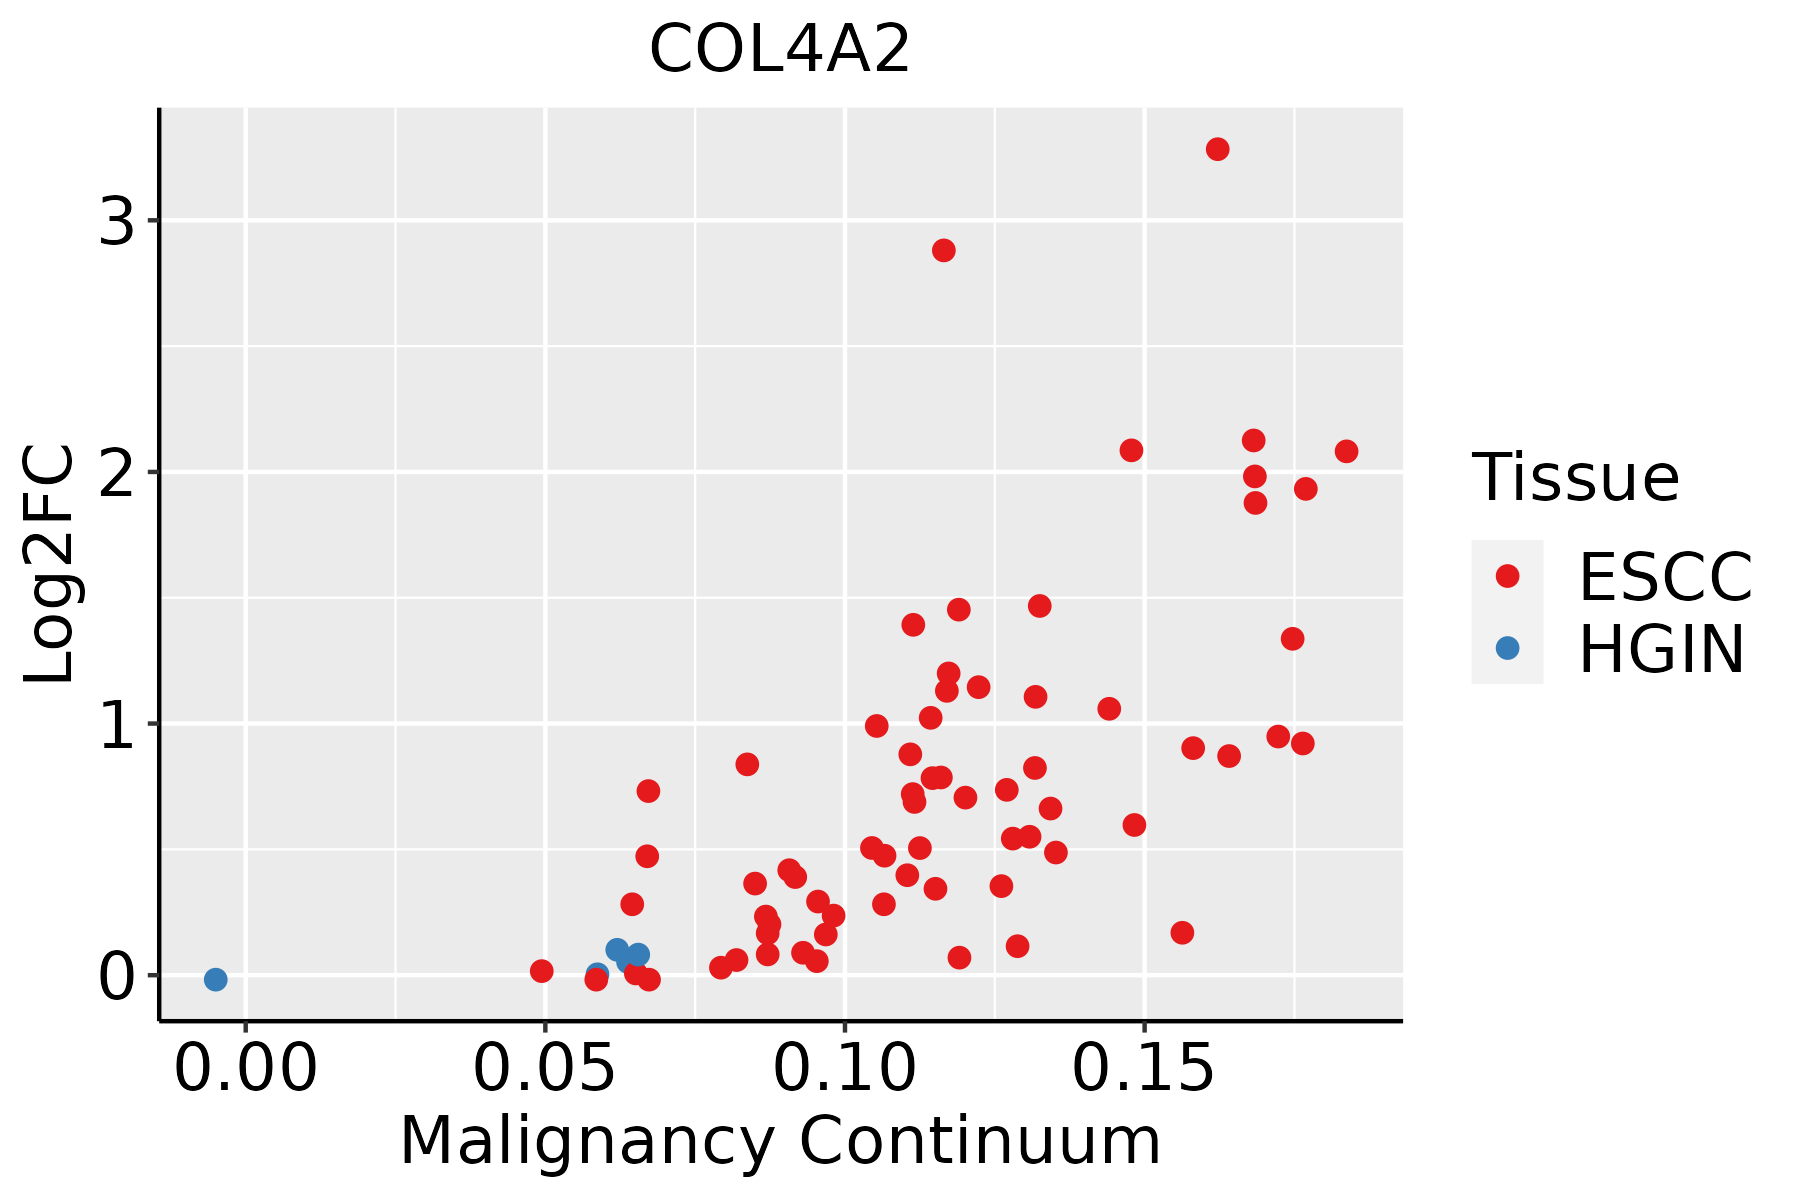 | ESCC: Esophageal squamous cell carcinoma |
| HGIN: High-grade intraepithelial neoplasias |
| LGIN: Low-grade intraepithelial neoplasias |
| Liver | 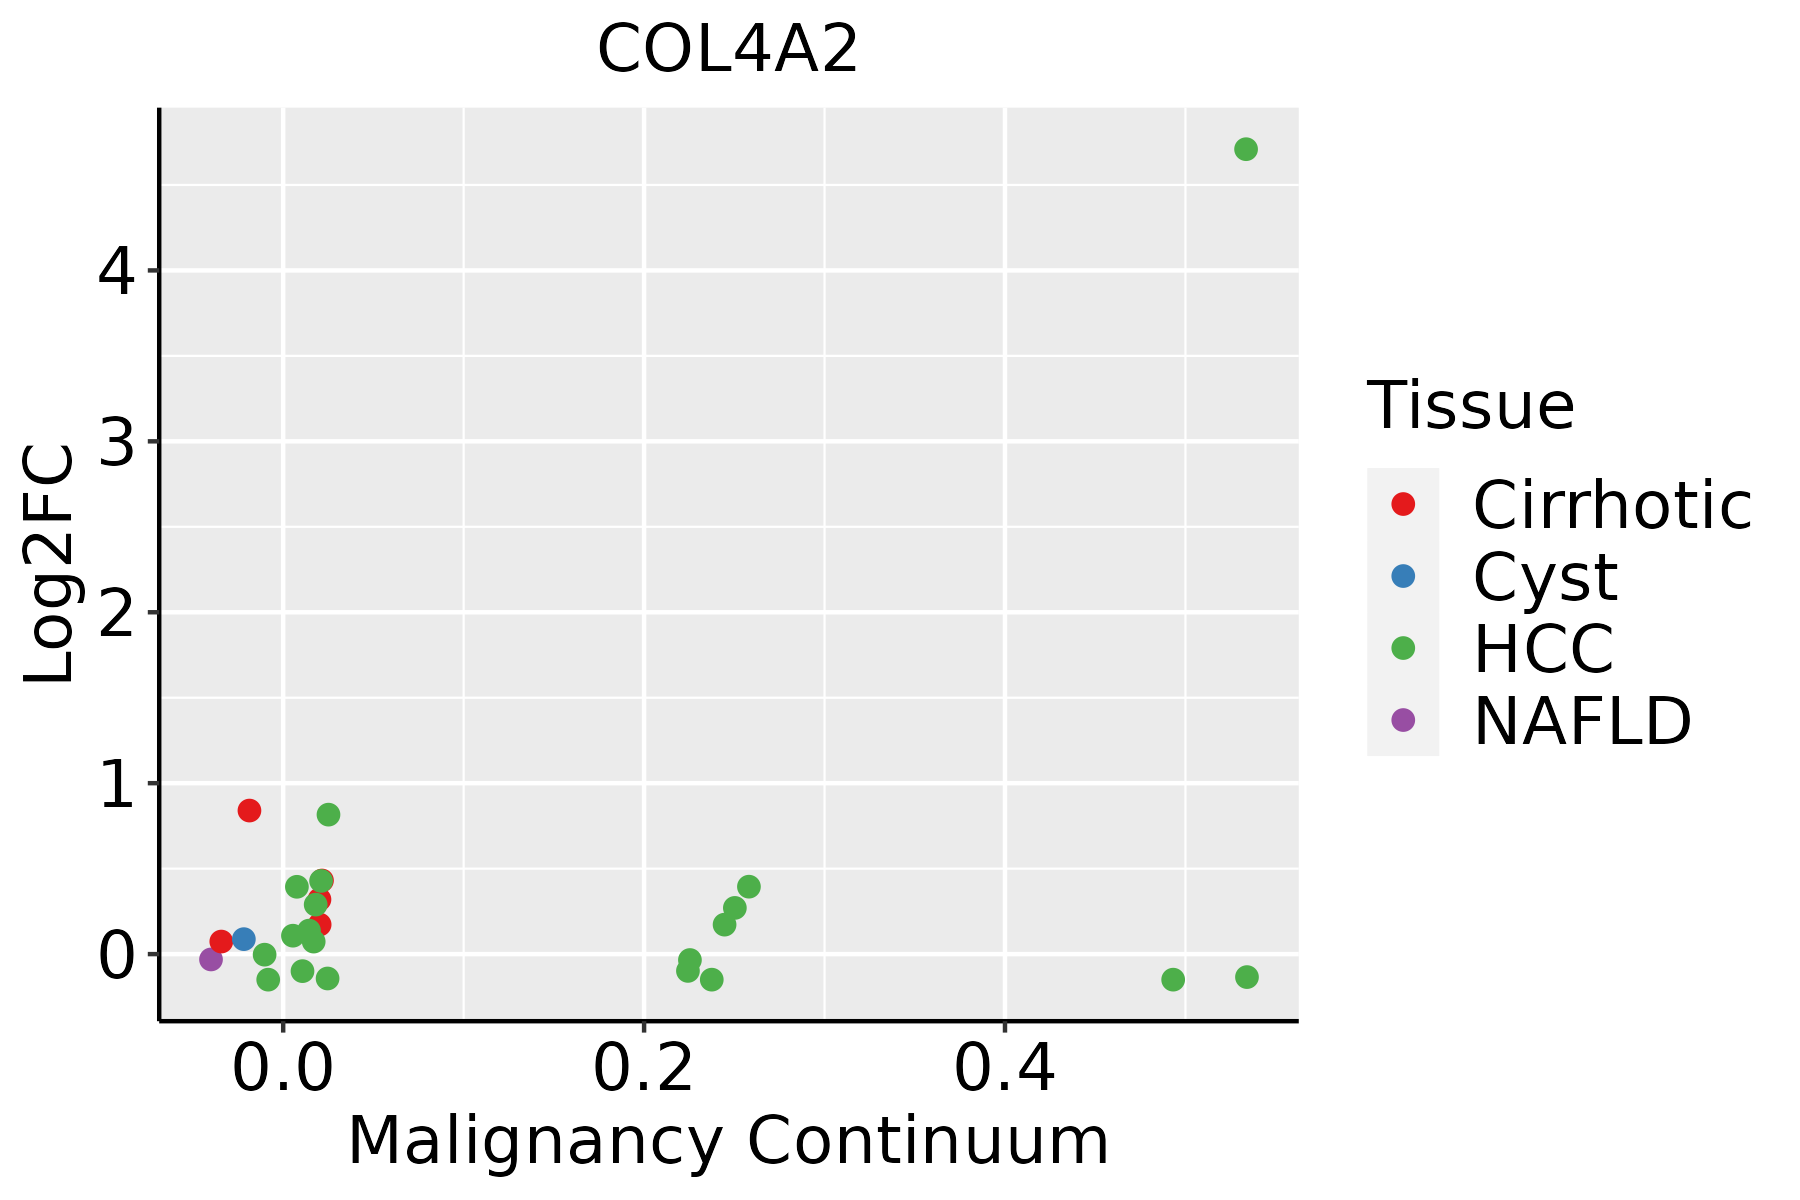 | HCC: Hepatocellular carcinoma |
| NAFLD: Non-alcoholic fatty liver disease |
| Oral Cavity |  | EOLP: Erosive Oral lichen planus |
| LP: leukoplakia |
| NEOLP: Non-erosive oral lichen planus |
| OSCC: Oral squamous cell carcinoma |
| Prostate | 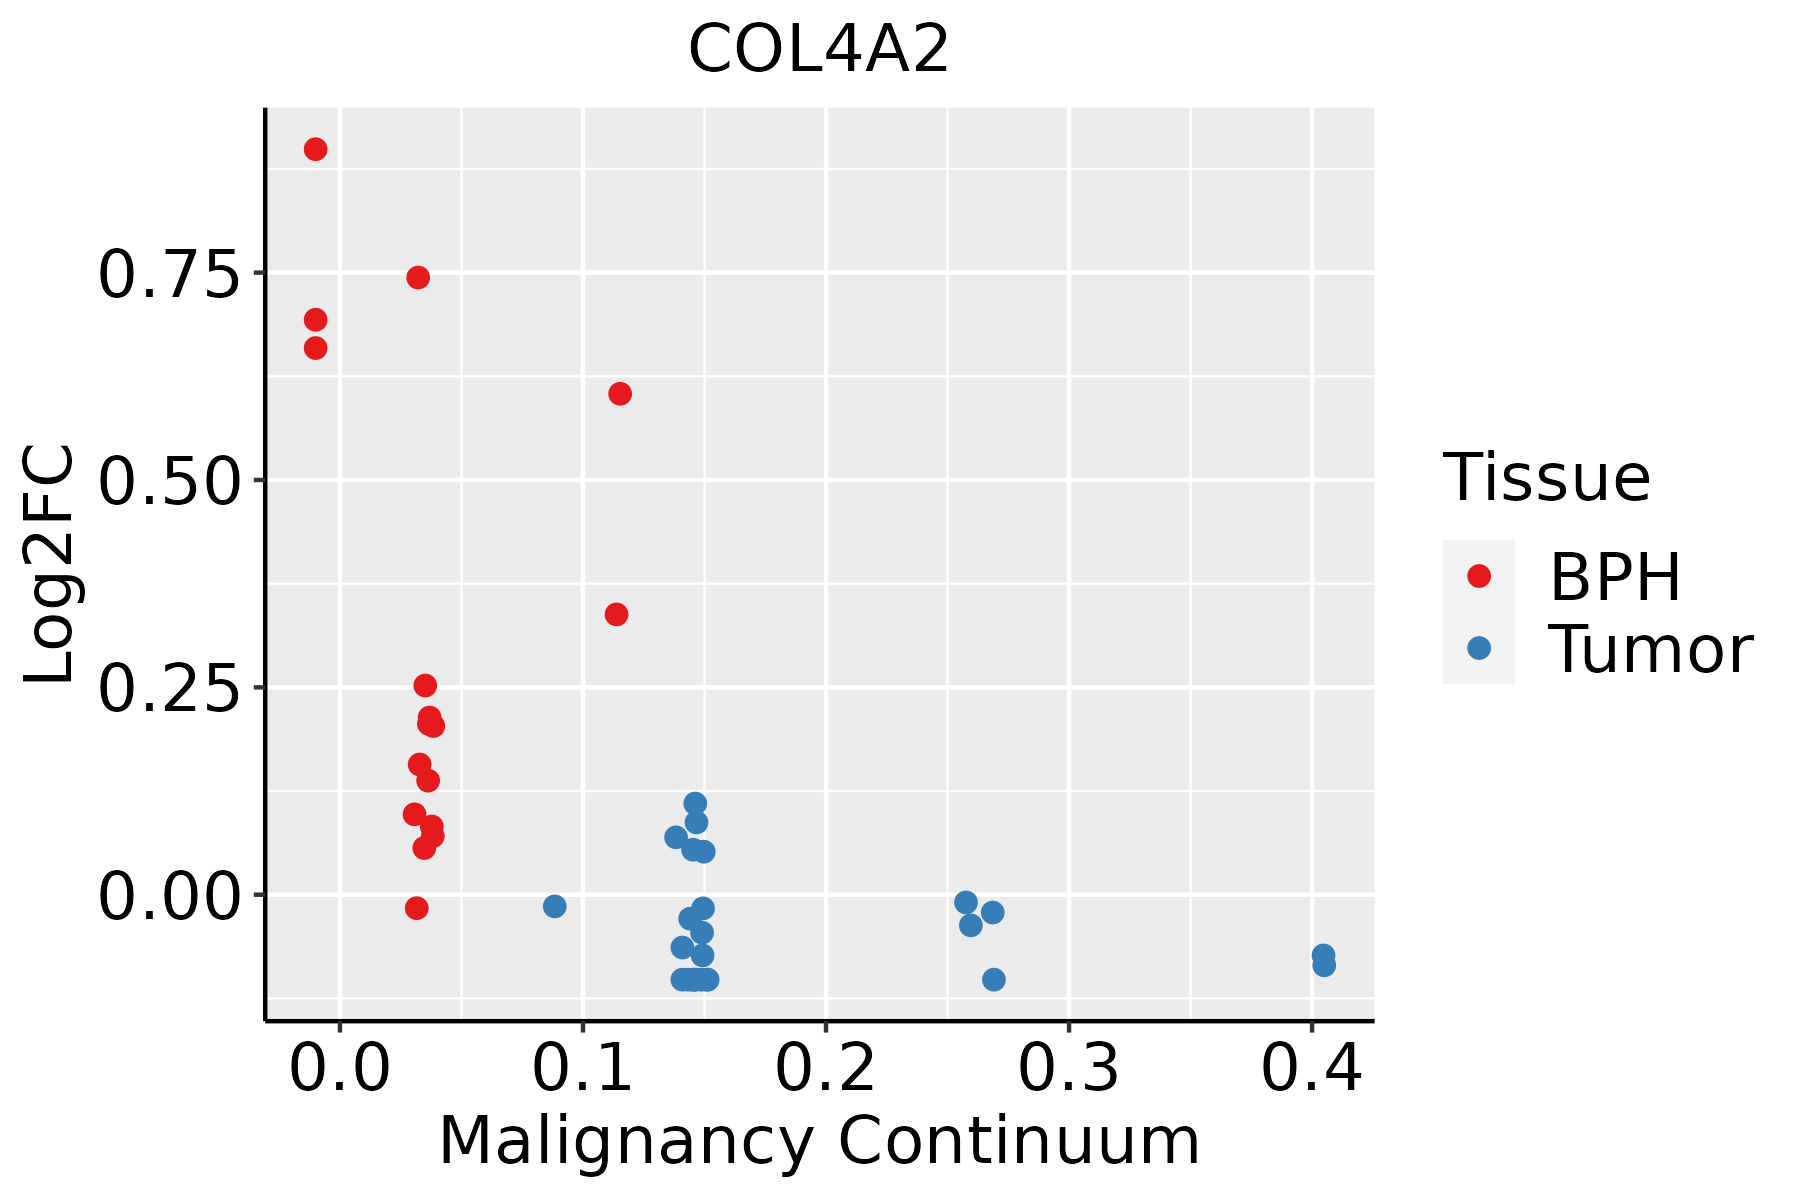 | BPH: Benign Prostatic Hyperplasia |
| Thyroid | 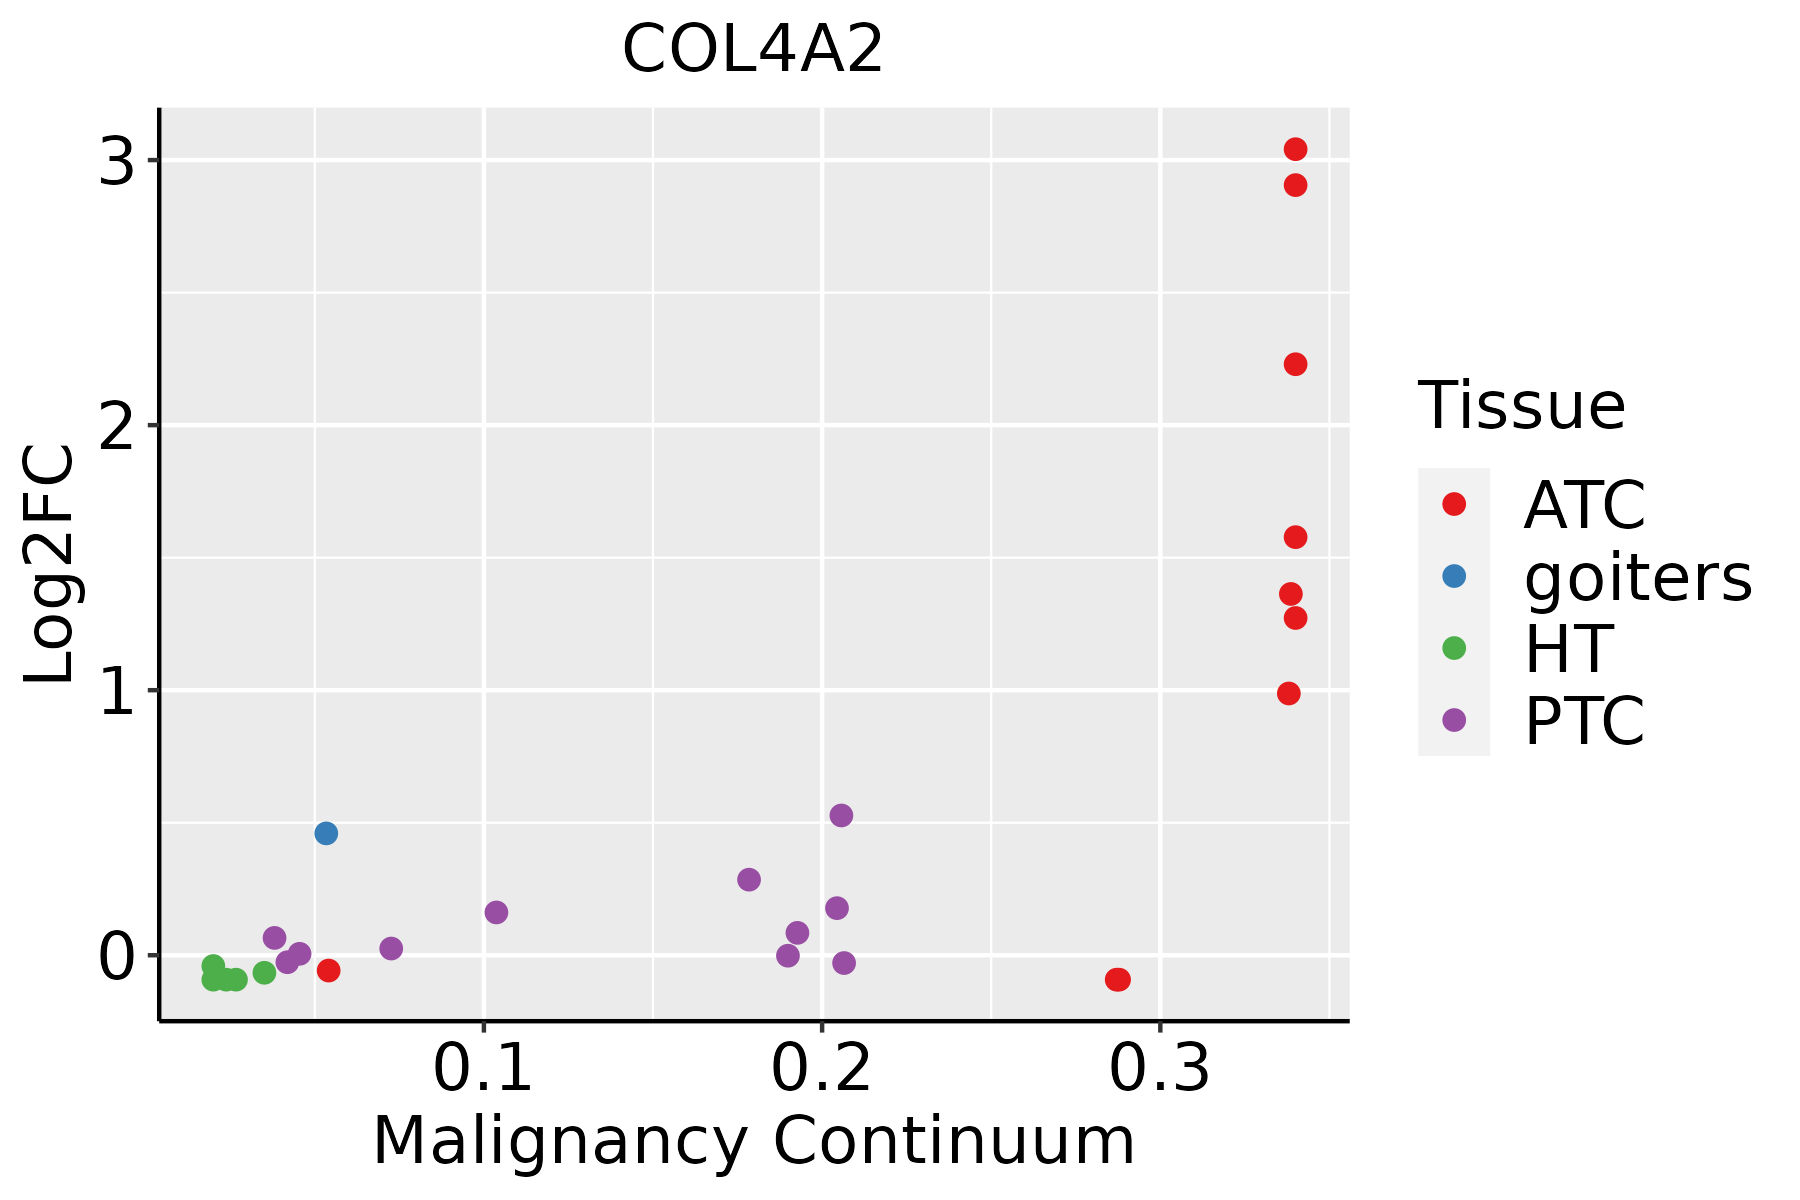 | ATC: Anaplastic thyroid cancer |
| HT: Hashimoto's thyroiditis |
| PTC: Papillary thyroid cancer |
| GO ID | Tissue | Disease Stage | Description | Gene Ratio | Bg Ratio | pvalue | p.adjust | Count |
| GO:000756820 | Esophagus | ESCC | aging | 201/8552 | 339/18723 | 2.64e-07 | 3.94e-06 | 201 |
| GO:00715599 | Esophagus | ESCC | response to transforming growth factor beta | 157/8552 | 256/18723 | 2.95e-07 | 4.23e-06 | 157 |
| GO:00715609 | Esophagus | ESCC | cellular response to transforming growth factor beta stimulus | 151/8552 | 250/18723 | 1.78e-06 | 2.10e-05 | 151 |
| GO:00073698 | Esophagus | ESCC | gastrulation | 115/8552 | 185/18723 | 4.35e-06 | 4.64e-05 | 115 |
| GO:00074926 | Esophagus | ESCC | endoderm development | 54/8552 | 77/18723 | 1.20e-05 | 1.12e-04 | 54 |
| GO:00301984 | Esophagus | ESCC | extracellular matrix organization | 171/8552 | 301/18723 | 6.08e-05 | 4.67e-04 | 171 |
| GO:00430624 | Esophagus | ESCC | extracellular structure organization | 171/8552 | 302/18723 | 7.73e-05 | 5.76e-04 | 171 |
| GO:00452294 | Esophagus | ESCC | external encapsulating structure organization | 172/8552 | 304/18723 | 7.80e-05 | 5.80e-04 | 172 |
| GO:00017064 | Esophagus | ESCC | endoderm formation | 38/8552 | 54/18723 | 2.08e-04 | 1.31e-03 | 38 |
| GO:00017044 | Esophagus | ESCC | formation of primary germ layer | 75/8552 | 121/18723 | 2.17e-04 | 1.36e-03 | 75 |
| GO:00359873 | Esophagus | ESCC | endodermal cell differentiation | 32/8552 | 45/18723 | 4.87e-04 | 2.70e-03 | 32 |
| GO:007155911 | Liver | Cirrhotic | response to transforming growth factor beta | 96/4634 | 256/18723 | 3.55e-06 | 6.09e-05 | 96 |
| GO:007156011 | Liver | Cirrhotic | cellular response to transforming growth factor beta stimulus | 93/4634 | 250/18723 | 7.34e-06 | 1.13e-04 | 93 |
| GO:000756812 | Liver | Cirrhotic | aging | 117/4634 | 339/18723 | 3.13e-05 | 3.91e-04 | 117 |
| GO:0014823 | Liver | Cirrhotic | response to activity | 30/4634 | 76/18723 | 3.19e-03 | 1.80e-02 | 30 |
| GO:0007492 | Liver | Cirrhotic | endoderm development | 29/4634 | 77/18723 | 8.02e-03 | 3.76e-02 | 29 |
| GO:000756822 | Liver | HCC | aging | 185/7958 | 339/18723 | 4.28e-06 | 5.50e-05 | 185 |
| GO:007155921 | Liver | HCC | response to transforming growth factor beta | 141/7958 | 256/18723 | 3.08e-05 | 3.16e-04 | 141 |
| GO:007156021 | Liver | HCC | cellular response to transforming growth factor beta stimulus | 137/7958 | 250/18723 | 5.47e-05 | 5.14e-04 | 137 |
| GO:00148231 | Liver | HCC | response to activity | 45/7958 | 76/18723 | 2.42e-03 | 1.18e-02 | 45 |
| Pathway ID | Tissue | Disease Stage | Description | Gene Ratio | Bg Ratio | pvalue | p.adjust | qvalue | Count |
| hsa0516510 | Esophagus | ESCC | Human papillomavirus infection | 215/4205 | 331/8465 | 7.86e-09 | 7.12e-08 | 3.65e-08 | 215 |
| hsa052229 | Esophagus | ESCC | Small cell lung cancer | 69/4205 | 92/8465 | 5.40e-07 | 3.85e-06 | 1.97e-06 | 69 |
| hsa0493310 | Esophagus | ESCC | AGE-RAGE signaling pathway in diabetic complications | 72/4205 | 100/8465 | 4.15e-06 | 2.28e-05 | 1.17e-05 | 72 |
| hsa0451020 | Esophagus | ESCC | Focal adhesion | 127/4205 | 203/8465 | 1.25e-04 | 4.99e-04 | 2.56e-04 | 127 |
| hsa049268 | Esophagus | ESCC | Relaxin signaling pathway | 81/4205 | 129/8465 | 1.72e-03 | 5.09e-03 | 2.61e-03 | 81 |
| hsa041517 | Esophagus | ESCC | PI3K-Akt signaling pathway | 197/4205 | 354/8465 | 1.24e-02 | 2.83e-02 | 1.45e-02 | 197 |
| hsa0516515 | Esophagus | ESCC | Human papillomavirus infection | 215/4205 | 331/8465 | 7.86e-09 | 7.12e-08 | 3.65e-08 | 215 |
| hsa0522216 | Esophagus | ESCC | Small cell lung cancer | 69/4205 | 92/8465 | 5.40e-07 | 3.85e-06 | 1.97e-06 | 69 |
| hsa0493317 | Esophagus | ESCC | AGE-RAGE signaling pathway in diabetic complications | 72/4205 | 100/8465 | 4.15e-06 | 2.28e-05 | 1.17e-05 | 72 |
| hsa04510111 | Esophagus | ESCC | Focal adhesion | 127/4205 | 203/8465 | 1.25e-04 | 4.99e-04 | 2.56e-04 | 127 |
| hsa0492616 | Esophagus | ESCC | Relaxin signaling pathway | 81/4205 | 129/8465 | 1.72e-03 | 5.09e-03 | 2.61e-03 | 81 |
| hsa0415114 | Esophagus | ESCC | PI3K-Akt signaling pathway | 197/4205 | 354/8465 | 1.24e-02 | 2.83e-02 | 1.45e-02 | 197 |
| hsa0451021 | Liver | Cirrhotic | Focal adhesion | 93/2530 | 203/8465 | 9.27e-07 | 1.10e-05 | 6.80e-06 | 93 |
| hsa05165 | Liver | Cirrhotic | Human papillomavirus infection | 124/2530 | 331/8465 | 1.55e-03 | 7.83e-03 | 4.83e-03 | 124 |
| hsa0451031 | Liver | Cirrhotic | Focal adhesion | 93/2530 | 203/8465 | 9.27e-07 | 1.10e-05 | 6.80e-06 | 93 |
| hsa051651 | Liver | Cirrhotic | Human papillomavirus infection | 124/2530 | 331/8465 | 1.55e-03 | 7.83e-03 | 4.83e-03 | 124 |
| hsa0451041 | Liver | HCC | Focal adhesion | 125/4020 | 203/8465 | 3.12e-05 | 1.88e-04 | 1.04e-04 | 125 |
| hsa051652 | Liver | HCC | Human papillomavirus infection | 188/4020 | 331/8465 | 3.34e-04 | 1.49e-03 | 8.29e-04 | 188 |
| hsa049334 | Liver | HCC | AGE-RAGE signaling pathway in diabetic complications | 62/4020 | 100/8465 | 2.35e-03 | 7.95e-03 | 4.42e-03 | 62 |
| hsa052224 | Liver | HCC | Small cell lung cancer | 57/4020 | 92/8465 | 3.54e-03 | 1.12e-02 | 6.22e-03 | 57 |
| Hugo Symbol | Variant Class | Variant Classification | dbSNP RS | HGVSc | HGVSp | HGVSp Short | SWISSPROT | BIOTYPE | SIFT | PolyPhen | Tumor Sample Barcode | Tissue | Histology | Sex | Age | Stage | Therapy Types | Drugs | Outcome |
| COL4A2 | SNV | Missense_Mutation | rs531542947 | c.289G>A | p.Gly97Arg | p.G97R | P08572 | protein_coding | deleterious(0) | probably_damaging(1) | TCGA-A7-A2KD-01 | Breast | breast invasive carcinoma | Female | <65 | III/IV | Chemotherapy | cytoxan | SD |
| COL4A2 | SNV | Missense_Mutation | | c.730N>A | p.Asp244Asn | p.D244N | P08572 | protein_coding | deleterious(0.03) | possibly_damaging(0.651) | TCGA-AC-A23H-01 | Breast | breast invasive carcinoma | Female | >=65 | I/II | Unknown | Unknown | PD |
| COL4A2 | SNV | Missense_Mutation | | c.3910N>A | p.Ala1304Thr | p.A1304T | P08572 | protein_coding | tolerated(0.1) | benign(0.262) | TCGA-AN-A04D-01 | Breast | breast invasive carcinoma | Female | <65 | I/II | Unknown | Unknown | SD |
| COL4A2 | SNV | Missense_Mutation | novel | c.2884G>A | p.Gly962Ser | p.G962S | P08572 | protein_coding | deleterious(0) | probably_damaging(1) | TCGA-AR-A1AO-01 | Breast | breast invasive carcinoma | Female | <65 | I/II | Chemotherapy | doxorubicin | SD |
| COL4A2 | SNV | Missense_Mutation | | c.2728N>C | p.Asp910His | p.D910H | P08572 | protein_coding | tolerated(0.13) | probably_damaging(0.976) | TCGA-B6-A0RT-01 | Breast | breast invasive carcinoma | Female | <65 | III/IV | Unknown | Unknown | SD |
| COL4A2 | SNV | Missense_Mutation | | c.3088N>T | p.Gly1030Cys | p.G1030C | P08572 | protein_coding | deleterious(0.02) | probably_damaging(0.994) | TCGA-BH-A18G-01 | Breast | breast invasive carcinoma | Female | >=65 | I/II | Unknown | Unknown | SD |
| COL4A2 | SNV | Missense_Mutation | | c.2323N>A | p.Glu775Lys | p.E775K | P08572 | protein_coding | deleterious(0.01) | possibly_damaging(0.824) | TCGA-D8-A27G-01 | Breast | breast invasive carcinoma | Female | >=65 | I/II | Unknown | Unknown | SD |
| COL4A2 | SNV | Missense_Mutation | | c.1865N>T | p.Gly622Val | p.G622V | P08572 | protein_coding | deleterious(0) | probably_damaging(0.999) | TCGA-E2-A1LG-01 | Breast | breast invasive carcinoma | Female | <65 | I/II | Chemotherapy | doxorubicin | SD |
| COL4A2 | SNV | Missense_Mutation | | c.4229N>A | p.Arg1410Gln | p.R1410Q | P08572 | protein_coding | tolerated(0.61) | benign(0.19) | TCGA-E2-A1LG-01 | Breast | breast invasive carcinoma | Female | <65 | I/II | Chemotherapy | doxorubicin | SD |
| COL4A2 | SNV | Missense_Mutation | rs373521529 | c.1832N>T | p.Thr611Met | p.T611M | P08572 | protein_coding | tolerated(0.1) | benign(0.015) | TCGA-LL-A73Y-01 | Breast | breast invasive carcinoma | Female | >=65 | I/II | Chemotherapy | taxotere | SD |


