| Tissue | Expression Dynamics | Abbreviation |
| Endometrium | 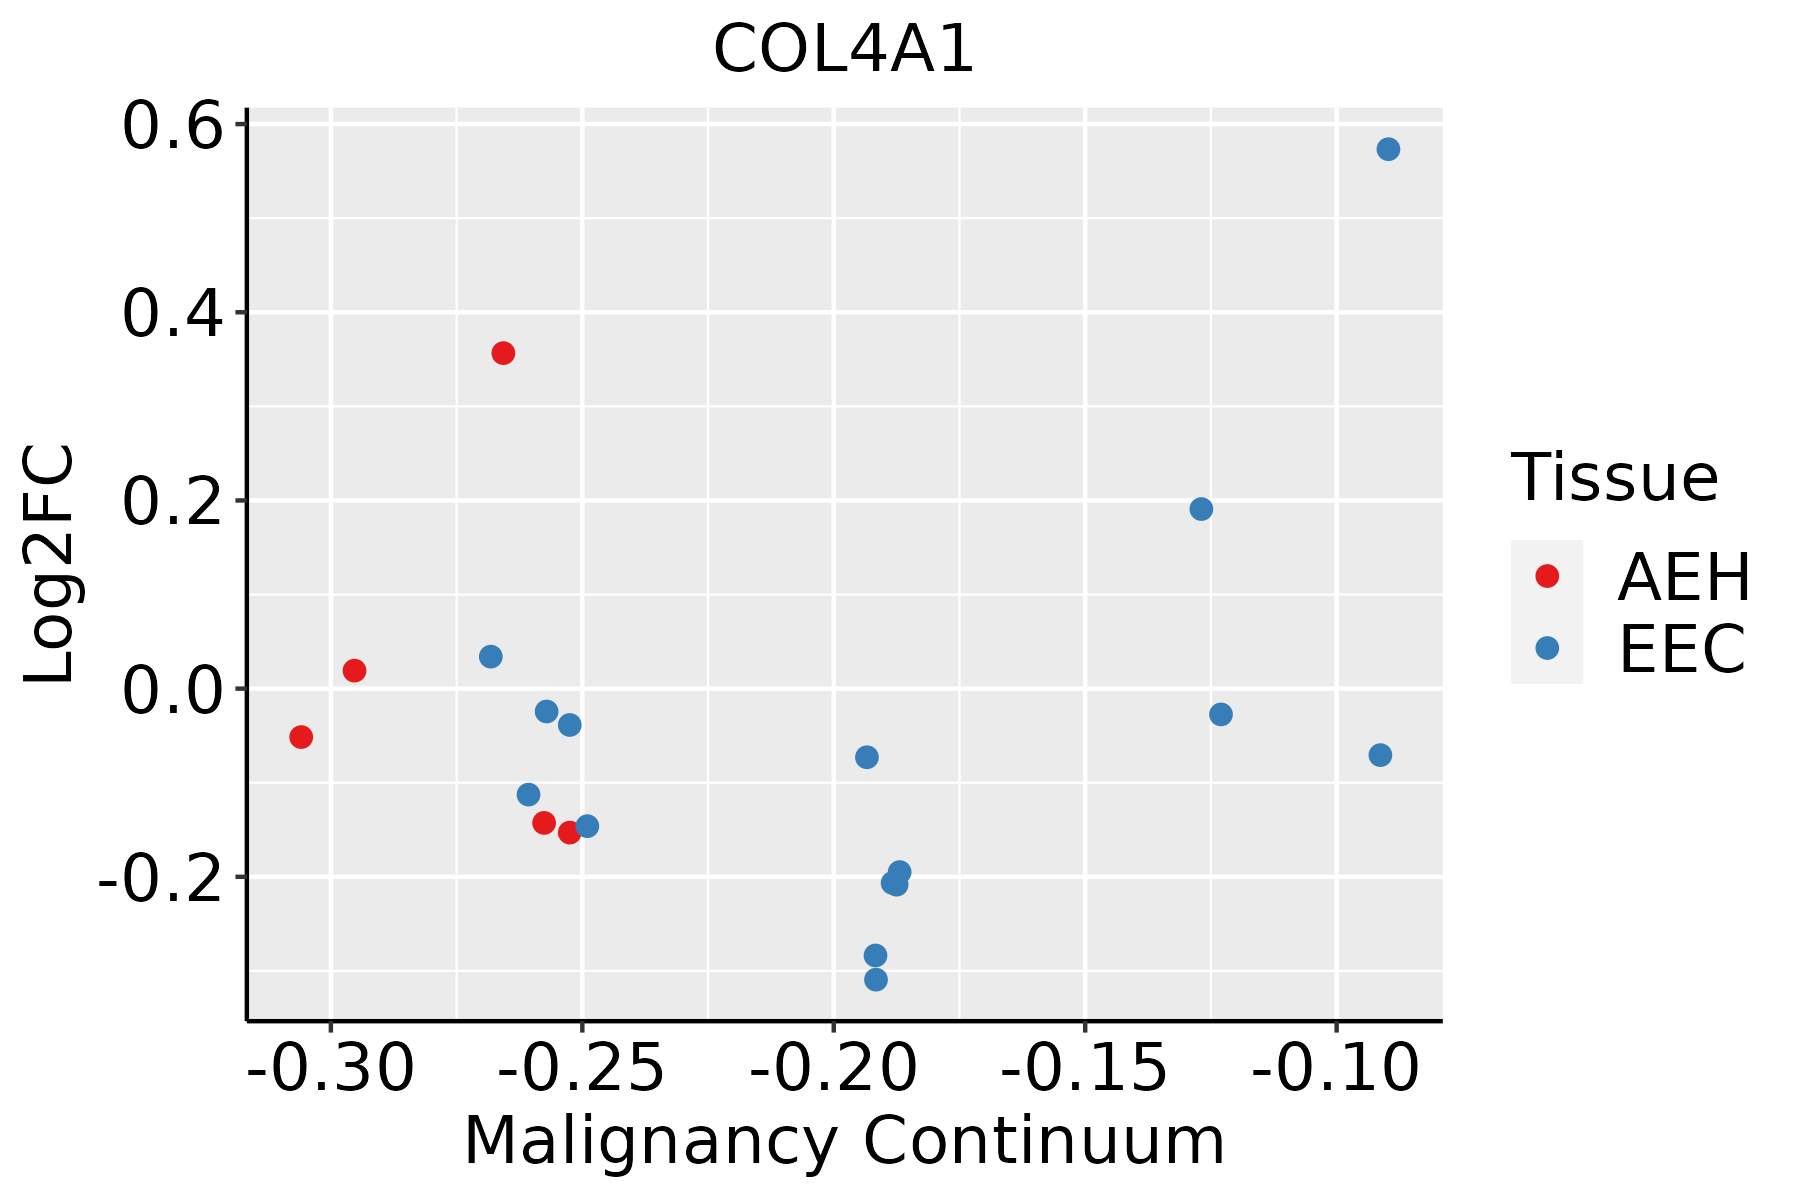 | AEH: Atypical endometrial hyperplasia |
| EEC: Endometrioid Cancer |
| Esophagus | 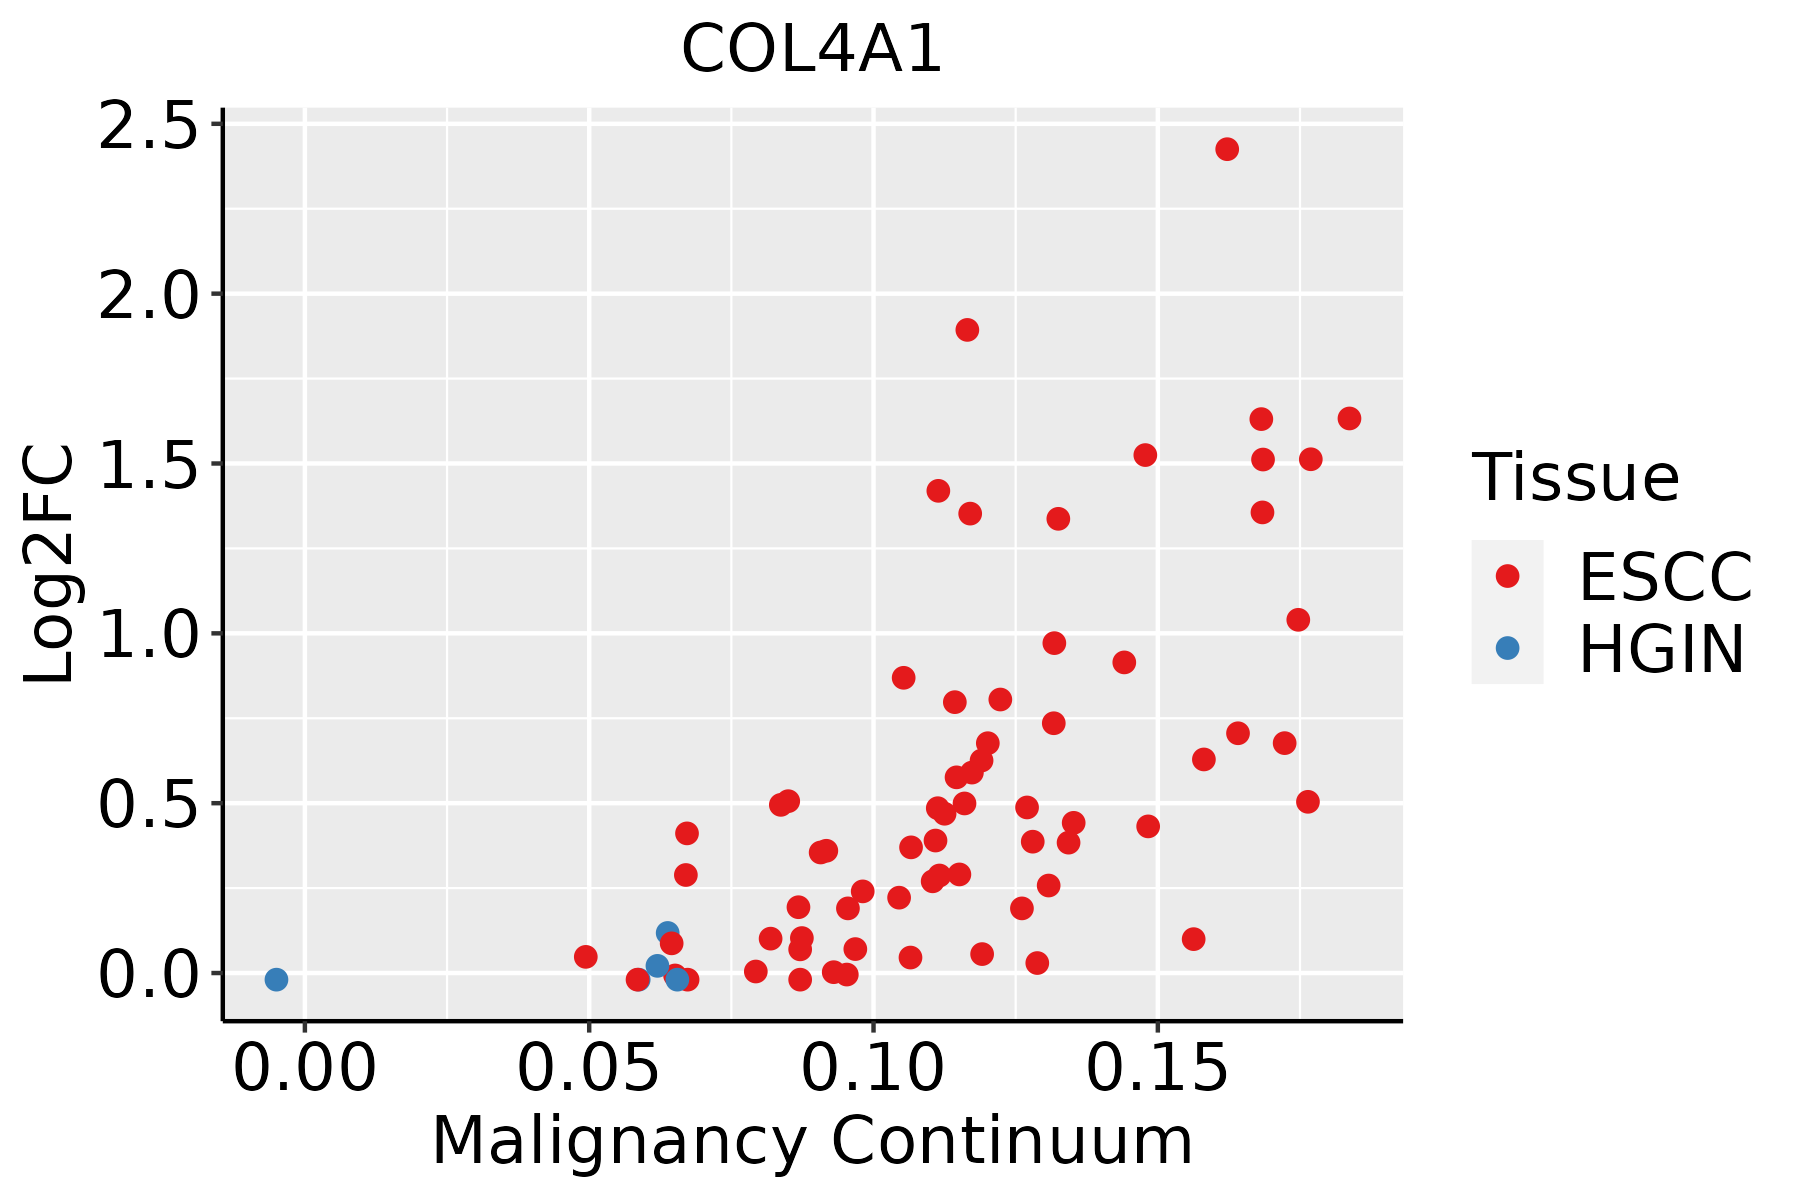 | ESCC: Esophageal squamous cell carcinoma |
| HGIN: High-grade intraepithelial neoplasias |
| LGIN: Low-grade intraepithelial neoplasias |
| Liver |  | HCC: Hepatocellular carcinoma |
| NAFLD: Non-alcoholic fatty liver disease |
| Lung |  | AAH: Atypical adenomatous hyperplasia |
| AIS: Adenocarcinoma in situ |
| IAC: Invasive lung adenocarcinoma |
| MIA: Minimally invasive adenocarcinoma |
| Oral Cavity |  | EOLP: Erosive Oral lichen planus |
| LP: leukoplakia |
| NEOLP: Non-erosive oral lichen planus |
| OSCC: Oral squamous cell carcinoma |
| Prostate |  | BPH: Benign Prostatic Hyperplasia |
| Thyroid |  | ATC: Anaplastic thyroid cancer |
| HT: Hashimoto's thyroiditis |
| PTC: Papillary thyroid cancer |
| GO ID | Tissue | Disease Stage | Description | Gene Ratio | Bg Ratio | pvalue | p.adjust | Count |
| GO:00016556 | Endometrium | AEH | urogenital system development | 67/2100 | 338/18723 | 2.30e-06 | 6.76e-05 | 67 |
| GO:00720015 | Endometrium | AEH | renal system development | 61/2100 | 302/18723 | 3.43e-06 | 9.24e-05 | 61 |
| GO:00605627 | Endometrium | AEH | epithelial tube morphogenesis | 63/2100 | 325/18723 | 9.63e-06 | 2.23e-04 | 63 |
| GO:00611384 | Endometrium | AEH | morphogenesis of a branching epithelium | 40/2100 | 182/18723 | 2.16e-05 | 4.20e-04 | 40 |
| GO:00017637 | Endometrium | AEH | morphogenesis of a branching structure | 42/2100 | 196/18723 | 2.58e-05 | 4.86e-04 | 42 |
| GO:00487542 | Endometrium | AEH | branching morphogenesis of an epithelial tube | 33/2100 | 151/18723 | 1.22e-04 | 1.68e-03 | 33 |
| GO:00613263 | Endometrium | AEH | renal tubule development | 22/2100 | 94/18723 | 5.89e-04 | 5.82e-03 | 22 |
| GO:00011017 | Endometrium | AEH | response to acid chemical | 28/2100 | 135/18723 | 9.24e-04 | 8.43e-03 | 28 |
| GO:0061333 | Endometrium | AEH | renal tubule morphogenesis | 18/2100 | 75/18723 | 1.32e-03 | 1.12e-02 | 18 |
| GO:00432005 | Endometrium | AEH | response to amino acid | 24/2100 | 116/18723 | 2.14e-03 | 1.65e-02 | 24 |
| GO:00508086 | Endometrium | AEH | synapse organization | 67/2100 | 426/18723 | 2.67e-03 | 1.94e-02 | 67 |
| GO:00712302 | Endometrium | AEH | cellular response to amino acid stimulus | 16/2100 | 71/18723 | 4.68e-03 | 2.99e-02 | 16 |
| GO:00712293 | Endometrium | AEH | cellular response to acid chemical | 17/2100 | 80/18723 | 6.76e-03 | 3.94e-02 | 17 |
| GO:000165512 | Endometrium | EEC | urogenital system development | 69/2168 | 338/18723 | 1.70e-06 | 5.18e-05 | 69 |
| GO:007200112 | Endometrium | EEC | renal system development | 63/2168 | 302/18723 | 2.24e-06 | 6.59e-05 | 63 |
| GO:006056213 | Endometrium | EEC | epithelial tube morphogenesis | 64/2168 | 325/18723 | 1.35e-05 | 2.70e-04 | 64 |
| GO:006113812 | Endometrium | EEC | morphogenesis of a branching epithelium | 41/2168 | 182/18723 | 1.96e-05 | 3.57e-04 | 41 |
| GO:000176313 | Endometrium | EEC | morphogenesis of a branching structure | 43/2168 | 196/18723 | 2.47e-05 | 4.37e-04 | 43 |
| GO:00487541 | Endometrium | EEC | branching morphogenesis of an epithelial tube | 33/2168 | 151/18723 | 2.23e-04 | 2.67e-03 | 33 |
| GO:000110113 | Endometrium | EEC | response to acid chemical | 29/2168 | 135/18723 | 6.98e-04 | 6.68e-03 | 29 |
| Pathway ID | Tissue | Disease Stage | Description | Gene Ratio | Bg Ratio | pvalue | p.adjust | qvalue | Count |
| hsa0451015 | Endometrium | AEH | Focal adhesion | 58/1197 | 203/8465 | 4.99e-08 | 7.37e-07 | 5.39e-07 | 58 |
| hsa051466 | Endometrium | AEH | Amoebiasis | 29/1197 | 102/8465 | 1.22e-04 | 1.10e-03 | 8.06e-04 | 29 |
| hsa049337 | Endometrium | AEH | AGE-RAGE signaling pathway in diabetic complications | 28/1197 | 100/8465 | 2.11e-04 | 1.80e-03 | 1.32e-03 | 28 |
| hsa0451016 | Endometrium | AEH | Focal adhesion | 58/1197 | 203/8465 | 4.99e-08 | 7.37e-07 | 5.39e-07 | 58 |
| hsa0514613 | Endometrium | AEH | Amoebiasis | 29/1197 | 102/8465 | 1.22e-04 | 1.10e-03 | 8.06e-04 | 29 |
| hsa0493314 | Endometrium | AEH | AGE-RAGE signaling pathway in diabetic complications | 28/1197 | 100/8465 | 2.11e-04 | 1.80e-03 | 1.32e-03 | 28 |
| hsa0451024 | Endometrium | EEC | Focal adhesion | 58/1237 | 203/8465 | 1.61e-07 | 2.30e-06 | 1.71e-06 | 58 |
| hsa0493321 | Endometrium | EEC | AGE-RAGE signaling pathway in diabetic complications | 28/1237 | 100/8465 | 3.68e-04 | 3.03e-03 | 2.26e-03 | 28 |
| hsa0514622 | Endometrium | EEC | Amoebiasis | 28/1237 | 102/8465 | 5.23e-04 | 3.83e-03 | 2.85e-03 | 28 |
| hsa0451034 | Endometrium | EEC | Focal adhesion | 58/1237 | 203/8465 | 1.61e-07 | 2.30e-06 | 1.71e-06 | 58 |
| hsa0493331 | Endometrium | EEC | AGE-RAGE signaling pathway in diabetic complications | 28/1237 | 100/8465 | 3.68e-04 | 3.03e-03 | 2.26e-03 | 28 |
| hsa0514632 | Endometrium | EEC | Amoebiasis | 28/1237 | 102/8465 | 5.23e-04 | 3.83e-03 | 2.85e-03 | 28 |
| hsa0516510 | Esophagus | ESCC | Human papillomavirus infection | 215/4205 | 331/8465 | 7.86e-09 | 7.12e-08 | 3.65e-08 | 215 |
| hsa052229 | Esophagus | ESCC | Small cell lung cancer | 69/4205 | 92/8465 | 5.40e-07 | 3.85e-06 | 1.97e-06 | 69 |
| hsa0493310 | Esophagus | ESCC | AGE-RAGE signaling pathway in diabetic complications | 72/4205 | 100/8465 | 4.15e-06 | 2.28e-05 | 1.17e-05 | 72 |
| hsa0451020 | Esophagus | ESCC | Focal adhesion | 127/4205 | 203/8465 | 1.25e-04 | 4.99e-04 | 2.56e-04 | 127 |
| hsa049268 | Esophagus | ESCC | Relaxin signaling pathway | 81/4205 | 129/8465 | 1.72e-03 | 5.09e-03 | 2.61e-03 | 81 |
| hsa041517 | Esophagus | ESCC | PI3K-Akt signaling pathway | 197/4205 | 354/8465 | 1.24e-02 | 2.83e-02 | 1.45e-02 | 197 |
| hsa0516515 | Esophagus | ESCC | Human papillomavirus infection | 215/4205 | 331/8465 | 7.86e-09 | 7.12e-08 | 3.65e-08 | 215 |
| hsa0522216 | Esophagus | ESCC | Small cell lung cancer | 69/4205 | 92/8465 | 5.40e-07 | 3.85e-06 | 1.97e-06 | 69 |
| Hugo Symbol | Variant Class | Variant Classification | dbSNP RS | HGVSc | HGVSp | HGVSp Short | SWISSPROT | BIOTYPE | SIFT | PolyPhen | Tumor Sample Barcode | Tissue | Histology | Sex | Age | Stage | Therapy Types | Drugs | Outcome |
| COL4A1 | SNV | Missense_Mutation | | c.667N>C | p.Ser223Arg | p.S223R | P02462 | protein_coding | tolerated(0.09) | possibly_damaging(0.571) | TCGA-A8-A08G-01 | Breast | breast invasive carcinoma | Female | <65 | I/II | Chemotherapy | 5-fluorouracil | CR |
| COL4A1 | SNV | Missense_Mutation | novel | c.3467N>T | p.Asp1156Val | p.D1156V | P02462 | protein_coding | deleterious(0) | probably_damaging(0.999) | TCGA-A8-A09E-01 | Breast | breast invasive carcinoma | Female | >=65 | III/IV | Hormone Therapy | anastrozole | SD |
| COL4A1 | SNV | Missense_Mutation | rs367914388 | c.2559A>G | p.Ile853Met | p.I853M | P02462 | protein_coding | tolerated(0.21) | possibly_damaging(0.629) | TCGA-AC-A23C-01 | Breast | breast invasive carcinoma | Female | <65 | I/II | Chemotherapy | chemo | CR |
| COL4A1 | SNV | Missense_Mutation | | c.3220N>A | p.Phe1074Ile | p.F1074I | P02462 | protein_coding | tolerated(0.13) | probably_damaging(0.991) | TCGA-AC-A23H-01 | Breast | breast invasive carcinoma | Female | >=65 | I/II | Unknown | Unknown | PD |
| COL4A1 | SNV | Missense_Mutation | rs753989899 | c.343N>A | p.Gly115Ser | p.G115S | P02462 | protein_coding | deleterious(0) | probably_damaging(1) | TCGA-AN-A03Y-01 | Breast | breast invasive carcinoma | Female | >=65 | I/II | Unknown | Unknown | SD |
| COL4A1 | SNV | Missense_Mutation | novel | c.4395N>C | p.Lys1465Asn | p.K1465N | P02462 | protein_coding | tolerated(0.34) | benign(0.268) | TCGA-AN-A046-01 | Breast | breast invasive carcinoma | Female | >=65 | I/II | Unknown | Unknown | SD |
| COL4A1 | SNV | Missense_Mutation | novel | c.2863N>A | p.Glu955Lys | p.E955K | P02462 | protein_coding | tolerated(0.32) | probably_damaging(0.979) | TCGA-AN-A046-01 | Breast | breast invasive carcinoma | Female | >=65 | I/II | Unknown | Unknown | SD |
| COL4A1 | SNV | Missense_Mutation | novel | c.781N>A | p.Gly261Ser | p.G261S | P02462 | protein_coding | deleterious(0) | possibly_damaging(0.49) | TCGA-AO-A0JB-01 | Breast | breast invasive carcinoma | Female | <65 | III/IV | Chemotherapy | cyclophosphamide | SD |
| COL4A1 | SNV | Missense_Mutation | novel | c.3716G>A | p.Gly1239Glu | p.G1239E | P02462 | protein_coding | deleterious(0) | probably_damaging(1) | TCGA-AO-A0JD-01 | Breast | breast invasive carcinoma | Female | <65 | III/IV | Chemotherapy | cyclophosphamide | SD |
| COL4A1 | SNV | Missense_Mutation | | c.3307N>A | p.Gly1103Arg | p.G1103R | P02462 | protein_coding | deleterious(0) | probably_damaging(1) | TCGA-AR-A1AP-01 | Breast | breast invasive carcinoma | Female | >=65 | I/II | Hormone Therapy | anastrozole | SD |


