
|
|||||
|
 | |
| |
| |
| |
| |
| |
|
Gene: COL3A1 |
Gene summary for COL3A1 |
| Gene information | Species | Human | Gene symbol | COL3A1 | Gene ID | 1281 |
| Gene name | collagen type III alpha 1 chain | |
| Gene Alias | EDS4A | |
| Cytomap | 2q32.2 | |
| Gene Type | protein-coding | GO ID | GO:0001501 | UniProtAcc | P02461 |
Top |
Malignant transformation analysis |
| Identification of the aberrant gene expression in precancerous and cancerous lesions by comparing the gene expression of stem-like cells in diseased tissues with normal stem cells |
| Entrez ID | Symbol | Replicates | Species | Organ | Tissue | Adj P-value | Log2FC | Malignancy |
| 1281 | COL3A1 | HSIL_HPV_1 | Human | Cervix | HSIL_HPV | 2.02e-03 | 3.34e-01 | 0.0116 |
| 1281 | COL3A1 | N_HPV_1 | Human | Cervix | N_HPV | 2.36e-04 | 2.85e-01 | 0.0079 |
| 1281 | COL3A1 | N_HPV_2 | Human | Cervix | N_HPV | 9.30e-07 | 3.13e-01 | -0.0131 |
| 1281 | COL3A1 | H2 | Human | Cervix | HSIL_HPV | 7.82e-09 | 3.48e-01 | 0.0632 |
| 1281 | COL3A1 | AEH-subject1 | Human | Endometrium | AEH | 3.62e-43 | -1.26e+00 | -0.3059 |
| 1281 | COL3A1 | AEH-subject2 | Human | Endometrium | AEH | 3.21e-48 | -1.29e+00 | -0.2525 |
| 1281 | COL3A1 | AEH-subject3 | Human | Endometrium | AEH | 2.67e-36 | -1.13e+00 | -0.2576 |
| 1281 | COL3A1 | AEH-subject4 | Human | Endometrium | AEH | 1.03e-02 | -4.21e-01 | -0.2657 |
| 1281 | COL3A1 | AEH-subject5 | Human | Endometrium | AEH | 9.00e-46 | -1.22e+00 | -0.2953 |
| 1281 | COL3A1 | EEC-subject1 | Human | Endometrium | EEC | 2.31e-56 | -1.37e+00 | -0.2682 |
| 1281 | COL3A1 | EEC-subject2 | Human | Endometrium | EEC | 6.30e-65 | -1.41e+00 | -0.2607 |
| 1281 | COL3A1 | EEC-subject3 | Human | Endometrium | EEC | 3.62e-61 | -1.21e+00 | -0.2525 |
| 1281 | COL3A1 | EEC-subject4 | Human | Endometrium | EEC | 3.15e-45 | -1.19e+00 | -0.2571 |
| 1281 | COL3A1 | EEC-subject5 | Human | Endometrium | EEC | 3.39e-58 | -1.36e+00 | -0.249 |
| 1281 | COL3A1 | GSM5276934 | Human | Endometrium | EEC | 4.13e-40 | -1.17e+00 | -0.0913 |
| 1281 | COL3A1 | GSM5276935 | Human | Endometrium | EEC | 1.85e-66 | -1.45e+00 | -0.123 |
| 1281 | COL3A1 | GSM5276937 | Human | Endometrium | EEC | 8.55e-19 | -8.14e-01 | -0.0897 |
| 1281 | COL3A1 | GSM6177620_NYU_UCEC1_lib1_lib1 | Human | Endometrium | EEC | 1.60e-61 | -1.48e+00 | -0.1869 |
| 1281 | COL3A1 | GSM6177620_NYU_UCEC1_lib2_lib2 | Human | Endometrium | EEC | 1.11e-55 | -1.48e+00 | -0.1875 |
| 1281 | COL3A1 | GSM6177620_NYU_UCEC1_lib3_lib3 | Human | Endometrium | EEC | 2.19e-63 | -1.48e+00 | -0.1883 |
| Page: 1 2 3 4 5 |
| Tissue | Expression Dynamics | Abbreviation |
| Cervix | 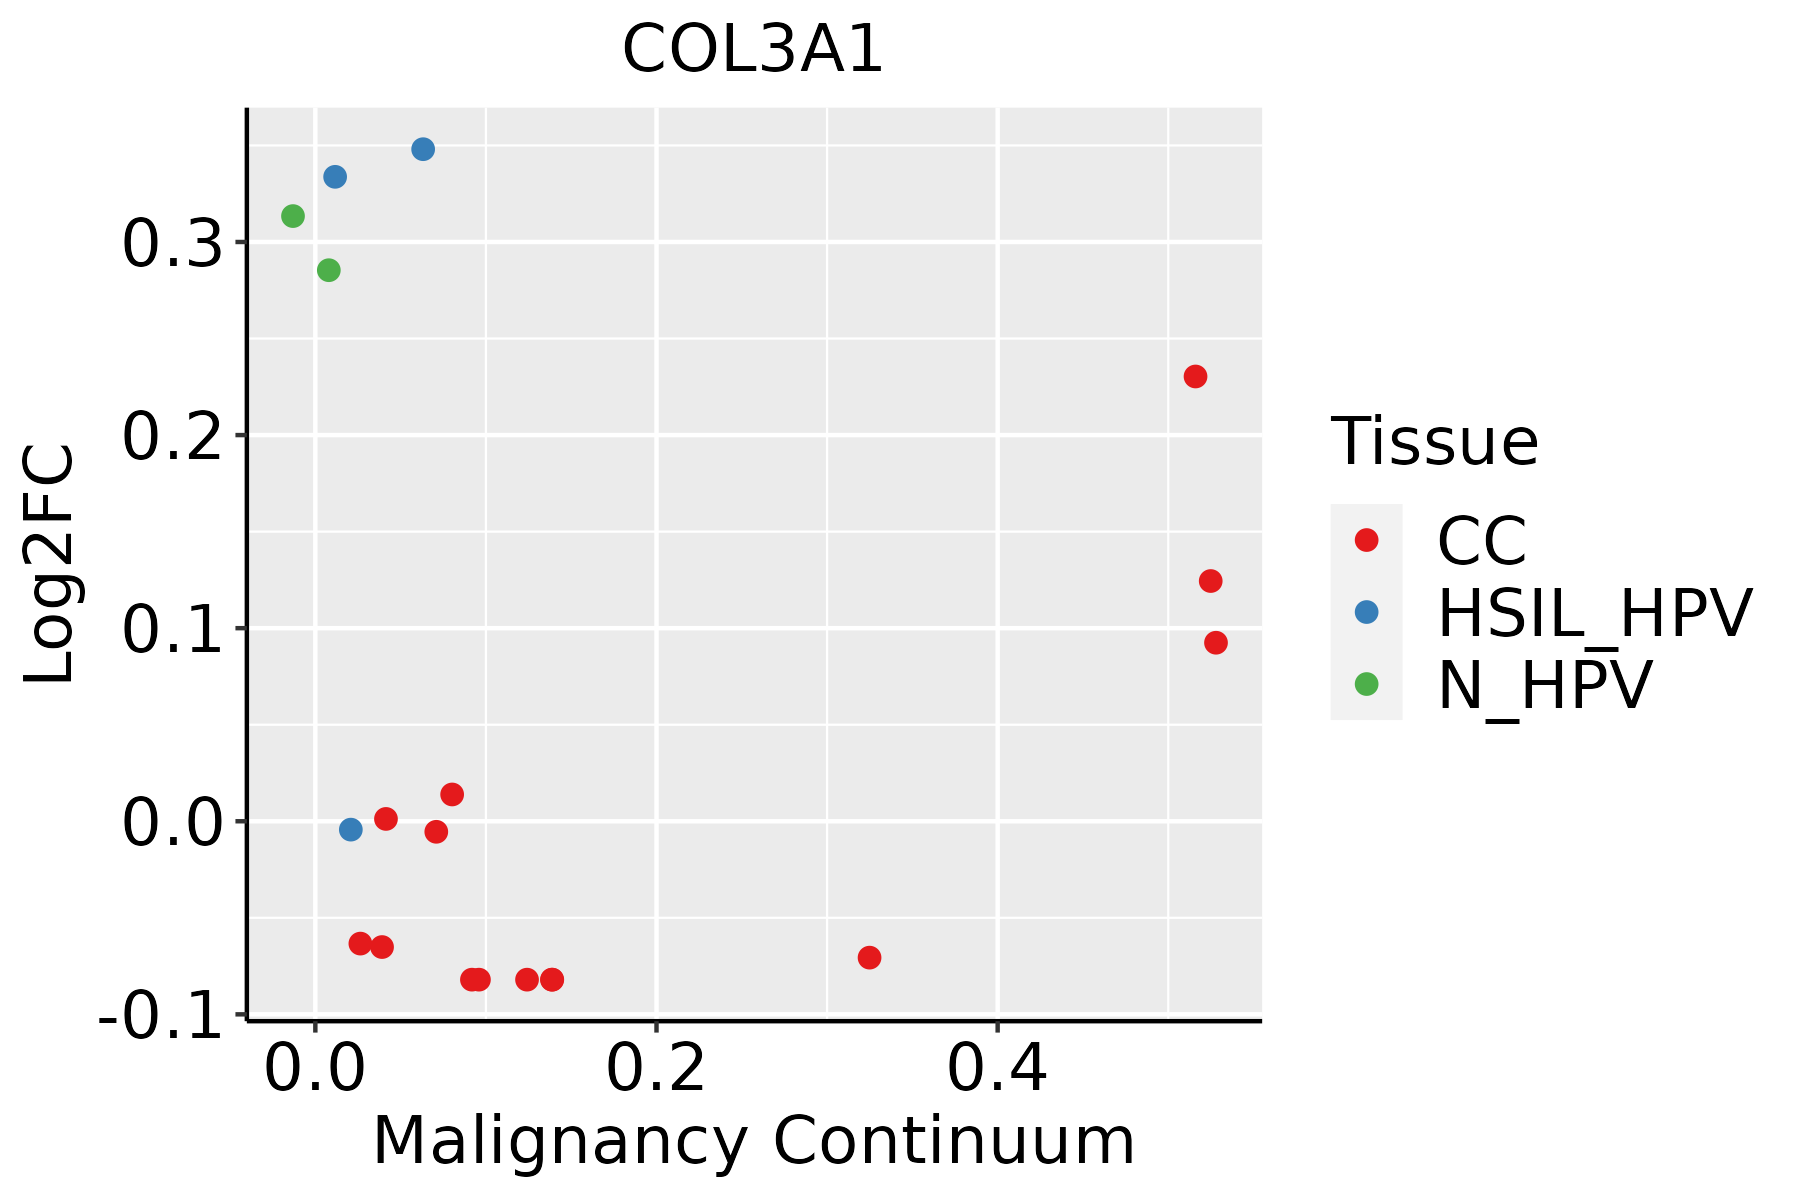 | CC: Cervix cancer |
| HSIL_HPV: HPV-infected high-grade squamous intraepithelial lesions | ||
| N_HPV: HPV-infected normal cervix | ||
| Endometrium | 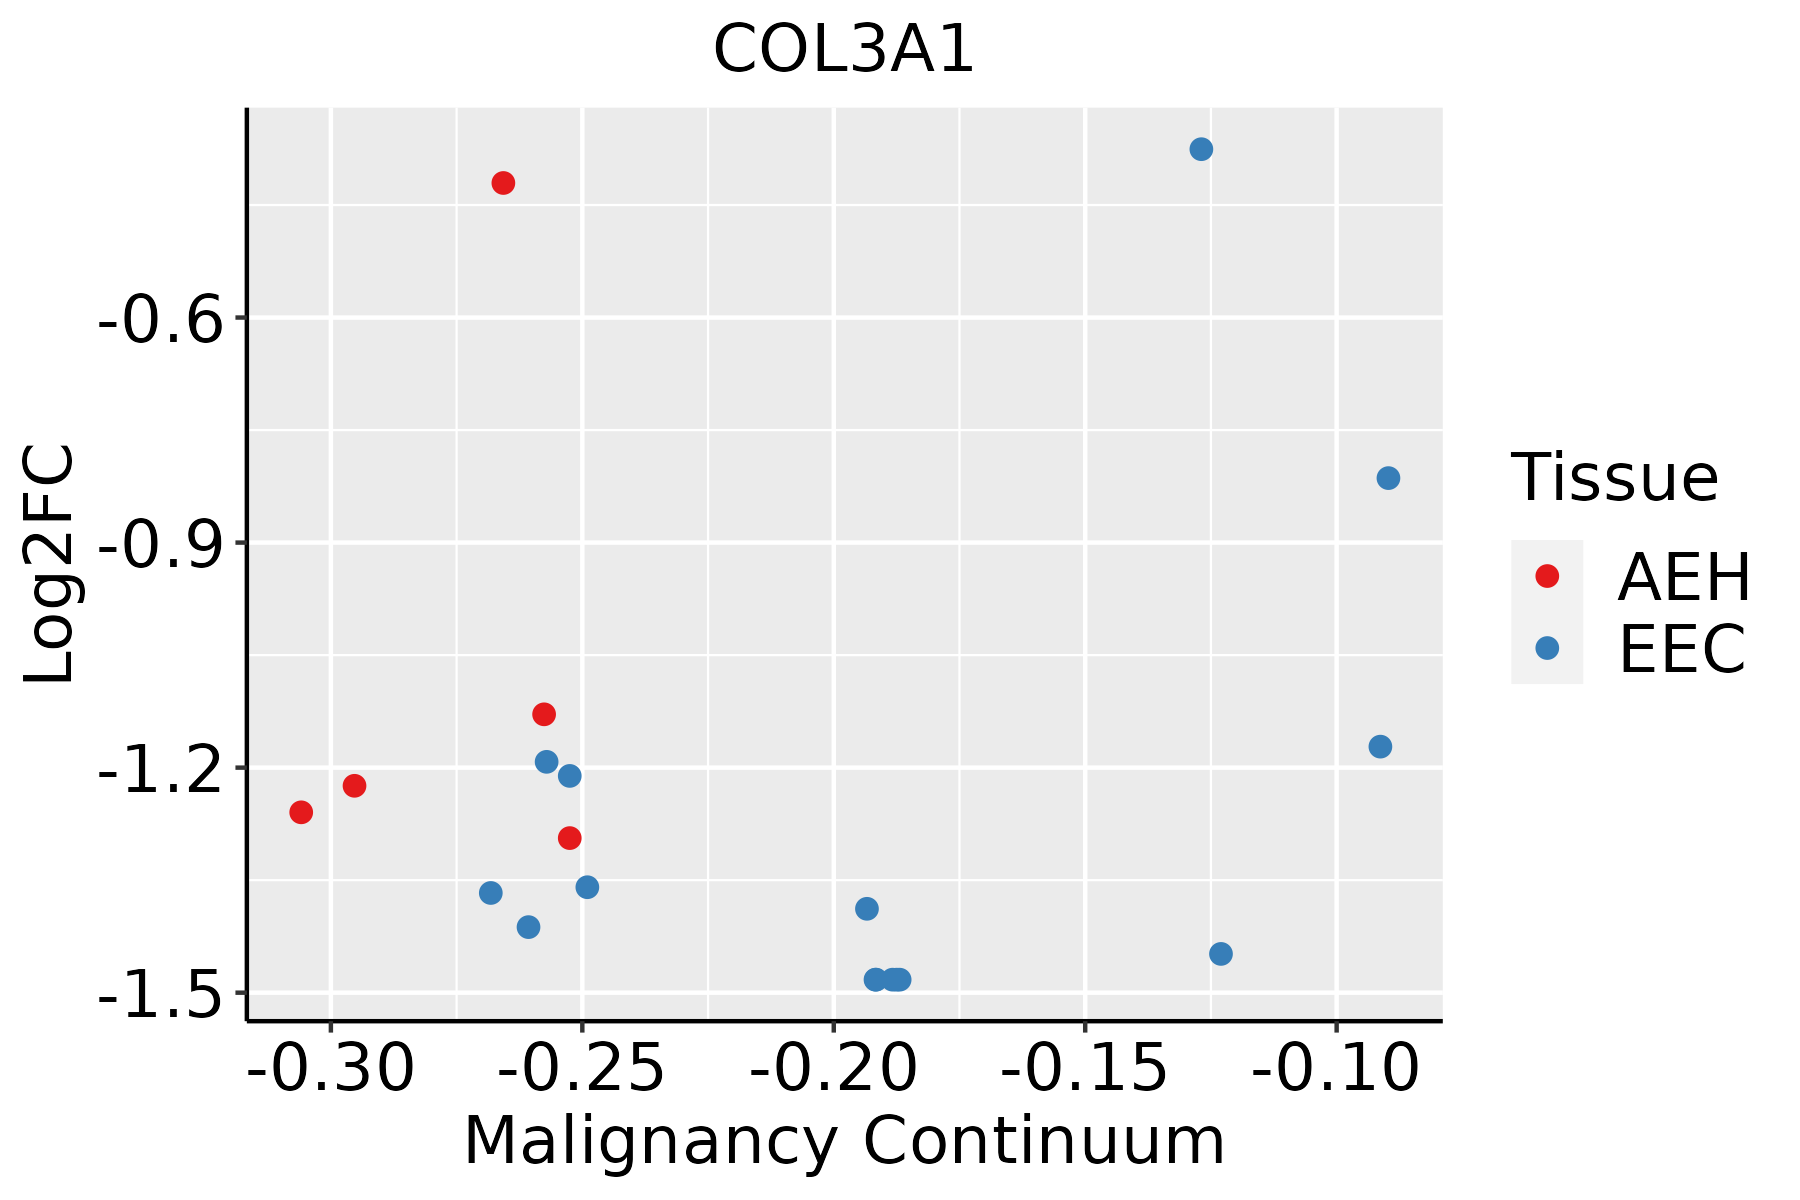 | AEH: Atypical endometrial hyperplasia |
| EEC: Endometrioid Cancer | ||
| Esophagus |  | ESCC: Esophageal squamous cell carcinoma |
| HGIN: High-grade intraepithelial neoplasias | ||
| LGIN: Low-grade intraepithelial neoplasias | ||
| Liver |  | HCC: Hepatocellular carcinoma |
| NAFLD: Non-alcoholic fatty liver disease | ||
| Lung | 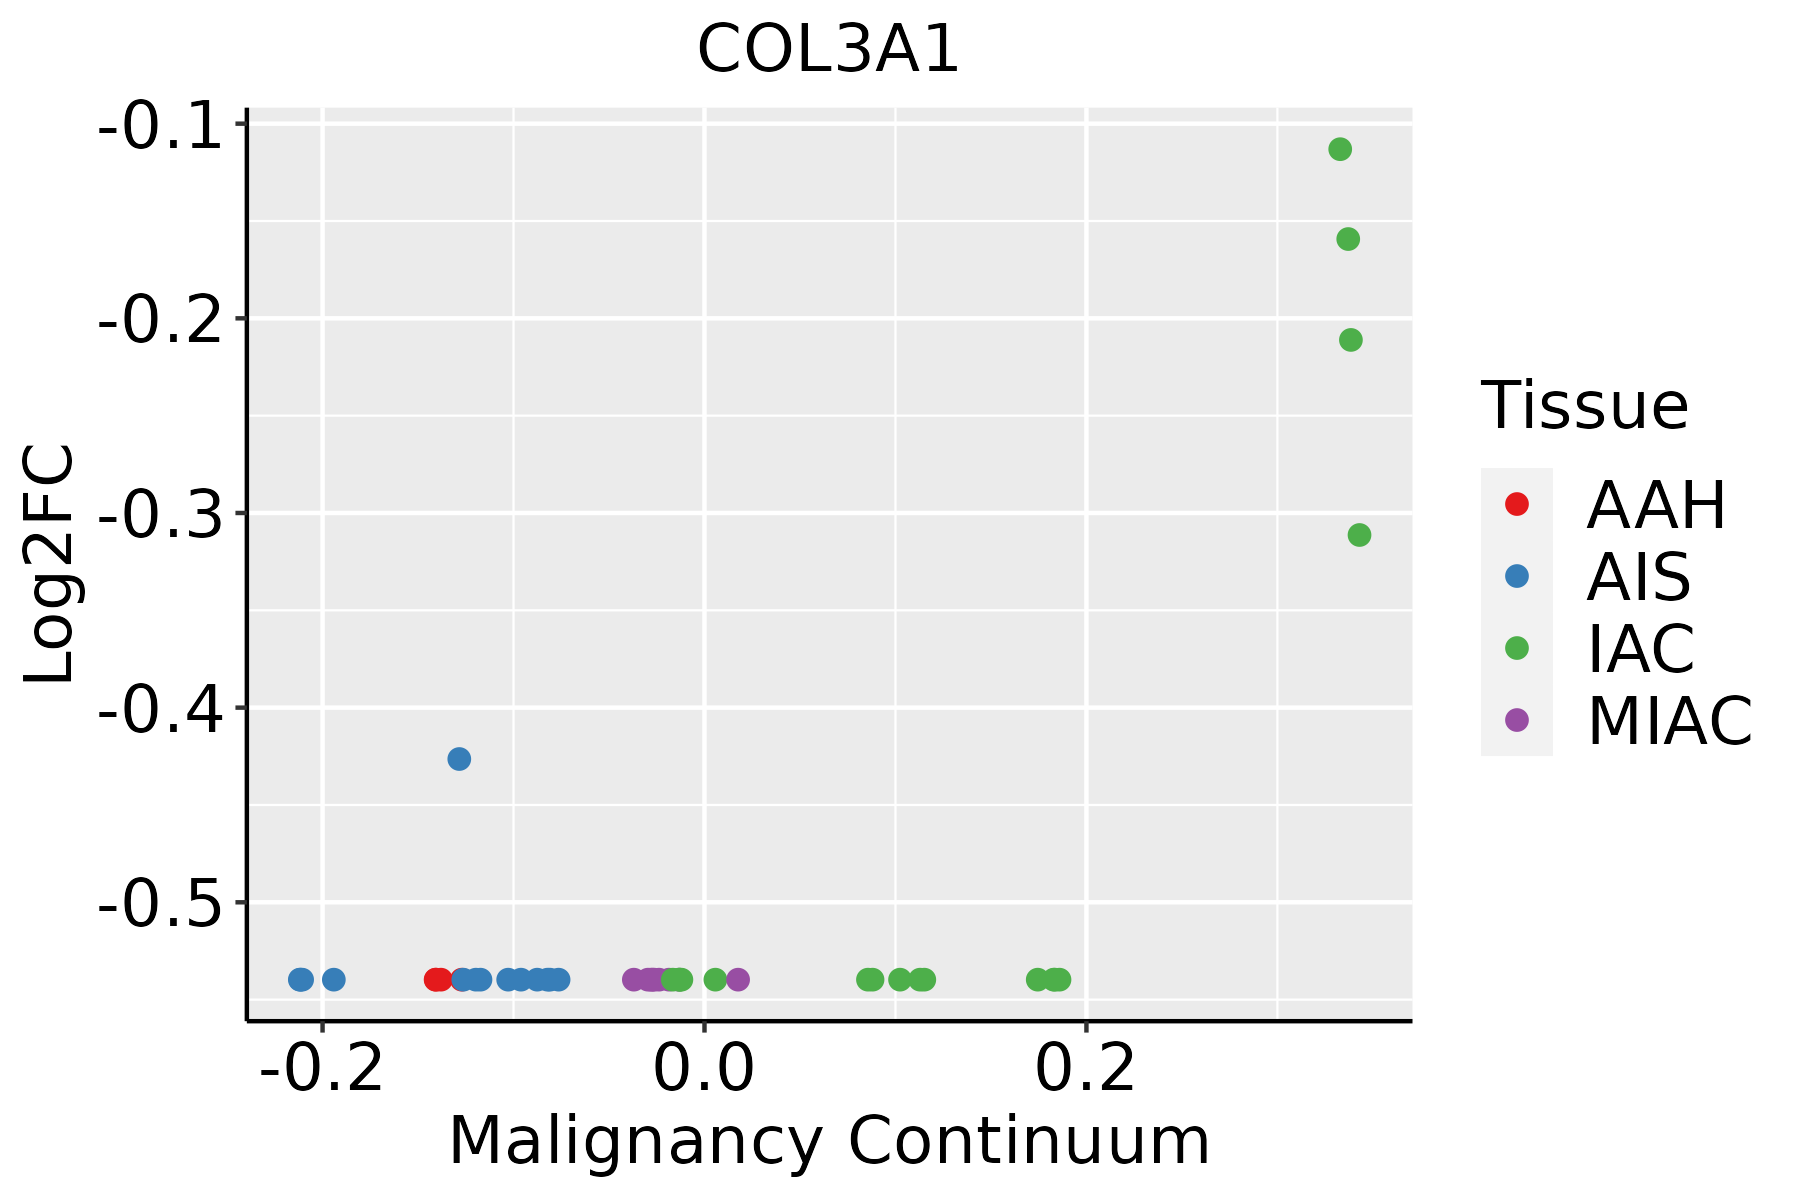 | AAH: Atypical adenomatous hyperplasia |
| AIS: Adenocarcinoma in situ | ||
| IAC: Invasive lung adenocarcinoma | ||
| MIA: Minimally invasive adenocarcinoma | ||
| Oral Cavity | 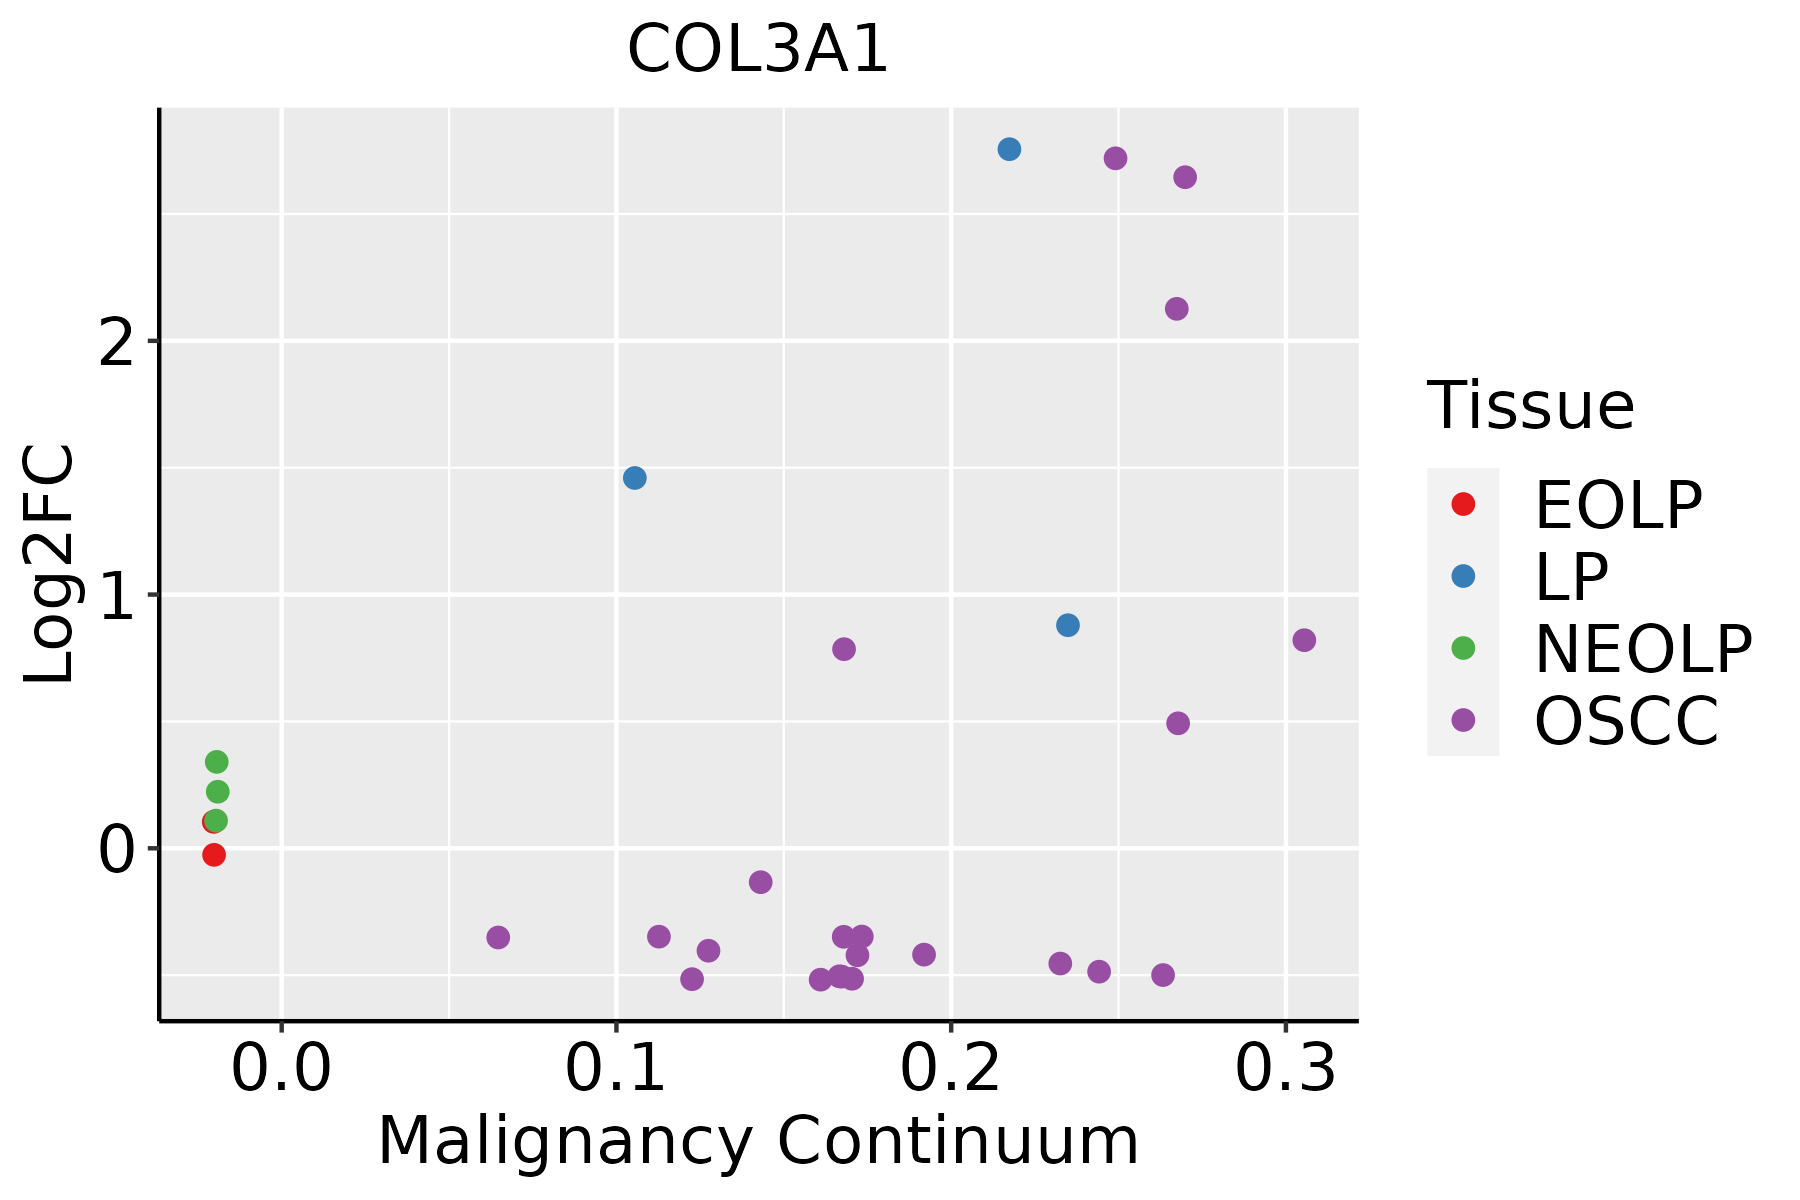 | EOLP: Erosive Oral lichen planus |
| LP: leukoplakia | ||
| NEOLP: Non-erosive oral lichen planus | ||
| OSCC: Oral squamous cell carcinoma | ||
| Skin |  | AK: Actinic keratosis |
| cSCC: Cutaneous squamous cell carcinoma | ||
| SCCIS:squamous cell carcinoma in situ | ||
| Thyroid | 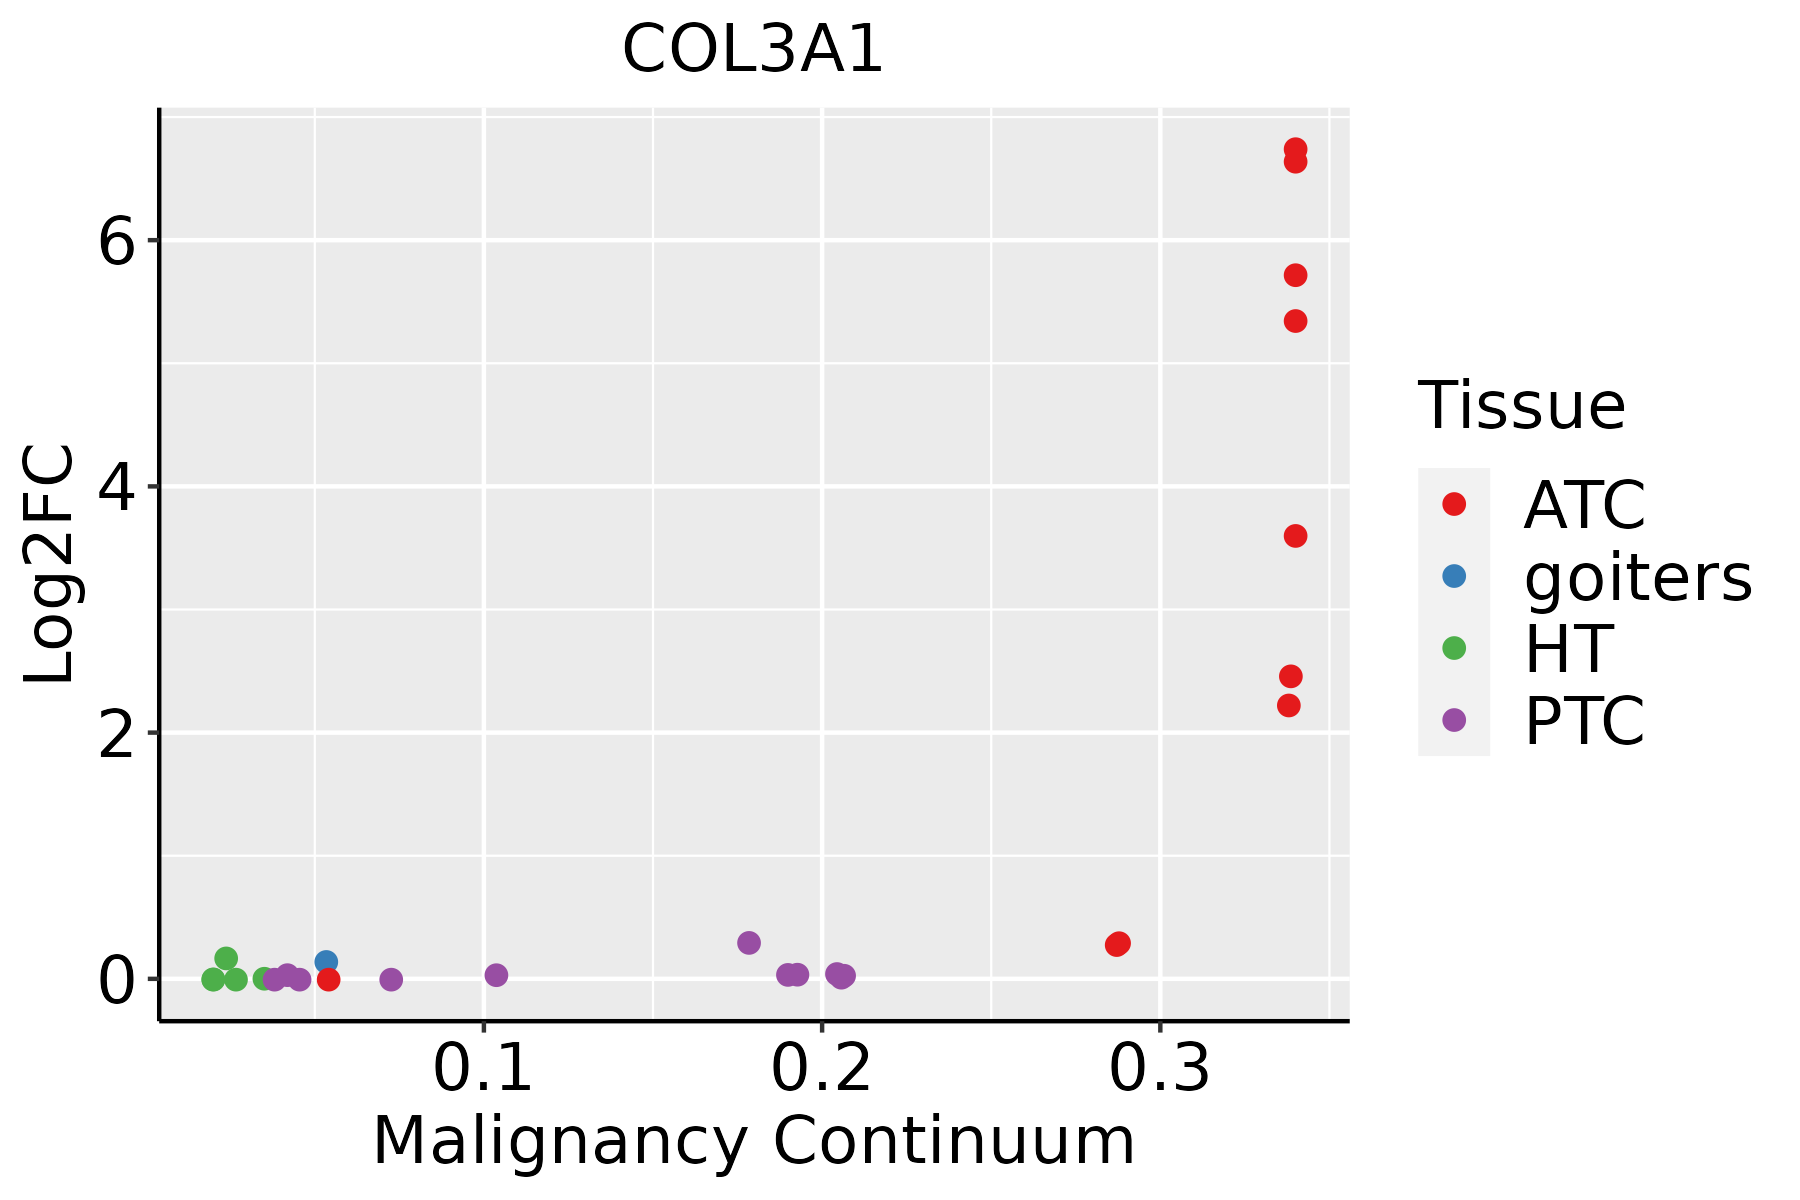 | ATC: Anaplastic thyroid cancer |
| HT: Hashimoto's thyroiditis | ||
| PTC: Papillary thyroid cancer |
| ∗log2FC in expression of this searched gene in stem-like cells from each diseased tissue sample relative to stem-like cells in normal samples in each tissue plotted against the malignancy continuum. Samples are colored based on if they are from different disease stage. |
Top |
Malignant transformation related pathway analysis |
| Find out the enriched GO biological processes and KEGG pathways involved in transition from healthy to precancer to cancer |
| Tissue | Disease Stage | Enriched GO biological Processes |
| Colorectum | AD |  |
| Colorectum | SER |  |
| Colorectum | MSS |  |
| Colorectum | MSI-H |  |
| Colorectum | FAP |  |
| ∗Top 15 enriched GO BP terms are showed in the bar plot of each disease state in each tissue. Each row represents a significant GO biological process which is colored according to the -log10(p.adjust). |
| Page: 1 2 3 4 5 6 7 8 9 |
| GO ID | Tissue | Disease Stage | Description | Gene Ratio | Bg Ratio | pvalue | p.adjust | Count |
| GO:000722913 | Cervix | HSIL_HPV | integrin-mediated signaling pathway | 19/737 | 107/18723 | 3.37e-08 | 2.76e-06 | 19 |
| GO:004358813 | Cervix | HSIL_HPV | skin development | 31/737 | 263/18723 | 5.32e-08 | 3.89e-06 | 31 |
| GO:004206015 | Cervix | HSIL_HPV | wound healing | 40/737 | 422/18723 | 2.80e-07 | 1.61e-05 | 40 |
| GO:005087814 | Cervix | HSIL_HPV | regulation of body fluid levels | 37/737 | 379/18723 | 3.81e-07 | 2.06e-05 | 37 |
| GO:000268312 | Cervix | HSIL_HPV | negative regulation of immune system process | 39/737 | 434/18723 | 1.51e-06 | 6.60e-05 | 39 |
| GO:00181491 | Cervix | HSIL_HPV | peptide cross-linking | 8/737 | 35/18723 | 5.08e-05 | 1.26e-03 | 8 |
| GO:000717913 | Cervix | HSIL_HPV | transforming growth factor beta receptor signaling pathway | 20/737 | 198/18723 | 1.12e-04 | 2.33e-03 | 20 |
| GO:003158914 | Cervix | HSIL_HPV | cell-substrate adhesion | 30/737 | 363/18723 | 1.12e-04 | 2.34e-03 | 30 |
| GO:000961212 | Cervix | HSIL_HPV | response to mechanical stimulus | 21/737 | 216/18723 | 1.31e-04 | 2.61e-03 | 21 |
| GO:000759612 | Cervix | HSIL_HPV | blood coagulation | 21/737 | 217/18723 | 1.40e-04 | 2.77e-03 | 21 |
| GO:000759912 | Cervix | HSIL_HPV | hemostasis | 21/737 | 222/18723 | 1.92e-04 | 3.56e-03 | 21 |
| GO:005081712 | Cervix | HSIL_HPV | coagulation | 21/737 | 222/18723 | 1.92e-04 | 3.56e-03 | 21 |
| GO:00301681 | Cervix | HSIL_HPV | platelet activation | 14/737 | 123/18723 | 3.46e-04 | 5.47e-03 | 14 |
| GO:007156013 | Cervix | HSIL_HPV | cellular response to transforming growth factor beta stimulus | 21/737 | 250/18723 | 9.34e-04 | 1.18e-02 | 21 |
| GO:007155913 | Cervix | HSIL_HPV | response to transforming growth factor beta | 21/737 | 256/18723 | 1.26e-03 | 1.48e-02 | 21 |
| GO:00507771 | Cervix | HSIL_HPV | negative regulation of immune response | 17/737 | 194/18723 | 1.76e-03 | 1.88e-02 | 17 |
| GO:000717813 | Cervix | HSIL_HPV | transmembrane receptor protein serine/threonine kinase signaling pathway | 26/737 | 355/18723 | 1.86e-03 | 1.97e-02 | 26 |
| GO:000268322 | Cervix | N_HPV | negative regulation of immune system process | 32/534 | 434/18723 | 1.02e-06 | 5.61e-05 | 32 |
| GO:000961222 | Cervix | N_HPV | response to mechanical stimulus | 19/534 | 216/18723 | 1.46e-05 | 4.55e-04 | 19 |
| GO:004206025 | Cervix | N_HPV | wound healing | 28/534 | 422/18723 | 3.37e-05 | 8.58e-04 | 28 |
| Page: 1 2 3 4 5 6 7 8 9 10 11 12 13 14 15 16 17 18 |
| Pathway ID | Tissue | Disease Stage | Description | Gene Ratio | Bg Ratio | pvalue | p.adjust | qvalue | Count |
| hsa0541524 | Cervix | HSIL_HPV | Diabetic cardiomyopathy | 30/459 | 203/8465 | 4.38e-07 | 1.07e-05 | 8.64e-06 | 30 |
| hsa0541534 | Cervix | HSIL_HPV | Diabetic cardiomyopathy | 30/459 | 203/8465 | 4.38e-07 | 1.07e-05 | 8.64e-06 | 30 |
| hsa0541544 | Cervix | N_HPV | Diabetic cardiomyopathy | 29/349 | 203/8465 | 3.64e-09 | 1.10e-07 | 8.60e-08 | 29 |
| hsa0541554 | Cervix | N_HPV | Diabetic cardiomyopathy | 29/349 | 203/8465 | 3.64e-09 | 1.10e-07 | 8.60e-08 | 29 |
| hsa0541525 | Endometrium | AEH | Diabetic cardiomyopathy | 86/1197 | 203/8465 | 2.62e-23 | 1.22e-21 | 8.90e-22 | 86 |
| hsa051466 | Endometrium | AEH | Amoebiasis | 29/1197 | 102/8465 | 1.22e-04 | 1.10e-03 | 8.06e-04 | 29 |
| hsa049337 | Endometrium | AEH | AGE-RAGE signaling pathway in diabetic complications | 28/1197 | 100/8465 | 2.11e-04 | 1.80e-03 | 1.32e-03 | 28 |
| hsa05415111 | Endometrium | AEH | Diabetic cardiomyopathy | 86/1197 | 203/8465 | 2.62e-23 | 1.22e-21 | 8.90e-22 | 86 |
| hsa0514613 | Endometrium | AEH | Amoebiasis | 29/1197 | 102/8465 | 1.22e-04 | 1.10e-03 | 8.06e-04 | 29 |
| hsa0493314 | Endometrium | AEH | AGE-RAGE signaling pathway in diabetic complications | 28/1197 | 100/8465 | 2.11e-04 | 1.80e-03 | 1.32e-03 | 28 |
| hsa0541526 | Endometrium | EEC | Diabetic cardiomyopathy | 86/1237 | 203/8465 | 2.59e-22 | 9.46e-21 | 7.05e-21 | 86 |
| hsa0493321 | Endometrium | EEC | AGE-RAGE signaling pathway in diabetic complications | 28/1237 | 100/8465 | 3.68e-04 | 3.03e-03 | 2.26e-03 | 28 |
| hsa0514622 | Endometrium | EEC | Amoebiasis | 28/1237 | 102/8465 | 5.23e-04 | 3.83e-03 | 2.85e-03 | 28 |
| hsa0541535 | Endometrium | EEC | Diabetic cardiomyopathy | 86/1237 | 203/8465 | 2.59e-22 | 9.46e-21 | 7.05e-21 | 86 |
| hsa0493331 | Endometrium | EEC | AGE-RAGE signaling pathway in diabetic complications | 28/1237 | 100/8465 | 3.68e-04 | 3.03e-03 | 2.26e-03 | 28 |
| hsa0514632 | Endometrium | EEC | Amoebiasis | 28/1237 | 102/8465 | 5.23e-04 | 3.83e-03 | 2.85e-03 | 28 |
| hsa05415211 | Esophagus | ESCC | Diabetic cardiomyopathy | 146/4205 | 203/8465 | 5.81e-11 | 7.78e-10 | 3.99e-10 | 146 |
| hsa0493310 | Esophagus | ESCC | AGE-RAGE signaling pathway in diabetic complications | 72/4205 | 100/8465 | 4.15e-06 | 2.28e-05 | 1.17e-05 | 72 |
| hsa049268 | Esophagus | ESCC | Relaxin signaling pathway | 81/4205 | 129/8465 | 1.72e-03 | 5.09e-03 | 2.61e-03 | 81 |
| hsa0541538 | Esophagus | ESCC | Diabetic cardiomyopathy | 146/4205 | 203/8465 | 5.81e-11 | 7.78e-10 | 3.99e-10 | 146 |
| Page: 1 2 3 4 |
Top |
Cell-cell communication analysis |
| Identification of potential cell-cell interactions between two cell types and their ligand-receptor pairs for different disease states |
| Ligand | Receptor | LRpair | Pathway | Tissue | Disease Stage |
| Page: 1 |
Top |
Single-cell gene regulatory network inference analysis |
| Find out the significant the regulons (TFs) and the target genes of each regulon across cell types for different disease states |
| TF | Cell Type | Tissue | Disease Stage | Target Gene | RSS | Regulon Activity |
| ∗The dot plots of a searched regulon are shown for all cell subpopulations in each disease state of each tissue based on the regulon specific score inferred using pySCENIC and by calculating the average expression. |
| Page: 1 |
Top |
Somatic mutation of malignant transformation related genes |
| Annotation of somatic variants for genes involved in malignant transformation |
| Hugo Symbol | Variant Class | Variant Classification | dbSNP RS | HGVSc | HGVSp | HGVSp Short | SWISSPROT | BIOTYPE | SIFT | PolyPhen | Tumor Sample Barcode | Tissue | Histology | Sex | Age | Stage | Therapy Types | Drugs | Outcome |
| COL3A1 | SNV | Missense_Mutation | c.2590N>T | p.Gly864Cys | p.G864C | P02461 | protein_coding | deleterious(0) | probably_damaging(1) | TCGA-A2-A25A-01 | Breast | breast invasive carcinoma | Female | <65 | I/II | Unspecific | Cytoxan | SD | |
| COL3A1 | SNV | Missense_Mutation | c.127N>C | p.Asp43His | p.D43H | P02461 | protein_coding | deleterious(0.01) | probably_damaging(1) | TCGA-A7-A4SE-01 | Breast | breast invasive carcinoma | Female | <65 | I/II | Chemotherapy | adriamycin | CR | |
| COL3A1 | SNV | Missense_Mutation | c.667N>T | p.Pro223Ser | p.P223S | P02461 | protein_coding | deleterious(0.03) | probably_damaging(0.974) | TCGA-A7-A4SE-01 | Breast | breast invasive carcinoma | Female | <65 | I/II | Chemotherapy | adriamycin | CR | |
| COL3A1 | SNV | Missense_Mutation | c.893N>T | p.Pro298Leu | p.P298L | P02461 | protein_coding | tolerated(0.17) | benign(0.355) | TCGA-A8-A07U-01 | Breast | breast invasive carcinoma | Female | >=65 | III/IV | Chemotherapy | 5-fluorouracil | SD | |
| COL3A1 | SNV | Missense_Mutation | c.3924N>C | p.Leu1308Phe | p.L1308F | P02461 | protein_coding | deleterious(0.04) | benign(0.035) | TCGA-AC-A23H-01 | Breast | breast invasive carcinoma | Female | >=65 | I/II | Unknown | Unknown | PD | |
| COL3A1 | SNV | Missense_Mutation | novel | c.2738N>A | p.Ala913Asp | p.A913D | P02461 | protein_coding | deleterious(0.02) | benign(0.03) | TCGA-AN-A046-01 | Breast | breast invasive carcinoma | Female | >=65 | I/II | Unknown | Unknown | SD |
| COL3A1 | SNV | Missense_Mutation | c.3858A>T | p.Lys1286Asn | p.K1286N | P02461 | protein_coding | tolerated(0.38) | benign(0.227) | TCGA-BH-A18G-01 | Breast | breast invasive carcinoma | Female | >=65 | I/II | Unknown | Unknown | SD | |
| COL3A1 | SNV | Missense_Mutation | rs776478974 | c.3775G>A | p.Ala1259Thr | p.A1259T | P02461 | protein_coding | deleterious(0.01) | probably_damaging(0.999) | TCGA-E2-A1IF-01 | Breast | breast invasive carcinoma | Female | >=65 | I/II | Hormone Therapy | arimidex | SD |
| COL3A1 | SNV | Missense_Mutation | novel | c.3822N>A | p.Ser1274Arg | p.S1274R | P02461 | protein_coding | deleterious(0) | probably_damaging(0.999) | TCGA-OL-A5RW-01 | Breast | breast invasive carcinoma | Female | <65 | I/II | Chemotherapy | adriamycin | CR |
| COL3A1 | SNV | Missense_Mutation | rs863223362 | c.2110N>A | p.Glu704Lys | p.E704K | P02461 | protein_coding | deleterious(0.01) | benign(0.057) | TCGA-C5-A7CL-01 | Cervix | cervical & endocervical cancer | Female | <65 | III/IV | Chemotherapy | cisplatin | PD |
| Page: 1 2 3 4 5 6 7 8 9 10 11 12 13 14 15 16 17 18 19 20 21 22 23 24 |
Top |
Related drugs of malignant transformation related genes |
| Identification of chemicals and drugs interact with genes involved in malignant transfromation |
| (DGIdb 4.0) |
| Entrez ID | Symbol | Category | Interaction Types | Drug Claim Name | Drug Name | PMIDs |
| 1281 | COL3A1 | DRUGGABLE GENOME | CHEMBL2108709 | COLLAGENASE CLOSTRIDIUM HISTOLYTICUM | ||
| 1281 | COL3A1 | DRUGGABLE GENOME | COLLAGENASE CLOSTRIDIUM HISTOLYTICUM | |||
| 1281 | COL3A1 | DRUGGABLE GENOME | COLLAGENASE | COLLAGENASE CLOSTRIDIUM HISTOLYTICUM | ||
| 1281 | COL3A1 | DRUGGABLE GENOME | COLLAGENASE CLOSTRIDIUM HISTOLYTICUM | |||
| 1281 | COL3A1 | DRUGGABLE GENOME | CHEMBL2095222 | OCRIPLASMIN |
| Page: 1 |

Copyright 2023-Present -The University of Texas Health Science Center at Houston |